Aurobindo Pharma
BSE SENSEX
23,759
Bloomberg
Equity Shares (m)
M.Cap.(INRb)/(USDb)
52-Week Range (INR)
1, 6, 12 Rel. Per (%)
Avg Val, INRm/ Vol m
Free float (%)
S&P CNX
7,216
ARBP IN
584.8
404.5 / 6.0
892/491
-14/8/50
1,689.1 / 1.7
46.1
10 February 2016
Q3FY16 Results Update | Sector: Healthcare
CMP: INR692
TP: INR1,100 (+59%)
Buy
Financials & Valuations (INR b)
Y/E Mar
2016E 2017E 2018E
Sales
138.2 163.1 192.4
EBITDA
31.9
39.2
48.7
NP
20.1
25.4
32.1
EPS (Rs)
34.5
43.5
55.0
EPS Gr (%)
24.4
26.3
26.5
BV/Sh (Rs)
119.7 160.7 213.3
RoE (%)
33.1
31.0
29.4
RoCE (%)
29.2
30.6
32.0
P/E (x)
20.1
15.9
12.6
P/BV (x)
5.8
4.3
3.2
Estimate change
TP change
Rating change
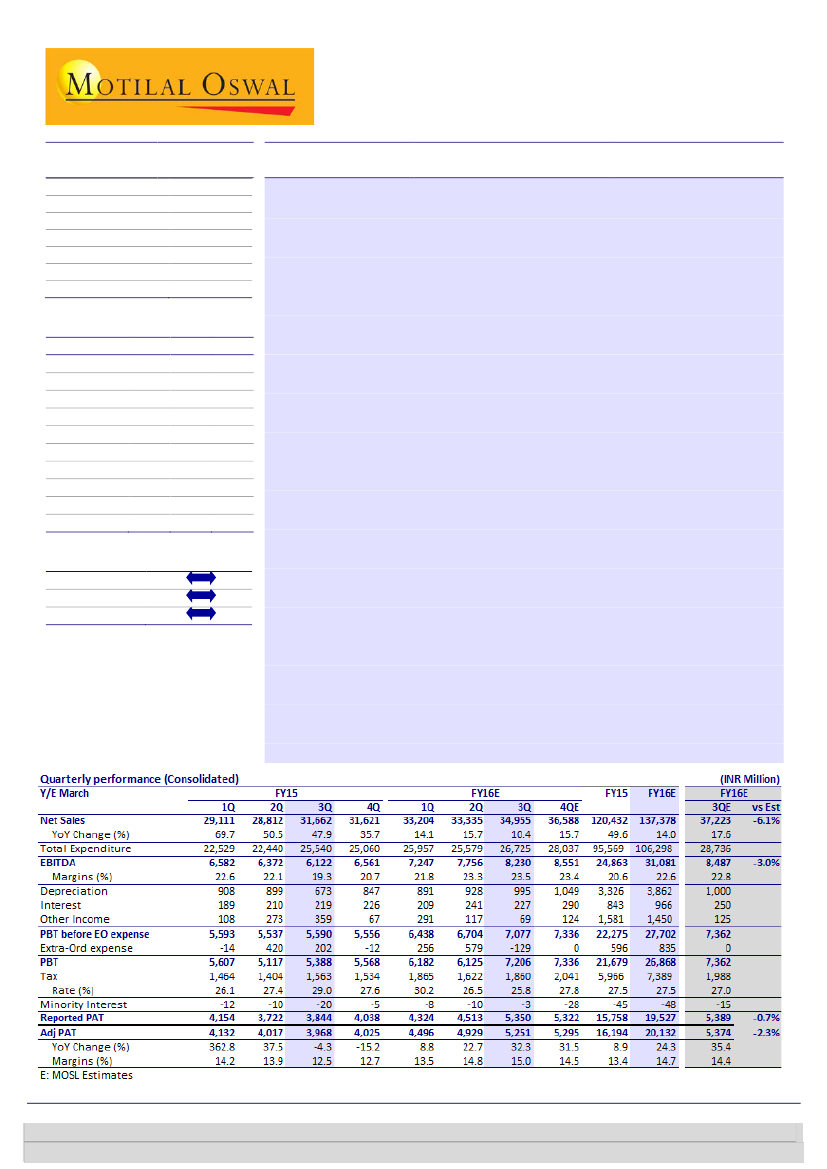
ARBP reported 3QFY16 results with net sales at INR 34.96b, driven by strong US
numbers (up 31% YoY growth) partially offset by weak Europe (down 9.6% YoY due
to currency depreciation). EBITDA came in at INR8.2m, up 34% YoY (~3% miss)
with PAT at INR5.35b, up 39% YoY (in-line with est). We believe strong pace of
approvals in the US and improving profitability of EU business is likely to drive
overall margins and earnings growth for the company.
EBITDA margins continue to expand:
EBITDA margin at 23.5% (up >400bps YoY),
improved for the fourth quarter in a row on the back of strong US sales and cost
efficiency achieved in Europe. We expect EBITDA margin to increase to 25.3% in
FY18E from 20.6% in FY15, on the back of a) strong launch pipeline in US, and (b)
cost efficiency in EU (Margins expected to be in high single digit by FY18).
Strong momentum in US sales to continue:
US sales came in at USD240m (vs USD
228m in 2Q). We expect US sales to grow at this robust pace in coming quarters on
the back of ramp-up of existing launches including (Integrilin, Isosulfan, etc) and
upcoming launches like Meropenem, Valgancyclovir, Angiomax, and Nexium etc.
Debt reduction continues:
The company reported debt reduction of USD50m QoQ
in 3Q (USD70m YTD). Going forward, we expect FCF generation momentum to
pick-up further (greater than USD300m between FY17 & FY18) on the back of US
sales ramp-up and margin improvement in EU.
Regulatory concerns unwarranted- Buy on weakness:
ARBP stock has corrected
~18% in last one month primarily due to concerns related to observations raised by
US FDA at Unit VII plant. We believe that concerns related to 483 observations at
unit VII are unwarranted as there are no data integrity issues and most importantly
company has received two approvals (on 2
nd
& 5
th
Feb) from this facility post the
inspection. At CMP, ARBP trades at 15.9x FY17E and 12.6x FY18E— at ~20%
discount to peers. Going ahead, valuation gap is expected to narrow down on the
back of increasing profitability and strong free cash flows generation. ARBP
remains one of our top pick in the sector with a target price of INR1,100 @ 20x
FY18E PER (vs INR1,050 @ 20x 1H FY18E PER).
In line result; FCF generation bodes well
Investors are advised to refer through important disclosures made at the last page of the Research Report.
Motilal Oswal research is available on www.motilaloswal.com/Institutional-Equities, Bloomberg, Thomson Reuters, Factset and S&P Capital.
Kumar Saurabh
(Kumar.Saurabh@MotilalOswal.com); +91 22 3982 5584
Amey Chalke
(amey.chalke@motilaloswal.com); +91 22 39825423

Aurobindo Pharma
Business highlights
In 3QFY16, overall sales grew 10%Yoy to INR35b, led by sustained growth in US
business. US business grew 31%YoY to INR15.7b driven by new product launches
over last nine months, whereas, EU business reported 9% decline as sales stood at
INR10b in 3Q. ARV formulation and API segment grew 7% and 3% respectively.
Exhibit 1: High sales growth, led by US
Total sales
49
69
50
22
24
29
29
47
32
35
14
32
34
15
34
10
% YoY growth
35
22
30
16 16
41
39
28
19
17
Source: Company, MOSL
EBITDA margins at historical high
EBITDA increased 34% YoY to INR8.2b (v/s estimate of INR 8.5b, in line). EBITDA
margin beat of 75bps (23.5% vs 22.8% est.) was mainly driven by savings in other
expenses. Gross margins also improved 415bp YoY to 55.6%, led by better product
mix in 3Q.
Exhibit 2: EBITDA margins at 24% in 3Q
EBITDA margin (%)
49
48
48
52
23
58
30
17
15
18
61
32
23
22
19
21
22
23
24
53
56
Gross margin (%)
51
57
55
56
56
Source: Company, MOSL
US (44 of sales):
US business grew 31%YoY to INR16b in 3QFY16, led by 12 product
launches during the quarter. It had received approvals for gAbilify, gNamenda,
gUltram, gRevatio and gActonel in US market. Till date, ARBP has filed 387 ANDAs in
US market and has received approvals for 228 products (includes 30 tentative
ANDAs). At 168, ABRP has one of the largest ANDA pipeline for US market among
Indian companies. Going ahead, ARBP is expected to launch 20-25 products every
year in US market, sustaining the current growth momentum over next two years.
10 February 2016
2

Aurobindo Pharma
Exhibit 3: US sales continue to grow over a high base
US sales
130
90
58
62
72
81
79
6
7
9
11
11
% YoY growth
Exhibit 4: ANDA filed v/s approved (quarterly trend)
ANDAs filed
ANDAs approved
13
61 29
12 12
20
14
28
15
26
16
31
111 7
10 10
4
12 133 14
40
28
3
2
3
8
3 10 21 3
3
13 12
5
5 5
Source: Company, MOSL
Europe & RoW (27% of sales):
In 3Q, Europe and RoW business declined 3%YoY
to INR9.6b, affected by 9% decline in Europe market (currency impact). However,
RoW sales grew 36%YoY to INR1.8b. This is 2
nd
consecutive quarter with positive
EBITDA for Europe business. ARBP has guided for higher single digit margin for
Europe business by FY18. Overall, we believe EU & RoW segment to grow at 4%
CAGR over FY15-18E.
Exhibit 5: EU & RoW sales includes Actavis sales from 1QFY15
EU & RoW sales
% YoY growth
229
249
250
9
2
45
2
53
3
17
3
27
3
21
3
9
9
10
9
201
10
(2)
9
1
9
(3)
Source: Company, MOSL
Exhibit 6: ARV formulations sales trend …
ARV sales
37
4
(16)
2 2
2
(8)
26
7
17
2
2
2
1
3
(40)
3
3
(9)
3
% YoY growth
51
37 32
Exhibit 7: API business trend …
API sales
20
17
10
7
3
7
7
6
7
7
8
7
15
13
13
4
(5)
7
% YoY growth
8
1
(9) (10)
7
7
7
7
3
2
7
Source: Company, MOSL
10 February 2016
3

Aurobindo Pharma
Operating metrics
Exhibit 8: Key operating metrics
4QFY13 1QFY14
Revenue Mix (%)
2QFY14 3QFY14
63.1
12.0
37.5
13.6
36.9
12.5
10.6
13.8
27.6
36.1
(7.6)
72.0
17.1
15.4
31.6
(8.3)
26.6
65.9
10.1
42.7
13.0
34.1
11.8
10.0
12.3
38.7
57.5
25.9
81.4
27.4
12.8
21.3
(11.3)
33.0
4QFY14 1QFY15
68.1
8.2
47.1
12.8
31.9
10.7
9.9
11.2
49.4
75.8
6.6
129.6
21.4
13.2
35.0
(3.5)
13.1
77.2
7.6
37.9
31.7
22.8
8.1
7.2
7.5
68.6
106.7
16.9
78.6
229.4
3.6
7.3
(2.0)
5.5
2QFY15
76.6
4.8
40.2
31.6
23.4
7.4
8.0
8.0
50.1
82.1
(40.4)
60.7
249.2
(4.6)
(11.4)
13.6
(12.4)
3QFY15 4QFY15
79.0
10.4
37.5
31.0
21.0
6.4
7.7
6.9
46.9
76.2
51.5
29.0
249.6
(9.4)
(20.4)
13.7
(17.5)
78.8
8.4
42.0
28.5
21.2
6.4
7.4
7.4
34.9
56.0
37.0
20.1
200.7
(10.4)
(19.5)
0.4
(11.2)
1QFY16 2QFY16
78.5
8.8
42.5
27.2
21.5
6.4
7.8
7.3
14.1
15.9
31.7
28.1
(2.4)
7.9
(9.2)
23.3
11.5
79.5
8.0
43.8
27.7
20.5
5.9
6.8
7.8
15.4
19.9
95.0
25.8
1.0
0.9
(7.9)
(2.3)
12.2
3QFY16
Formulations
ARV form.
US generic form.
EU form.
APIs
SSPs
Cephs
ARV and others
Revenue Gr. (%)
57.9
11.5
30.7
15.7
42.1
11.9
15.4
14.8
30.0
41.5
3.9
61.5
45.1
16.9
14.4
26.0
10.7
63.0
11.0
35.8
16.2
37.0
12.7
12.4
11.9
40.7
68.1
36.8
90.3
52.6
10.2
24.1
(3.0)
12.6
80.3
8.6
44.5
27.2
19.7
5.7
7.1
7.0
10.2
12.1
6.8
30.8
(3.4)
3.1
-
1.0
10.9
44.4
11.5
20.5
25.8
55.6
23.5
15.0
Formulations
ARV form.
US generic form.
EU form.
APIs
SSPs
Cephs
ARV and others
As % of sales
Raw material
SG&A
R&D cost
Tax Rate
Margins (%)
Gross Margins
EBITDA Margins
PAT margins
51.9
11.3
22.6
29.3
48.1
15.3
8.6
52.0
11.0
19.1
58.3
48.0
17.9
10.1
48.2
10.3
18.9
14.6
51.8
22.9
6.8
42.0
10.0
18.0
24.3
58.0
30.1
5.1
38.6
10.1
19.6
24.8
61.4
31.9
15.2
47.5
10.6
19.4
26.1
52.5
22.6
19.3
43.9
11.7
22.3
27.4
56.1
22.1
20.4
48.6
11.6
20.4
29.0
51.4
19.3
14.2
43.4
11.8
24.0
27.6
56.6
20.7
13.9
45.4
11.0
21.8
30.2
54.6
21.8
12.5
44.1
11.3
21.4
26.5
55.9
23.3
14.8
Source: Company; MOSL
10 February 2016
4

Aurobindo Pharma
Valuation and view
ARBP has outperformed most Pharma peers over the last 12 months. This has been
driven by significant improvement in operating performance post clearance of
USFDA import alert and ramp-up in US launches, including high margin gCymbalta.
With recent acquisition in EU (Actavis assets) and US (Natrol), the share of high
margin formulations in total revenues has increased to ~80% (vs 54% in FY10),
positioning it among large cap formulation players. Our target price of INR 1100
discounts ARBP’s FY18E EPS at 20x PE multiple which is:
At a premium to its 3 yr average P/E multiple which is justified given stronger
business profile and earnings outlook
At 10% discount to sector average target P/E multiple, factoring higher leverage
and potential execution related risks.
Implies a PEG of 0.66x (FY15-18E EPS CAGR of 26%)
We believe that the re-rating of the stock from single digit P/E multiple to current
levels partly factors transition to formulations player, improved execution in US and
moderation in leverage (from 1.2x D/E in FY10 to 0.7x in FY15E). However, current
valuations at 15.9x FY17E and 12.6x FY18E are still at ~30-35% discount to the sector
average, which is unjustified in our view. We argue for P/E re-rating for ARBP due to:
Strong EPS outlook of 26% CAGR backed by 17% revenue growth
Strong free cash flow generation of INR28b over FY15-18E.
Deleveraging of balance sheet, as we expect D/E to improve to 0.2x by FY18E (vs
0.7x now).
Key catalysts to drive stock’s performance over the medium term are:
Improvement in EU profitability (30% of business) led by deeper penetration in
existing markets and site transfer to India.
Launch of high margin products in US including injectables (25+ launches over
next 18 months), controlled substance, etc.
Focus on high margin triple combination ARV products in Africa (from FY16E)
Delay in ANDA approvals
Worsening of pricing environment in EU.
Currency fluctuations both in USD and EUR terms.
Exhibit 10: PE relative to Sensex
Risks to our investment assumptions:
Exhibit 9: PE Band (x)
40
30
20
10
0
1.5
12.0
PE (x)
Peak(x)
Avg(x)
Min(x)
100
50
18.3
0
-50
-100
Aurobindo Pharma PE Relative to Sensex PE (%)
15.5
-29.3
29.4
Source: Company, MOSL
10 February 2016
5

Aurobindo Pharma
Story in charts
Exhibit 11: Formulation led sales growth (INR b)
Formulations (INR b)
API (INR b)
34
32
27
18
24
FY11
21
26
FY12
25
34
FY13
29
54
FY14
96
114
138
166
7
FY10
8
FY11
29
29
18
-8
8
FY12
18
FY13
34
FY14
47
57
76
97
Exhibit 12: US Sales to grow at 30% CAGR over FY15-18E
US generic formulations (INR b)
133
94
37
21
35
27
YoY growth (%)
16
19
FY10
FY15 FY16E FY17E FY18E
Source: Company, MOSL
FY15 FY16E FY17E FY18E
Source: Company, MOSL
Exhibit 13: EBITDA growth to improve in FY16-18E
EBITDA (INR m)
165
EBITDA growth (%)
Exhibit 14: EBITDA margins improving with product mix
Gross Margins (%)
51.9
50.0
48.9
55.5
EBITDA Margins (%)
54.6
55.5
56.0
56.5
45.5
59
17
8
FY10
10
FY11
-36
6
FY12
41
12
9
FY13
23
FY14
26
26
32
25
40
23
50
23.0
21.9
13.2
28.2
14.7
21.2
22.9
24.0
25.0
FY15 FY16E FY17E FY18E
Source: Company, MOSL
FY10
FY11
FY12
FY13
FY14
FY15 FY16E FY17E FY18E
Source: Company, MOSL
Exhibit 15: EPS growth to sustain at 26%
EPS (INR)
Exhibit 16: Rich ANDA pipeline
ANDA filed
ANDAs pending
336
209
75
239
269
145
59
92
88
161
387
172
8.6
FY10
9.2
FY11
3.3
FY12
6.9
FY13
25.4
FY14
27.7
35.1
45.4
57.5
FY10
FY11
FY12
FY13
FY14
YTD
FY15 FY16E FY17E FY18E
Source: Company, MOSL
10 February 2016
6

Aurobindo Pharma
Story in charts
Exhibit 17: Improving cash flows to reduce the debt
Total Debt (INR b)
5.0
2.5
2.3
31
3.7
1.5
1.3
1.1
0.7
0.2
25
16
19
18
8
8
22
FY10
24
FY11
31
FY12
34
FY13
36
FY14
39
36
32
28
FY15 FY16E FY17E FY18E
Source: Company, MOSL
11
30
28
29
Net Debt/EBITDA
Exhibit 18: Return ratios (%)
ROE (%)
47
ROCE (%)
36
33
31
31
29
32
Exhibit 19: R&D expense to increase going ahead
R&D expense (INR b)
4.9
4.1
3.4
3.5
3.1
% of sales
4.9
5.4
5.9
Exhibit 20: Asset turnover improving …
Gross Block (INR b)
2.2
Asset turnover (x)
2.1
2.2
2.3
2.6
1.4
1.7
1.5
1.6
2.0
2
FY10
2
FY11
2
FY12
2
FY13
3
FY14
3
7
9
12
24
FY10
24
FY11
31
FY12
37
FY13
42
FY14
56
67
78
86
FY15 FY16E FY17E FY18E
Source: Company, MOSL
FY15 FY16E FY17E FY18E
Source: Company, MOSL
Exhibit 21: EU business to grow at ~1%
Actavis assets (INR b)
YoY growth (%)
378
24
19
36
44
25
-1
7
FY15E
8
FY16E
2
8
FY17E
24
25
7
9
FY18E
Base EU business (INR b)
Exhibit 22: Formulation share getting bigger
Formulations (INR b)
18
21
25
29
27
API (INR b)
28
31
33
16
19
24
26
34
54
96
111
134
161
3
FY12
5
FY13
7
FY14
FY10
FY11
FY12
FY13
FY14
FY15 FY16E FY17E FY18E
Source: Company, MOSL
10 February 2016
7

Aurobindo Pharma
Financials and Valuations
Income Statement
Y/E Mar
Net Sales
Change (%)
EBITDA
EBITDA Margin (%)
Depreciation
EBIT
Interest
Other Income
Extraordinary items
PBT
Tax
Tax Rate (%)
Min. Int. & Assoc. Share
Reported PAT
Adjusted PAT
Change (%)
2011
43,816
22.5
9,598
21.9
1,715
7,883
625
252
372
7,881
2,251
28.6
-4
5,634
5,369
11.5
2011
582
23,866
24,448
24,143
1,191
49,873
24,380
6,994
17,386
6,574
385
34,334
14,553
12,310
1,867
5,604
8,807
8,193
614
25,527
49,872
2012
46,274
5.6
6,101
13.2
2,005
4,096
1,028
247
-5,445
-2,129
-888
41.7
-6
-1,235
1,939
-63.9
2012
582
22,814
23,397
30,959
-16
54,442
30,863
8,916
21,947
6,454
385
33,536
15,456
12,400
709
4,972
7,880
7,174
706
25,656
54,442
2013
58,553
26.5
8,610
14.7
2,487
6,122
1,313
285
-1,353
3,741
827
22.1
-25
2,939
3,993
105.9
2013
582
25,475
26,058
34,355
680
61,202
37,080
11,246
25,834
2,185
223
43,982
19,236
15,970
2,085
6,692
11,576
10,685
891
32,406
61,202
2014
80,998
38.3
22,828
28.2
3,125
19,703
1,079
232
-2,031
16,825
3,635
21.6
-38
13,228
14,820
271.2
2014
583
36,919
37,502
36,339
2,054
76,151
41,817
14,371
27,445
2,105
198
64,386
23,675
26,366
1,786
12,559
18,747
17,389
1,358
45,640
76,151
2015
121,205
49.6
25,636
21.2
3,326
22,310
843
808
-596
21,679
5,966
27.5
-45
15,758
16,190
9.2
2015
584
50,975
51,559
38,636
2,058
92,511
55,810
17,697
38,112
2,500
198
87,647
36,113
35,392
4,692
11,451
36,587
34,161
2,426
51,061
92,511
2016E
138,228
14.0
31,931
23.1
3,862
28,068
966
600
-835
26,868
7,389
27.5
-48
19,527
20,132
24.4
2016E
584
69,334
69,918
36,023
2,099
108,303
66,810
21,560
45,250
2,500
200
89,633
37,075
39,764
-106
12,900
29,920
28,995
925
59,714
108,303
2017E
163,139
18.0
39,153
24.0
4,483
34,670
720
800
0
34,750
9,382
27.0
-50
25,417
25,417
26.3
2017E
584
93,291
93,875
31,771
2,141
128,056
77,810
26,043
51,766
2,500
200
106,981
43,265
46,931
2,885
13,900
34,031
33,106
925
72,950
128,056
(INR Million)
2018E
192,362
17.9
48,668
25.3
5,072
43,595
635
1,000
0
43,960
11,869
27.0
-55
32,146
32,146
26.5
Balance Sheet
Y/E Mar
Share Capital
Reserves
Net Worth
Debt
Deferred Tax
Total Capital Employed
Gross Fixed Assets
Less: Acc Depreciation
Net Fixed Assets
Capital WIP
Investments
Current Assets
Inventory
Debtors
Cash & Bank
Loans & Adv, Others
Curr Liabs & Provns
Curr. Liabilities
Provisions
Net Current Assets
Total Assets
(INR Million)
2018E
584
123,977
124,561
28,345
2,184
155,364
85,810
31,115
54,694
2,500
200
135,968
50,436
55,337
16,296
13,900
38,639
37,714
925
97,329
155,364
10 February 2016
8

Aurobindo Pharma
Financials and Valuations
Ratios
Y/E Mar
Basic (INR)
EPS
Cash EPS
Book Value
DPS
Payout (incl. Div. Tax.)
Valuation(x)
P/E
Cash P/E
Price / Book Value
EV/Sales
EV/EBITDA
Dividend Yield (%)
Profitability Ratios (%)
RoE
RoCE
Turnover Ratios (%)
Asset Turnover (x)
Debtors (No. of Days)
Inventory (No. of Days)
Creditors (No. of Days)
Leverage Ratios (%)
Net Debt/Equity (x)
2011
9.2
12.2
42.0
1.2
12.1
0.0
0.0
0.0
0.0
0.0
0.2
25.1
18.4
0.9
100
121
129
0.9
2011
9,598
252
-6,409
-2,251
372
1,562
-2,866
-1,304
383
0
-2,483
1,207
2,645
-625
-1,167
2,060
1,139
728
1,867
2012
3.3
6.8
40.2
0.5
-23.6
0.0
0.0
0.0
0.0
0.0
0.1
8.1
8.4
0.8
96
122
96
1.3
2012
6,101
247
-1,288
-327
-5,445
-712
-6,446
-7,157
0
0
-6,446
474
6,828
-1,028
-276
5,998
-1,159
1,867
708
2013
6.9
11.1
44.7
0.8
14.9
0.0
0.0
0.0
0.0
0.0
0.1
16.1
11.2
1.0
97
120
118
1.2
2013
8,610
285
-5,374
-132
-1,353
2,036
-2,106
-70
-163
0
-2,269
159
3,403
-1,313
-641
1,608
1,376
709
2,084
2014
25.4
30.8
64.3
1.5
6.6
27.2
22.5
10.8
5.4
19.2
0.2
46.6
29.7
1.1
116
107
137
0.9
2014
22,828
232
-13,533
-3,635
-2,031
3,863
-4,656
-794
-25
0
-4,681
-910
2,131
-1,079
379
520
-298
2,085
1,786
2015
27.7
33.4
88.3
2.3
8.3
25.0
20.7
7.8
3.6
17.1
0.3
36.4
28.2
1.3
105
109
136
0.7
2015
25,636
808
-2,515
-5,966
-596
17,367
-14,388
2,979
0
0
-14,388
-386
2,298
-843
-1,142
-73
2,906
1,786
4,691
2016E
34.5
41.1
119.7
2.0
6.0
20.1
16.8
5.8
3.2
13.8
0.3
33.1
29.2
1.3
103
98
151
0.5
2016E
31,931
600
-13,451
-7,389
-835
10,856
-11,000
-144
2
0
-10,998
0
-2,607
-966
-1,083
-4,656
-4,798
4,692
-106
2017E
43.5
51.2
160.7
2.5
5.7
15.9
13.5
4.3
2.7
11.1
0.4
31.0
30.6
1.3
103
97
151
0.3
2017E
39,153
800
-10,244
-9,382
0
20,327
-11,000
9,327
0
0
-11,000
0
-4,247
-720
-1,368
-6,335
2,992
-106
2,885
2018E
55.0
63.7
213.3
2.5
4.5
12.6
10.9
3.2
2.2
8.6
0.4
29.4
32.0
1.2
103
96
149
0.1
Cash Flow Statement
Y/E Mar
Adjusted EBITDA
Non cash opr. exp (inc)
(Inc)/Dec in Wkg. Cap.
Tax Paid
Other operating activities
CF from Op. Activity
(Inc)/Dec in FA & CWIP
Free cash flows
(Pur)/Sale of Invt
Others
CF from Inv. Activity
Inc/(Dec) in Net Worth
Inc / (Dec) in Debt
Interest Paid
Divd Paid (incl Tax) & Others
CF from Fin. Activity
Inc/(Dec) in Cash
Add: Opening Balance
Closing Balance
(INR Million)
2018E
48,668
1,000
-10,969
-11,869
0
26,829
-8,000
18,829
0
0
-8,000
0
-3,421
-635
-1,362
-5,419
13,411
2,885
16,296
10 February 2016
9

Aurobindo Pharma
Corporate profile
Company description
Exhibit 1: Sensex rebased
A well integrated pharma company, Aurobindo
Pharma (ARBP) features among the top 10
companies in India in terms of consolidated
revenues. ARBP exports to over 125 countries across
the globe with more than 70% of its revenues
derived out of international operations. With
multiple facilities approved by leading regulatory
agencies such as USFDA, EU GMP, UK MHRA, South
Africa-MCC, Health Canada and Brazil ANVISA, ARBP
makes use of in-house R&D for rapid filing of
patents, Drug Master Files (DMFs), Abbreviated New
Drug Applications (ANDAs) and formulation dossiers
across the world. ARBP is among the largest filers of
DMFs and ANDAs from India.
Exhibit 2: Shareholding pattern (%)
Promoter
DII
FII
Others
Sep-15
53.9
6.1
28.9
11.1
Jun-15
53.9
6.3
29.5
10.3
Sep-14
54.1
8.0
27.7
10.2
Source: MOSL/Bloomberg
Exhibit 3: Top holders
Holder Name
Stichting Depositary APG Emerging Markets
Equity P
HDFC Trustee Company Ltd HDFC Equity
Fund
Jhunjhunwala Rakesh Radheshyam
NA
NA
% Holding
1.6
1.5
1.3
0.0
0.0
Source: Capitaline
Note: FII Includes depository receipts
Source: Capitaline
Exhibit 4: Top management
Name
K Ragunathan
K Nithyananda Reddy
N Govindarajan
A Mohan Rami Reddy
Designation
Chairman
Vice Chairman & Whole Time
Dir
Managing Director
Company Secretary
Exhibit 5: Directors
Name
D Rajagopala Reddy
P Sarath Chandra Reddy
M Madan Mohan Reddy
Avnit Bimal Singh
Name
M Sitarama Murthy
P V Ramprasad Reddy
M Sivakumaran
Source: Capitaline
Exhibit 6: Auditors
Name
KPMG
S Chidambaram
S R Batliboi & Associates LLP
Sagar & Associates
Type
Internal
Secretarial Audit
Statutory
Cost Auditor
Source: Capitaline
Exhibit 7: MOSL forecast v/s consensus
EPS
(INR)
FY16
FY17
FY18
MOSL
forecast
34.5
43.5
55.0
Consensus
forecast
35.2
43.7
52.2
Variation (%)
-1.9
-0.4
5.3
Source: Bloomberg
10 February 2016
10

Aurobindo Pharma
NOTES
10 February 2016
11

Disclosures
This document has been prepared by Motilal Oswal Securities Limited (hereinafter referred to as Most) to provide information about the company(ies) and/sector(s), if any, covered in the report and may be distributed by it and/or its
Aurobindo
offer, invitation
affiliated company(ies). This report is for personal information of the selected recipient/s and does not construe to be any investment, legal or taxation advice to you. This research report does not constitute an
Pharma
or
inducement to invest in securities or other investments and Motilal Oswal Securities Limited (hereinafter referred as MOSt) is not soliciting any action based upon it. This report is not for public distribution and has been furnished to
you solely for your general information and should not be reproduced or redistributed to any other person in any form. This report does not constitute a personal recommendation or take into account the particular investment
objectives, financial situations, or needs of individual clients. Before acting on any advice or recommendation in this material, investors should consider whether it is suitable for their particular circumstances and, if necessary, seek
professional advice. The price and value of the investments referred to in this material and the income from them may go down as well as up, and investors may realize losses on any investments. Past performance is not a guide for
future performance, future returns are not guaranteed and a loss of original capital may occur.
MOSt and its affiliates are a full-service, integrated investment banking, investment management, brokerage and financing group. We and our affiliates have investment banking and other business relationships with a some
companies covered by our Research Department. Our research professionals may provide input into our investment banking and other business selection processes. Investors should assume that MOSt and/or its affiliates are
seeking or will seek investment banking or other business from the company or companies that are the subject of this material and that the research professionals who were involved in preparing this material may educate investors
on investments in such business . The research professionals responsible for the preparation of this document may interact with trading desk personnel, sales personnel and other parties for the purpose of gathering, applying and
interpreting information. Our research professionals are paid on twin parameters of performance & profitability of MOSt.
MOSt generally prohibits its analysts, persons reporting to analysts, and members of their households from maintaining a financial interest in the securities or derivatives of any companies that the analysts cover. Additionally, MOSt
generally prohibits its analysts and persons reporting to analysts from serving as an officer, director, or advisory board member of any companies that the analysts cover. Our salespeople, traders, and other professionals or affiliates
may provide oral or written market commentary or trading strategies to our clients that reflect opinions that are contrary to the opinions expressed herein, and our proprietary trading and investing businesses may make investment
decisions that are inconsistent with the recommendations expressed herein. In reviewing these materials, you should be aware that any or all of the foregoing among other things, may give rise to real or potential conflicts of interest.
MOSt and its affiliated company(ies), their directors and employees and their relatives may; (a) from time to time, have a long or short position in, act as principal in, and buy or sell the securities or derivatives thereof of companies
mentioned herein. (b) be engaged in any other transaction involving such securities and earn brokerage or other compensation or act as a market maker in the financial instruments of the company(ies) discussed herein or act as an
advisor or lender/borrower to such company(ies) or may have any other potential conflict of interests with respect to any recommendation and other related information and opinions.; however the same shall have no bearing
whatsoever on the specific recommendations made by the analyst(s), as the recommendations made by the analyst(s) are completely independent of the views of the affiliates of MOSt even though there might exist an inherent
conflict of interest in some of the stocks mentioned in the research report .Reports based on technical and derivative analysis center on studying charts company's price movement, outstanding positions and trading volume, as
opposed to focusing on a company's fundamentals and, as such, may not match with a report on a company's fundamental analysis. In addition MOST has different business segments / Divisions with independent research
separated by Chinese walls catering to different set of customers having various objectives, risk profiles, investment horizon, etc, and therefore may at times have different contrary views on stocks sectors and markets.
Unauthorized disclosure, use, dissemination or copying (either whole or partial) of this information, is prohibited. The person accessing this information specifically agrees to exempt MOSt or any of its affiliates or employees from,
any and all responsibility/liability arising from such misuse and agrees not to hold MOSt or any of its affiliates or employees responsible for any such misuse and further agrees to hold MOSt or any of its affiliates or employees free
and harmless from all losses, costs, damages, expenses that may be suffered by the person accessing this information due to any errors and delays. The information contained herein is based on publicly available data or other
sources believed to be reliable. Any statements contained in this report attributed to a third party represent MOSt’s interpretation of the data, information and/or opinions provided by that third party either publicly or through a
subscription service, and such use and interpretation have not been reviewed by the third party. This Report is not intended to be a complete statement or summary of the securities, markets or developments referred to in the
document. While we would endeavor to update the information herein on reasonable basis, MOSt and/or its affiliates are under no obligation to update the information. Also there may be regulatory, compliance, or other reasons that
may prevent MOSt and/or its affiliates from doing so. MOSt or any of its affiliates or employees shall not be in any way responsible and liable for any loss or damage that may arise to any person from any inadvertent error in the
information contained in this report. MOSt or any of its affiliates or employees do not provide, at any time, any express or implied warranty of any kind, regarding any matter pertaining to this report, including without limitation the
implied warranties of merchantability, fitness for a particular purpose, and non-infringement. The recipients of this report should rely on their own investigations.
This report is intended for distribution to institutional investors. Recipients who are not institutional investors should seek advice of their independent financial advisor prior to taking any investment decision based on this report or for
any necessary explanation of its contents.
Most and it’s associates may have managed or co-managed public offering of securities, may have received compensation for investment banking or merchant banking or brokerage services, may have received any compensation
for products or services other than investment banking or merchant banking or brokerage services from the subject company in the past 12 months.
Most and it’s associates have not received any compensation or other benefits from the subject company or third party in connection with the research report.
Subject Company may have been a client of Most or its associates during twelve months preceding the date of distribution of the research report
MOSt and/or its affiliates and/or employees may have interests/positions, financial or otherwise of over 1 % at the end of the month immediately preceding the date of publication of the research in the securities mentioned in this
report. To enhance transparency, MOSt has incorporated a Disclosure of Interest Statement in this document. This should, however, not be treated as endorsement of the views expressed in the report.
Motilal Oswal Securities Limited is registered as a Research Analyst under SEBI (Research Analyst) Regulations, 2014. SEBI Reg. No. INH000000412
There are no material disciplinary action that been taken by any regulatory authority impacting equity research analysis activities
Analyst Certification
The views expressed in this research report accurately reflect the personal views of the analyst(s) about the subject securities or issues, and no part of the compensation of the research analyst(s) was, is, or will be directly or
indirectly related to the specific recommendations and views expressed by research analyst(s) in this report. The research analysts, strategists, or research associates principally responsible for preparation of MOSt research receive
compensation based upon various factors, including quality of research, investor client feedback, stock picking, competitive factors and firm revenues
Disclosure of Interest Statement
Analyst ownership of the stock
Served as an officer, director or employee
AUROBINDO PHARMA LTD
No
No
A graph of daily closing prices of securities is available at www.nseindia.com and http://economictimes.indiatimes.com/markets/stocks/stock-quotes
Regional Disclosures (outside India)
For U.S.
This report is not directed or intended for distribution to or use by any person or entity resident in a state, country or any jurisdiction, where such distribution, publication, availability or use would be contrary to law, regulation or which
would subject MOSt & its group companies to registration or licensing requirements within such jurisdictions.
Motilal Oswal Securities Limited (MOSL) is not a registered broker - dealer under the U.S. Securities Exchange Act of 1934, as amended (the"1934 act") and under applicable state laws in the United States. In addition MOSL is not a
registered investment adviser under the U.S. Investment Advisers Act of 1940, as amended (the "Advisers Act" and together with the 1934 Act, the "Acts), and under applicable state laws in the United States. Accordingly, in the
absence of specific exemption under the Acts, any brokerage and investment services provided by MOSL, including the products and services described herein are not available to or intended for U.S. persons.
This report is intended for distribution only to "Major Institutional Investors" as defined by Rule 15a-6(b)(4) of the Exchange Act and interpretations thereof by SEC (henceforth referred to as "major institutional investors"). This
document must not be acted on or relied on by persons who are not major institutional investors. Any investment or investment activity to which this document relates is only available to major institutional investors and will be
engaged in only with major institutional investors. In reliance on the exemption from registration provided by Rule 15a-6 of the U.S. Securities Exchange Act of 1934, as amended (the "Exchange Act") and interpretations thereof by
the U.S. Securities and Exchange Commission ("SEC") in order to conduct business with Institutional Investors based in the U.S., MOSL has entered into a chaperoning agreement with a U.S. registered broker-dealer, Motilal Oswal
Securities International Private Limited. ("MOSIPL"). Any business interaction pursuant to this report will have to be executed within the provisions of this chaperoning agreement.
The Research Analysts contributing to the report may not be registered /qualified as research analyst with FINRA. Such research analyst may not be associated persons of the U.S. registered broker-dealer, MOSIPL, and therefore,
may not be subject to NASD rule 2711 and NYSE Rule 472 restrictions on communication with a subject company, public appearances and trading securities held by a research analyst account.
Motilal Oswal Capital Markets Singapore Pte Limited is acting as an exempt financial advisor under section 23(1)(f) of the Financial Advisers Act(FAA) read with regulation 17(1)(d) of the Financial Advisors Regulations and is a
subsidiary of Motilal Oswal Securities Limited in India. This research is distributed in Singapore by Motilal Oswal Capital Markets Singapore Pte Limited and it is only directed in Singapore to accredited investors, as defined in the
Financial Advisers Regulations and the Securities and Futures Act (Chapter 289), as amended from time to time.
In respect of any matter arising from or in connection with the research you could contact the following representatives of Motilal Oswal Capital Markets Singapore Pte Limited:
Kadambari Balachandran
Email : kadambari.balachandran@motilaloswal.com
Contact : (+65) 68189233 / 65249115
Office Address : 21 (Suite 31),16 Collyer Quay,Singapore 04931
For Singapore
Motilal Oswal Tower, Level 9, Sayani Road, Prabhadevi, Mumbai 400 025
Phone: +91 22 3982 5500 E-mail: reports@motilaloswal.com
Motilal Oswal Securities Ltd
10 February 2016
12