11 February 2016
Q3FY16 Results Update | Sector: Consumer
Page Industries
Buy
BSE SENSEX
22,952
Bloomberg
Equity Shares (m)
M.Cap.(INRb)/(USDb)
52-Week Range (INR)
1, 6, 12 Rel. Per (%)
Avg Val, (INR m)
Free float (%)
S&P CNX
6,976
PAG IN
11.2
121.8 / 1.8
16,995/9,871
-11/-7/13
181
49
CMP: INR10,878
TP: INR14,000(+29%)
In-line performance; 10% volume growth in a soft market environment
Financials & Valuations (INR b)
Y/E Mar
2016E 2017E 2018E
17.9 22.3 28.0
Net Sales
3.8
4.7
6.1
EBITDA
2.4
3.0
3.9
PAT
212.6 265.8 349.1
EPS (INR)
21.0 25.0 31.3
Gr. (%)
453.1 586.0 760.5
BV/Sh (INR)
46.9 45.4 45.9
RoE (%)
41.5 42.5 45.1
RoCE (%)
51.2 40.9 31.2
P/E (x)
32.0 26.0 20.1
EV/EBITDA (x)
Estimate change
TP change
Rating change
3%
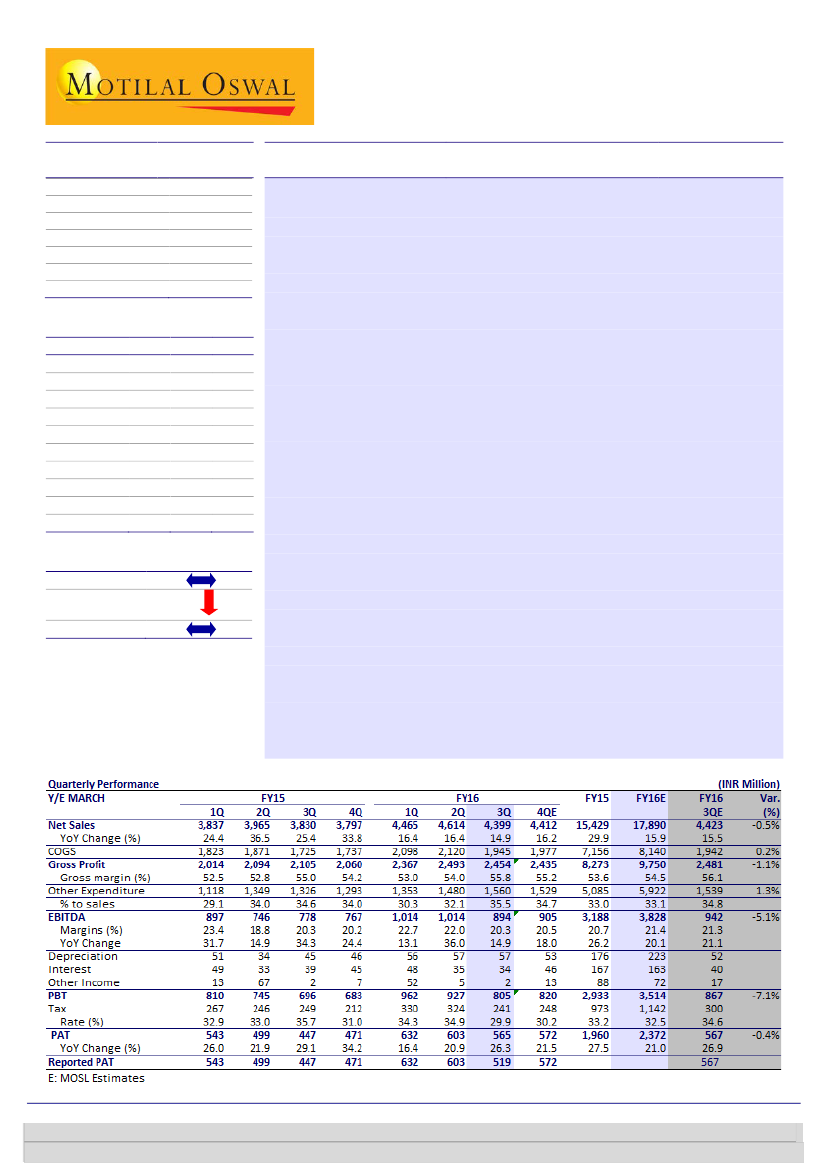
Page Industries 3QFY16
net sales grew 14.9% YoY to INR4.4b (est. INR4.4b)
with 10.6% volume growth. EBITDA grew 14.9% YoY to INR894m and Adj. PAT
grew 26.3% YoY to INR565m (est. INR567m) after adjusting for differential
bonus liability of INR65.1m for 1HFY16. As per management, market
environment continues to be soft with broad based slowdown across regions.
3QFY16 volumes grew 10.6% YoY
(9MFY16 volumes up 10.5%) with pricing
component being 3.9% (4.8% for 9MFY16). Men’s Innerwear, women’s
innerwear and leisure wear segment posted 13.6%, 26.5% and 11.3% growth
respectively with volume growth of 10.1%, 19.9% and 3.9% respectively.
Leisure wear segment volumes were impacted due to withdrawal of
consumer/trade offers.
Gross margin expanded 80bps YoY
to 55.8% (est. 56.1%). However higher
employee costs (up 20% YoY due to differential bonus liability of INR22.3m in
3QFY16) and higher other expenses (up 10bps YoY) resulted in flattish EBITDA
margin YoY to 20.3% (est. 21.3%). Lower tax rate (down 590bps YoY) due to
certain exemptions resulted in Adj. PAT growth of 29.9% YoY to INR565m (est.
INR567m).
Management interaction takeaways:
i) Leisure wear segment volumes have
stabilized and the segment is now posting double digit growth, ii) Generally
PAGE takes price hikes in January, but it is awaiting clarity on GST (it could
initiate ~8% price hike post budget), iii) Tax rate for FY16 should trend at
9MFY16 levels.
Valuation and view:
Page 3QFY16 results were largely in-line with our
estimates; however we have tapered our estimates (2-3%) for FY17E/FY18E to
factor in moderation in sales (demand revival yet to see pick up) and lower tax
rates. We believe, Page offers a compelling, capital-efficient long-term lifestyle
play on the premiumizing innerwear category. A widening product and brand
portfolio, coupled with distribution expansion will aid share expansion and
drive multiple years of growth, in our view. Maintain
Buy
with a revised target
price of INR14,000 (40x FY18E EPS – three year average P/E).
Investors are advised to refer through important disclosures made at the last page of the Research Report.
Motilal Oswal research is available on www.motilaloswal.com/Institutional-Equities, Bloomberg, Thomson Reuters, Factset and S&P Capital.
Gautam Duggad
(Gautam.Duggad@MotilalOswal.com); +91 22 3982 5404
Manish Poddar
(manish.poddar@motilaloswal.com); +91 22 3027 8029/
Vishal Punmiya
(Vishal.Punmiya@MotilalOswal.com)

Page Industries
Operating metrics
Exhibit 1: Quarterly operational data
Volume ('000)
Men innerwear
Women innerwear
Leisure wear
Speedo
Total
% YoY
Men innerwear
Women innerwear
Leisure wear
Speedo
Total
Sales value (INR m)
Men innerwear
Women innerwear
Leisure wear
Speedo
Total
% YoY
Men innerwear
Women innerwear
Leisure wear
Speedo
Total
Avg realization
(INR/unit)
Men innerwear
Women innerwear
Leisure wear
Speedo
Total
% YoY
Men innerwear
Women innerwear
Leisure wear
Total
3QFY14
15,352
5,048
5,266
51
25,717
3QFY14
10.4
21.9
45.5
70.3
18.6
3QFY14
1,462
532
1,005
27
3,026
3QFY14
25.2
31.0
75.2
90.3
40.0
3QFY14
95
105
191
525
118
3QFY14
13.3
7.4
20.4
18.0
4QFY14
12,603
4,601
4,972
176
22,353
4QFY14
9.4
19.4
36.6
(9.7)
16.4
4QFY14
1,263
525
907
91
2,786
4QFY14
24.6
27.6
61.5
(0.5)
34.1
4QFY14
100
114
182
517
125
4QFY14
13.9
6.9
18.2
15.2
1QFY15
18,268
6,407
5,641
163
30,478
1QFY15
4.0
15.7
18.8
41.0
9.0
1QFY15
1,914
687
1,088
90
3,779
1QFY15
18.1
27.1
32.4
66.7
24.4
1QFY15
105
107
193
554
124
1QFY15
13.6
9.9
11.4
14.2
2QFY15
19,621
5,866
5,769
54
31,310
2QFY15
22.4
16.2
22.1
8.6
21.1
2QFY15
2,048
683
1,114
31
3,875
2QFY15
37.9
33.8
30.5
24.4
34.9
2QFY15
104
116
193
564
124
2QFY15
12.7
15.1
6.9
11.4
3QFY15
17,745
5,547
6,304
34
29,630
3QFY15
15.6
9.9
19.7
(33.5)
15.2
3QFY15
1,869
663
1,215
19
3,766
3QFY15
27.9
24.6
20.9
(27.7)
24.5
3QFY15
105
119
193
571
127
3QFY15
10.6
13.4
1.0
8.0
4QFY15
17,460
5,670
5,900
16
29,046
4QFY15
38.5
23.2
18.7
(90.9)
29.9
4QFY15
1,854
671
1,099
95
3,720
4QFY15
46.8
27.8
21.3
4.1
33.5
4QFY15
106
118
186
5,920
128
4QFY15
5.9
3.7
2.2
2.7
1QFY16
19,776
7,747
6,023
165
33,712
1QFY16
8.3
20.9
6.8
1.7
10.6
1QFY16
2,167
922
1,202
92
4,383
1QFY16
13.2
34.2
10.5
2.2
16.0
1QFY16
110
119
200
557
130
1QFY16
4.6
11.0
3.4
4.9
2QFY16
20,727
6,681
7,101
65
34,575
2QFY16
5.6
13.9
23.1
19.3
10.4
2QFY16
2,233
865
1,381
37
4,515
2QFY16
9.1
26.7
23.9
20.6
16.5
2QFY16
108
129
194
570
131
2QFY16
3.2
11.2
0.7
5.5
3QFY16
19,540
6,650
6,550
30
32,770
3QFY16
10.1
19.9
3.9
(11.7)
10.6
3QFY16
2,123
838
1,352
15
4,329
3QFY16
13.6
26.5
11.3
(21.9)
14.9
3QFY16
109
126
206
505
132
3QFY16
3.2
5.5
7.1
3.9
11 February 2016
2

Page Industries
Exhibit 2: Sales growth for 3QFY16 stood at 15%
Sales (INR b)
35.5
25.6
39.4
30.7
39.9
33.4
24.3
Sales growth (%)
35.5
24.5
16.0 16.4 15.0
21.6 20.9 30.4 28.8 30.3 27.9 37.8 39.0 37.7 37.2 43.8 45.4 43.3
33.4
Exhibit 3: Gross margin expanded 80bps YoY to 55.8%
Gross margin (%)
Source: Company, MOSL
Exhibit 4: Employee and Other expenses are up 80bps (after
adjusting for 1HFY16 bonus payout) and 10bps respectively
Other expenses (% of sales)
Employee costs (% of sales)
Exhibit 5: ..thus EBITDA margin stood flat
EBITDA margin (%)
Source: Company, MOSL
Valuation and view
Page 3QFY16 results were largely in-line with our estimates; however we have
tapered our estimates (2-3%) for FY17E/FY18E to factor in moderation in sales
(demand revival yet to see pick up) and lower tax rates.
We believe, Page offers a compelling, capital-efficient long-term lifestyle play on
the premiumizing innerwear category. A widening product and brand portfolio,
coupled with distribution expansion will aid share expansion and drive multiple
years of growth, in our view.
Maintain
Buy
with a revised target price of INR14,000 (40x FY18E EPS – three
year average P/E)
Exhibit 6: Revised estimates by 2-3%
Sales
EBITDA
PAT
FY16E
17,890
3,828
2,372
New
FY17E
22,261
4,706
2,965
FY18E
28,010
6,092
3,894
FY16E
18,044
3,927
2,375
Old
FY17E
22,940
4,861
3,037
FY18E
28,955
6,286
3,980
FY16E
-1%
-3%
0%
Change (%)
FY17E
-3%
-3%
-2%
FY18E
-3%
-3%
-2%
Source: Company, MOSL
11 February 2016
3

Page Industries
Exhibit 7: Page Inds P/E (x)
80.0
60.0
40.0
20.0
0.0
27.1
9.2
45.2
PE (x)
Peak(x)
Avg(x)
72.7
Min(x)
300
200
100
0
-100
60.8
189.1
Exhibit 8: Page Inds P/E relative to Sensex
Page Inds PE Relative to Sensex PE (%)
LPA (%)
Source: Company, MOSL
Exhibit 9:
Valuation
Metrics of coverage universe
Company
Consumer
Asian Paints
Britannia
Colgate
Dabur*
Emami*
Godrej Consumer
GSK Consumer
Hind. Unilever
ITC
Jyothy Labs
Marico*
Nestle
Page Industries
Pidilite Inds.
Radico Khaitan
United Spirits
Retail
Jubilant Foodworks
Shopper's Stop
Titan Company
Reco
Neutral
Buy
Neutral
Neutral
Buy
Neutral
Buy
Neutral
Neutral
Buy
Neutral
Neutral
Buy
Buy
Buy
Buy
Buy
Neutral
Neutral
Price
(INR)
855
2,637
828
238
1,010
1,187
5,793
799
299
268
229
5,224
10,878
579
99
2,313
1,063
360
355
Mkt Cap EPS Growth YoY (%)
(USD M) FY16E FY17E FY18E
12,009 27.0
4,630 49.8
3,297
7.1
6,135 15.0
3,357 15.1
5,917 24.5
3,566 20.0
25,298
5.0
35,140
2.7
711 26.4
4,315 25.8
7,373 -21.8
1,776 21.0
4,348 48.5
192 -3.0
4,920
LP
1,020
433
4,619
4.5
32.6
-7.2
15.1
18.9
14.3
16.2
22.6
20.0
15.6
10.9
10.4
-8.7
15.5
25.7
25.0
10.2
31.5
76.9
53.2
35.8
20.9
9.9
14.0
14.1
12.5
16.9
14.4
9.4
14.2
14.3
12.6
12.4
22.3
31.3
15.1
28.9
46.6
42.6
39.7
13.2
P/E (x)
EV/EBITDA (x)
ROE (%) Div. (%)
FY16E
35.2
57.8
72.6
33.0
40.6
23.2
30.5
110.3
30.4
19.6
35.5
34.2
46.9
29.8
9.5
48.1
15.8
6.8
21.2
FY16E
1.2
1.0
1.9
1.0
1.1
0.8
1.2
2.1
2.3
1.5
0.9
1.4
0.8
0.7
1.0
0.0
0.4
0.4
0.7
FY16E FY17E FY18E FY16E FY17E FY18E
45.4
36.8
37.6
34.1
41.0
35.8
34.8
43.5
24.3
30.2
40.9
51.3
51.2
38.9
15.4
80.5
60.0
55.6
41.3
39.5
30.9
32.9
29.4
33.5
29.8
30.1
39.2
22.0
33.1
35.4
40.8
40.9
35.4
11.7
45.5
39.2
40.9
34.2
35.9
27.1
28.8
26.1
28.6
26.1
27.5
34.3
19.2
29.4
31.5
33.4
31.2
30.7
9.1
31.0
27.5
29.3
30.2
31.0
25.5
23.0
27.2
34.0
27.1
24.6
29.9
15.8
25.1
27.4
29.7
32.0
24.4
10.1
37.8
23.9
13.7
31.1
26.5
20.8
20.4
23.2
28.1
23.0
20.9
27.4
14.4
21.1
23.5
24.1
26.0
21.4
8.3
27.3
16.9
11.8
25.5
23.9
17.8
18.3
20.5
24.1
20.7
18.5
24.1
12.7
18.6
20.7
20.1
20.1
18.5
6.9
20.4
12.4
9.7
22.3
Note: For Nestle FY15E means CY14
Source: Company, MOSL
11 February 2016
4

Page Industries
Financials and Valuations
Income Statement
Y/E March
Net Sales
Change (%)
Total Expenditure
EBITDA
Change (%)
Margin (%)
Depreciation
Int. and Fin. Ch.
Other Inc.- Rec.
PBT
Change (%)
Tax
Tax Rate (%)
Adjusted PAT
Change (%)
Reported PAT
2010
3,441
33.2
2,755
686
27.1
19.9
90
27
16
585
25.0
189
32.3
396
25.2
396
2011
4,977
44.6
4,016
960
40.0
19.3
98
48
63
878
50.0
292
33.3
585
47.8
585
2012
6,966
40.0
5,504
1,462
52.2
21.0
106
67
52
1,341
52.8
441
32.9
900
53.7
900
2013
8,758
25.7
6,992
1,766
20.8
20.2
114
80
85
1,657
23.6
531
32.1
1,125
25.1
1,125
2014
11,877
35.6
9,326
2,551
44.5
21.5
139
142
65
2,335
40.9
797
34.1
1,538
36.7
1,538
2015
15,430
29.9
12,240
3,190
25.1
20.7
176
167
86
2,933
25.6
973
33.2
1,960
27.5
1,960
2016E
17,890
15.9
14,062
3,828
20.0
21.4
223
163
72
3,514
19.8
1,142
32.5
2,372
21.0
2,372
(INR Million)
2017E
22,261
24.4
17,555
4,706
22.9
21.1
254
148
89
4,392
25.0
1,428
32.5
2,965
25.0
2,965
2018E
28,010
25.8
21,917
6,092
29.5
21.8
304
132
112
5,768
31.3
1,875
32.5
3,894
31.3
3,894
Balance Sheet
Y/E March
Share Capital
Reserves
Net Worth
Loans
Capital Employed
Gross Block
Less: Accum. Depn.
Net Fixed Assets
Capital WIP
Investments
Curr. Assets, L&A
Inventory
Account Receivables
Cash and Bank Balance
Others
Curr. Liab. and Prov.
Account Payables
Other Liabilities
Provisions
Net Curr. Assets
Def. Tax Liability
Appl. of Funds
E: MOSL Estimates
2010
112
879
990
548
1,538
1,013
237
776
49
30
1,343
946
205
30
163
640
217
18
405
703
20
1,538
2011
112
1,126
1,238
1,150
2,388
1,259
328
931
102
30
2,327
1,647
258
26
395
976
251
78
646
1,351
26
2,388
2012
112
1,546
1,658
759
2,417
1,504
428
1,076
165
18
2,457
1,726
437
31
263
1,263
373
155
734
1,194
36
2,417
2013
112
2,024
2,135
1,007
3,142
1,860
538
1,322
138
10
3,248
2,350
581
46
271
1,518
473
216
830
1,730
57
3,142
2014
112
2,778
2,890
1,632
4,522
2,404
676
1,728
36
0
5,092
3,626
727
35
705
2,239
586
423
1,230
2,853
95
4,522
2015
112
3,756
3,868
1,573
5,440
3,059
886
2,173
1
0
6,061
4,435
884
44
698
2,680
821
504
1,355
3,381
114
5,440
2016E
112
4,942
5,054
1,473
6,526
3,795
1,109
2,687
1
0
6,940
4,803
931
368
838
2,988
833
539
1,615
3,953
114
6,526
(INR Million)
2017E
112
6,424
6,536
1,373
7,909
4,414
1,363
3,050
1
0
8,689
5,977
1,159
525
1,029
3,718
1,037
671
2,010
4,972
114
7,909
2018E
112
8,371
8,483
1,273
9,756
5,718
1,667
4,051
1
0
10,495
7,367
1,458
393
1,278
4,678
1,305
844
2,529
5,817
114
9,756
11 February 2016
5

Page Industries
Financials and Valuations
Ratios
Y/E March
Basic (INR)
EPS
Cash EPS
BV/Share
DPS
Payout (%)
Valuation (x)
P/E
Cash P/E
EV/Sales
EV/EBITDA
P/BV
Dividend Yield (%)
Return Ratios (%)
RoE
RoCE
Working Capital Ratios
Asset Turnover (x)
Debtor Days
Leverage Ratio
Debt/Equity (x)
0.9
0.5
0.5
0.6
0.4
0.3
0.2
0.2
0.1
2.5
20
2.9
17
3.2
18
3.1
21
3.1
20
3.0
19
3.1
19
3.2
17
3.2
17
40.0
29.3
47.3
31.4
54.3
39.3
52.7
42.4
53.2
42.6
50.7
41.6
46.9
41.5
45.4
42.5
45.9
45.1
107.8
97.9
14.0
69.3
56.8
0.5
78.9
72.3
10.4
48.2
42.0
0.6
61.9
56.8
8.0
38.5
31.4
0.7
51.2
46.8
6.8
32.0
24.0
0.8
40.9
37.7
5.5
26.0
18.6
1.0
31.2
28.9
4.4
20.1
14.3
1.4
35.5
43.6
88.8
21.0
69.2
52.5
61.3
111.0
26.0
57.7
80.7
90.2
148.6
37.0
53.3
100.9
111.1
191.4
50.0
57.6
137.9
150.4
259.1
60.0
50.9
175.7
191.6
346.8
72.0
48.9
212.6
232.6
453.1
90.9
50.0
265.8
288.6
586.0
113.6
50.0
349.1
376.3
760.5
149.2
50.0
2010
2011
2012
2013
2014
2015
2016E
2017E
2018E
Cash Flow Statement
Y/E March
Profit before Tax
Depreciation
Other Non-Cash & Non-operating activities
Incr in WC
Direct Taxes Paid
CF from Operations
Incr in FA
Free Cash Flow
Pur of Investments
CF from Invest.
Issue of Shares
Incr in Debt
Dividend Paid
Others
CF from Fin. Activity
Incr/Decr of Cash
Add: Opening Balance
Closing Balance
E: MOSL Estimates
2010
585
90
12
-205
-184
298
-247
51
38
-209
0
178
-313
-27
-162
-73
103
30
2011
878
98
40
-720
-298
-2
-281
-283
9
-273
0
603
-286
-46
271
-4
30
26
2012
1,341
106
59
147
-427
1,226
-271
955
18
-253
0
-503
-402
-63
-968
5
26
31
2013
1,657
114
74
-457
-516
871
-435
436
16
-419
0
238
-596
-80
-438
14
31
46
2014
2,335
139
122
-1,098
-750
747
-511
237
22
-489
0
625
-756
-139
-270
-11
46
34
2015
2,933
176
96
-569
-966
1,670
-534
1,136
2
-531
0
-59
-899
-170
-1,128
10
34
44
2016E
3,514
223
91
-248
-1,142
2,438
-737
1,701
72
-665
0
-100
-1,186
-162
-1,448
324
43
368
(INR Million)
2017E
4,392
254
59
-862
-1,428
2,416
-618
1,798
89
-529
0
-100
-1,482
-147
-1,729
158
367
525
2018E
5,768
304
20
-978
-1,875
3,240
-1,305
1,935
112
-1,193
0
-100
-1,947
-131
-2,178
-131
524
393
11 February 2016
6

Page Industries
Corporate profile
Company description
Exhibit 1: Sensex rebased
Page Industries commenced operations in the year
1994 with the key objective of bringing the
innerwear brand “Jockey” to India. The company has
the exclusive right for manufacturing, distribution
and marketing of Jockey International products in
India, Sri Lanka, Maldives, Bangladesh, Nepal and
UAE as well as “Speedo” brand in India. Page
Industries is promoted by the Genomal family who
have been associated with Jockey International Inc
for more than 50 years.
Source: MOSL/Bloomberg
Exhibit 2: Shareholding pattern (%)
Promoter
DII
FII
Others
Dec-15
51.0
5.4
34.3
9.3
Sep-15
51.0
5.2
33.7
10.1
Dec-14
51.8
6.3
31.9
9.9
Exhibit 3: Top holders
Holder Name
Nalanda India Fund Ltd
Cartica Capital Ltd
Steadview Capital Mauritius Ltd
ABG Capital
IDFC Premier Equity Fund
% Holding
10.0
7.7
2.9
2.3
2.2
Source: Capitaline
Note: FII Includes depository receipts
Source: Capitaline
Exhibit 4: Top management
Name
Sunder Genomal
Nari Genomal
Ramesh Genomal
C Murugesh
Designation
Managing Director
Director
Director
Company Secretary
Exhibit 5: Directors
Name
B C Prabhakar*
G P Albal*
Nari Genomal
P V Menon
Pius Thomas
Pradeep Jaipuria*
Ramesh Genomal
Name
Rukmani Menon*
Sandeep Kumar Maini*
Shamir Genomal
Sunder Genomal
Timothy Ralph Wheeler
V Sivadas
Vikram Gamanlal Shah*
Source: Capitaline
*Independent
Exhibit 6: Auditors
Name
Haribhakti & Co LLP
R Vijayakumar
Type
Statutory
Secretarial Audit
Exhibit 7: MOSL forecast v/s consensus
EPS
(INR)
FY16
FY17
FY18
MOSL
forecast
212.6
265.8
349.1
Consensus
forecast
-
-
-
Variation
(%)
-
-
-
Source: Bloomberg
Source: Capitaline
11 February 2016
7

This document has been prepared by Motilal Oswal Securities Limited (hereinafter referred to as Most) to provide information about the company(ies) and/sector(s), if any, covered in the report and may be distributed by it and/or its
Page
an offer, invitation
affiliated company(ies). This report is for personal information of the selected recipient/s and does not construe to be any investment, legal or taxation advice to you. This research report does not constitute
Industries
or
inducement to invest in securities or other investments and Motilal Oswal Securities Limited (hereinafter referred as MOSt) is not soliciting any action based upon it. This report is not for public distribution and has been furnished to
you solely for your general information and should not be reproduced or redistributed to any other person in any form. This report does not constitute a personal recommendation or take into account the particular investment
objectives, financial situations, or needs of individual clients. Before acting on any advice or recommendation in this material, investors should consider whether it is suitable for their particular circumstances and, if necessary, seek
professional advice. The price and value of the investments referred to in this material and the income from them may go down as well as up, and investors may realize losses on any investments. Past performance is not a guide for
future performance, future returns are not guaranteed and a loss of original capital may occur.
MOSt and its affiliates are a full-service, integrated investment banking, investment management, brokerage and financing group. We and our affiliates have investment banking and other business relationships with a some
companies covered by our Research Department. Our research professionals may provide input into our investment banking and other business selection processes. Investors should assume that MOSt and/or its affiliates are
seeking or will seek investment banking or other business from the company or companies that are the subject of this material and that the research professionals who were involved in preparing this material may educate investors
on investments in such business . The research professionals responsible for the preparation of this document may interact with trading desk personnel, sales personnel and other parties for the purpose of gathering, applying and
interpreting information. Our research professionals are paid on twin parameters of performance & profitability of MOSt.
MOSt generally prohibits its analysts, persons reporting to analysts, and members of their households from maintaining a financial interest in the securities or derivatives of any companies that the analysts cover. Additionally, MOSt
generally prohibits its analysts and persons reporting to analysts from serving as an officer, director, or advisory board member of any companies that the analysts cover. Our salespeople, traders, and other professionals or affiliates
may provide oral or written market commentary or trading strategies to our clients that reflect opinions that are contrary to the opinions expressed herein, and our proprietary trading and investing businesses may make investment
decisions that are inconsistent with the recommendations expressed herein. In reviewing these materials, you should be aware that any or all of the foregoing among other things, may give rise to real or potential conflicts of interest.
MOSt and its affiliated company(ies), their directors and employees and their relatives may; (a) from time to time, have a long or short position in, act as principal in, and buy or sell the securities or derivatives thereof of companies
mentioned herein. (b) be engaged in any other transaction involving such securities and earn brokerage or other compensation or act as a market maker in the financial instruments of the company(ies) discussed herein or act as an
advisor or lender/borrower to such company(ies) or may have any other potential conflict of interests with respect to any recommendation and other related information and opinions.; however the same shall have no bearing
whatsoever on the specific recommendations made by the analyst(s), as the recommendations made by the analyst(s) are completely independent of the views of the affiliates of MOSt even though there might exist an inherent
conflict of interest in some of the stocks mentioned in the research report .Reports based on technical and derivative analysis center on studying charts company's price movement, outstanding positions and trading volume, as
opposed to focusing on a company's fundamentals and, as such, may not match with a report on a company's fundamental analysis. In addition MOST has different business segments / Divisions with independent research
separated by Chinese walls catering to different set of customers having various objectives, risk profiles, investment horizon, etc, and therefore may at times have different contrary views on stocks sectors and markets.
Unauthorized disclosure, use, dissemination or copying (either whole or partial) of this information, is prohibited. The person accessing this information specifically agrees to exempt MOSt or any of its affiliates or employees from,
any and all responsibility/liability arising from such misuse and agrees not to hold MOSt or any of its affiliates or employees responsible for any such misuse and further agrees to hold MOSt or any of its affiliates or employees free
and harmless from all losses, costs, damages, expenses that may be suffered by the person accessing this information due to any errors and delays. The information contained herein is based on publicly available data or other
sources believed to be reliable. Any statements contained in this report attributed to a third party represent MOSt’s interpretation of the data, information and/or opinions provided by that third party either publicly or through a
subscription service, and such use and interpretation have not been reviewed by the third party. This Report is not intended to be a complete statement or summary of the securities, markets or developments referred to in the
document. While we would endeavor to update the information herein on reasonable basis, MOSt and/or its affiliates are under no obligation to update the information. Also there may be regulatory, compliance, or other reasons that
may prevent MOSt and/or its affiliates from doing so. MOSt or any of its affiliates or employees shall not be in any way responsible and liable for any loss or damage that may arise to any person from any inadvertent error in the
information contained in this report. MOSt or any of its affiliates or employees do not provide, at any time, any express or implied warranty of any kind, regarding any matter pertaining to this report, including without limitation the
implied warranties of merchantability, fitness for a particular purpose, and non-infringement. The recipients of this report should rely on their own investigations.
This report is intended for distribution to institutional investors. Recipients who are not institutional investors should seek advice of their independent financial advisor prior to taking any investment decision based on this report or for
any necessary explanation of its contents.
Most and it’s associates may have managed or co-managed public offering of securities, may have received compensation for investment banking or merchant banking or brokerage services, may have received any compensation
for products or services other than investment banking or merchant banking or brokerage services from the subject company in the past 12 months.
Most and it’s associates have not received any compensation or other benefits from the subject company or third party in connection with the research report.
Subject Company may have been a client of Most or its associates during twelve months preceding the date of distribution of the research report
MOSt and/or its affiliates and/or employees may have interests/positions, financial or otherwise of over 1 % at the end of the month immediately preceding the date of publication of the research in the securities mentioned in this
report. To enhance transparency, MOSt has incorporated a Disclosure of Interest Statement in this document. This should, however, not be treated as endorsement of the views expressed in the report.
Motilal Oswal Securities Limited is registered as a Research Analyst under SEBI (Research Analyst) Regulations, 2014. SEBI Reg. No. INH000000412
There are no material disciplinary action that been taken by any regulatory authority impacting equity research analysis activities
Disclosures
Analyst Certification
The views expressed in this research report accurately reflect the personal views of the analyst(s) about the subject securities or issues, and no part of the compensation of the research analyst(s) was, is, or will be directly or
indirectly related to the specific recommendations and views expressed by research analyst(s) in this report. The research analysts, strategists, or research associates principally responsible for preparation of MOSt research receive
compensation based upon various factors, including quality of research, investor client feedback, stock picking, competitive factors and firm revenues
Disclosure of Interest Statement
Analyst ownership of the stock
Served as an officer, director or employee
PAGE INDUSTRIES LTD
No
No
A graph of daily closing prices of securities is available at www.nseindia.com and http://economictimes.indiatimes.com/markets/stocks/stock-quotes
Regional Disclosures (outside India)
For U.S.
This report is not directed or intended for distribution to or use by any person or entity resident in a state, country or any jurisdiction, where such distribution, publication, availability or use would be contrary to law, regulation or which
would subject MOSt & its group companies to registration or licensing requirements within such jurisdictions.
Motilal Oswal Securities Limited (MOSL) is not a registered broker - dealer under the U.S. Securities Exchange Act of 1934, as amended (the"1934 act") and under applicable state laws in the United States. In addition MOSL is not a
registered investment adviser under the U.S. Investment Advisers Act of 1940, as amended (the "Advisers Act" and together with the 1934 Act, the "Acts), and under applicable state laws in the United States. Accordingly, in the
absence of specific exemption under the Acts, any brokerage and investment services provided by MOSL, including the products and services described herein are not available to or intended for U.S. persons.
This report is intended for distribution only to "Major Institutional Investors" as defined by Rule 15a-6(b)(4) of the Exchange Act and interpretations thereof by SEC (henceforth referred to as "major institutional investors"). This
document must not be acted on or relied on by persons who are not major institutional investors. Any investment or investment activity to which this document relates is only available to major institutional investors and will be
engaged in only with major institutional investors. In reliance on the exemption from registration provided by Rule 15a-6 of the U.S. Securities Exchange Act of 1934, as amended (the "Exchange Act") and interpretations thereof by
the U.S. Securities and Exchange Commission ("SEC") in order to conduct business with Institutional Investors based in the U.S., MOSL has entered into a chaperoning agreement with a U.S. registered broker-dealer, Motilal Oswal
Securities International Private Limited. ("MOSIPL"). Any business interaction pursuant to this report will have to be executed within the provisions of this chaperoning agreement.
The Research Analysts contributing to the report may not be registered /qualified as research analyst with FINRA. Such research analyst may not be associated persons of the U.S. registered broker-dealer, MOSIPL, and therefore,
may not be subject to NASD rule 2711 and NYSE Rule 472 restrictions on communication with a subject company, public appearances and trading securities held by a research analyst account.
For Singapore
Motilal Oswal Capital Markets Singapore Pte Limited is acting as an exempt financial advisor under section 23(1)(f) of the Financial Advisers Act(FAA) read with regulation 17(1)(d) of the Financial Advisors Regulations and is a
subsidiary of Motilal Oswal Securities Limited in India. This research is distributed in Singapore by Motilal Oswal Capital Markets Singapore Pte Limited and it is only directed in Singapore to accredited investors, as defined in the
Financial Advisers Regulations and the Securities and Futures Act (Chapter 289), as amended from time to time.
In respect of any matter arising from or in connection with the research you could contact the following representatives of Motilal Oswal Capital Markets Singapore Pte Limited:
Kadambari Balachandran
Email : kadambari.balachandran@motilaloswal.com
Contact : (+65) 68189233 / 65249115
Office Address : 21 (Suite 31),16 Collyer Quay,Singapore 04931
Motilal Oswal Tower, Level 9, Sayani Road, Prabhadevi, Mumbai 400 025
Phone: +91 22 3982 5500 E-mail: reports@motilaloswal.com
Motilal Oswal Securities Ltd
11 February 2016
8