12 February 2016
Q3FY16 Results Update | Sector: Healthcare
Sun Pharma
Buy
BSE SENSEX
22,986
Bloomberg
Equity Shares (m)
M.Cap.(INRb)/(USDb)
52-Week Range (INR)
1, 6, 12 Rel. Per (%)
Avg Val, (INR m)
Free float (%)
S&P CNX
6,981
SUNP IN
2,406.6
2,041.6 / 29.9
1,201/706
14/12/12
4,590
45.3
CMP: INR848
TP: INR975(+15%)
Strong results; multiple triggers to drive growth
Financials & Valuation (INR b)
Y/E Mar
2016E 2017E 2018E
Sales
283.0 336.0 361.6
EBITDA
82.5 111.8 128.9
Adj. PAT
47.8
69.6
93.8
Core EPS (INR)
19.9
28.9
39.0
EPS Gr. (%)
0.9
66.3
18.0
BV/Sh. (INR)
120.3 146.3 178.3
RoE (%)
17.5
21.7
24.0
RoCE (%)
21.8
30.0
30.8
P/E (x)
42.7
29.3
21.7
P/BV (x)
7.1
5.8
4.8
Estimate change
TP change
Rating change
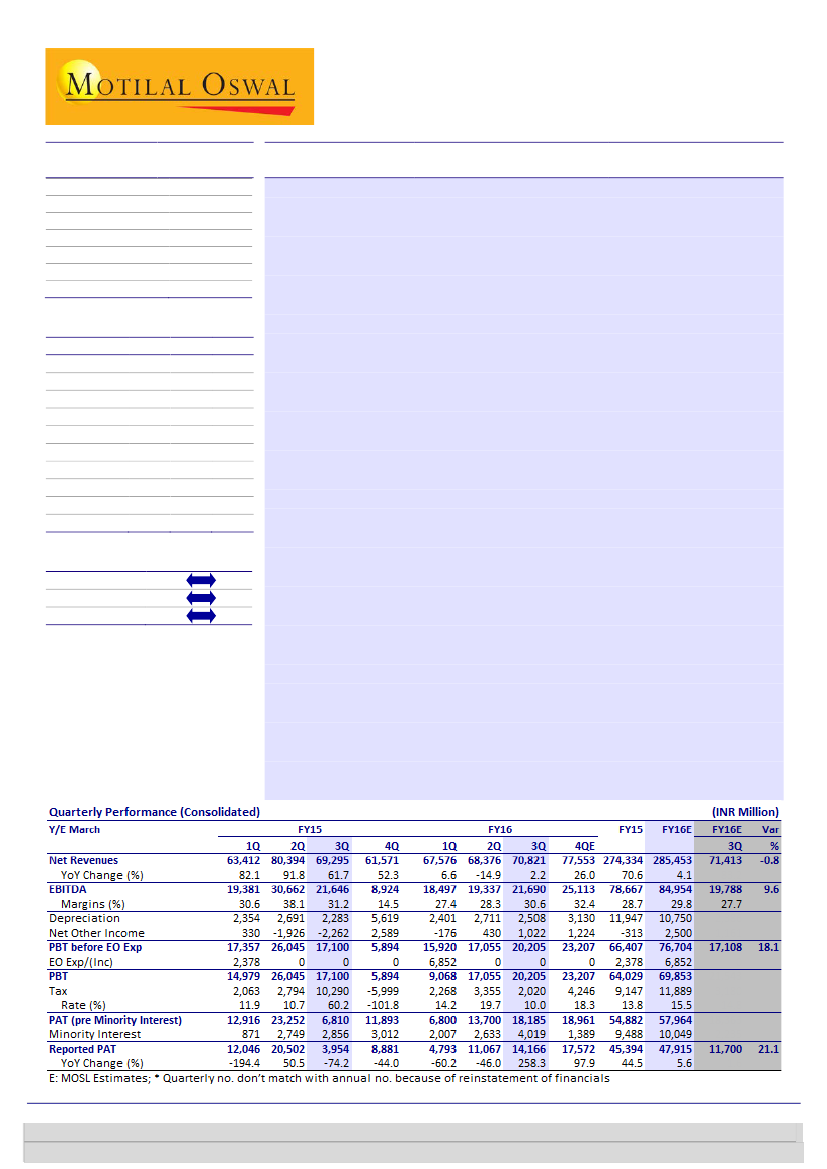
SUNP’s reported sales of INR70.8bn (in-line with est) with better than expected
EBITDA margins of 30.6% (vs est of 28%) and PAT of INR14.2b (vs INR11.1b in 2Q).
Positive surprise on profitability is on the back of better product mix, other
operating income and lower tax. We expect EPS for SUNP to double by FY18 to
INR39 (v/s INR20 in FY15)— primarily on the back of limited competition for
generic Gleevec, RBXY integration benefits, ramp-up of specialty products (Keveyis/
Xenazine/ Xelpros/ Elepsia XR) and mid-teens growth in India branded business.
US business- Gleevec to drive near term growth:
US sales stood at USD486m in 3Q
and were down 5% QoQ primarily due to one-time sales of ~USD40m in 3Q
partially offset by strong Taro performance (up 22% QoQ). Management plans to
complete the remediation measure shortly and will be asking US FDA for re-
inspection in 1Q FY17E. Currently we have built resolution by 2H FY17. We expect
US sales growth in medium term to be driven by Gleevec FTF, ramp-up of speciality
business products (Xenazine, Keveyis, etc).
Domestic business- recovery in growth to continue.
Domestic business revenue
grew at ~8% YoY. Growth was impacted due to withdrawal of bonus offers in the
acute segment. Having said that, revenue growth improved sequentially in 3Q (vs
1% YoY in 2Q) as the impact of promotional cuts moderated. According to AIOCD,
secondary sales growth was at ~10% YoY in 3Q signaling better growth ahead.
Earnings call takeaways:
(a)MK-3222 Phase-3 data to come out by April,(b)
Gleevec market share expected to reach ~30% during FTF, (c) Halol remediation is
on track and expects re-inspection in near term, (d)MK-3222 is likely to be filed in
CY17, (e)SUNP is on track to achieve USD300m Ranbaxy synergy by FY18E.
Multiple triggers, coupled with recent weakness, provide valuation upside:
Sun
Pharma is one of our top picks in Indian pharma with TP of INR975 @ 25x FY18E
P/E (@10% discount to historical average). Our buy rating is based on the back of
multiple triggers (MK-3222 Phase-3 data, Gleevec launch, RBXY integration benefits
and Keveyis ramp-up), superior execution track record, high RoIC (30%) and cash-
rich balance sheet (USD1b net cash). Post strong 4Q numbers, we have increased
our FY16 EPS by 5-6%. We estimate EPS CAGR of 26% over FY15-18 despite hike in
R&D and tax rate (tax rate @ 20% in FY18 v/s 14% in FY15).
Investors are advised to refer through important disclosures made at the last page of the Research Report.
Motilal Oswal research is available on www.motilaloswal.com/Institutional-Equities, Bloomberg, Thomson Reuters, Factset and S&P Capital.
Kumar Saurabh
(Kumar.Saurabh@MotilalOswal.com); +91 22 3982 5584
Amey Chalke
(Amey.Chalke@MotilalOswal.com); +91 22 39825423

Sun Pharma
Key takeaways from earnings call
India (27% of sales)
India branded business grew 8%YoY to INR18.9b, reflecting sequential recovery
from 2QFY16.
SUNP has withdrawn policy of bonus sales and giving discounts on acute
products, resulting lower sales growth over last two quarters. However, going
ahead, it will improve the profitability of the India business.
In 3Q, SUNP continues to rank no 1 in Indian pharma market and has captured
8.8% market share till date. It also market leader in 12 classes of doctors in
India.
Integration with Ranbaxy for domestic formulation business is on track
.
Exhibit 2: Domestic growth recovered in 3Q
Growth YoY (%)
62
52
7
-15
71
Domestic formulations (INR b)
89 89
2
13
44
17
20
21
18
17
16
11
18
-11
7.9 7.8 8.5 9.5 9.5 9.5 16
1
18
8
19
Growth YoY (%)
84
66
Exhibit 1: Revenues grew 3% in 3Q
Sales (INR b)
82
58
33
32
31
50
32
92
29
31
35
42
43
40
63
80
69
62
68 68
Source: Company, MOSL
US business (47% of sales)
US sales declined 5.5%YoY to INR32b (USD486m), impacted by pricing and
supply constraints at Halol facility.
SUNP has launched its generic version of Gleevec in US in Feb’16. However,
management believes market share ramp up could be slow as unlike normal
generic products Gleevec is being distributed by different set of specialized
pharmacies in US.
Over last nine months, SUNP has filed 11 products and received 9 approvals
from US FDA. Cumulatively, it has received 435 ANDA approvals till date and 156
ANDAs are still pending with US FDA.
SUNP has taken additional remediation steps after receiving warning letter for
Halol facility in Dec’15. It is likely to request US FDA to re-inspect Halol facility in
1QFY17.
The management clarified that less sales in Sumatriptan injector is on account of
supply constrains at Halol facility and are likely to ramp up going ahead.
However reduction in Doxil sales is on account of competition and not due to
Halol supply constraints.
SUNP has successfully integrated the Opiod business in 3Q. However, it also
indicated that access to raw material in control substances doesn’t ensure
higher quota from DEA. However, it helps to gain more market share due to
competitive pricing.
12 February 2016
2

Sun Pharma
Exhibit 3: Supply issues continue to hit US business
US sales (USD m)
119
35
64
31
69
56
22
61
26
22
-8
-19
-42
1.6 2.2 1.9 2.1 3.1 3.1 3.5 4.2 4.7 5.5
5.0 4.8 5.8
5.7
Growth YoY (%)
7.1
Exhibit 4: R&D spend at 8% of sales in 3Q
R&D cost (INR b)
7.1 7.6
5.5 5.2
6.8
% of sales
8.9
7.7
8.2
5.5 5.0
7.0
276 330 373 414 432 402 601 906 546 492 487 522 504
Source: Company, MOSL
Emerging markets & RoW business (22% of sales)
The declined in emerging markets and RoW business sales is on account of
currency issues and discontinuance of low margin businesses during last few
quarters.
Tax rates could go up if profitability of subsidiaries in high tax brackets increases
in the future.
SUNP has started seeing positive impact of Ranbaxy integration from this
quarter and is confident of achieving USD 300m synergy by FY18.
SUNP is expected to file this product in CY17. Currently, it is waiting for Phase III
trial data. Tildrakizumab that is once a quarter product versus Cosentyx which is
once a month product.
Tax rates
Ranbaxy integration
MK-3222
12 February 2016
3

Sun Pharma
Sun pharma’s US subsidiary Taro reported 3Q numbers on 11
th
Feb 2016. Key
highlights of 3Q results:
Net sales at USD 258m, (Up 9% YoY, est USD 245m) increased 22% sequentially,
reflecting price hike benefits in key drugs. Volume increase was marginal in 3Q.
Gross margins stood at 82.9% (v/s est. 79.8%) with gross profits improving
11%YoY in 3QFY16.
EBITDA (margins at 65.8%) at INR170m was 14% ahead of estimates led by
saving in other expenses and better gross margins in 3Q.
Reported PAT at USD 189m, beat estimate by 55% (includes a forex gain of USD
24m). Adjusted for forex gain, PAT was 38% ahead of estimates at USD167m.
Tax rate was lower in 3Q at 5.9% vsest of 20.4%.
During the quarter, Taro received approvals for Naftifine Hydrochloride Cream.
While pending ANDA approvals stand at 35 ANDAs.
Cash and cash equivalent: USD 1.2b (up USD 263m over Mar’15).
We expect Taro to retain leadership in US generic dermatology market:
We do not
expect disruption in recent price hikes taken in relatively less crowded dermatology
generic market (USD2.5bn, 5-6 large players) Product development and approval
timeline would restrict new players’ entry over medium term and pricing is likely to
be benign. Taro has intensified product development over last 4 yrs (35 pending
ANDAs) which would aid its revenue growth over medium term.
Exhibit 5:
Taro
financials
USD M
Sales
Growth (%)
Cost of sales (incl Depn)
Gross profit
GP Margin (%)
Operating expenses:
R&D
R&D as a % of sales
SG&A
SG&A as a % of sales
Operating Profit
Operating Profit Margin (%)
EBITDA
EBITDA margin (%)
Financial expenses
Extraordinary items incl forex
Other income
PBT
Taxes
Effective tax rate (%)
Net income before MI
Minority interest
Net income
3QFY16A
258.3
44.2
214.2
82.9
17.9
6.9
22.8
8.8
173.4
67.1
169.9
65.8
-3.0
-23.9
0.7
201.0
11.8
5.9
189.2
0.0
189.1
3QFY15A
237.7
44.2
193.5
81.4
12.8
5.4
21.3
9.0
159.3
67.0
155.4
65.4
0.0
-8.1
0.4
167.8
28.2
16.8
139.6
0.1
139.5
% YoY
8.7
-0.1
10.7
1.5
39.9
7.0
8.8
0.1
9.3
0.4
2QFY16A
212.1
43.3
168.8
79.6
18.7
8.8
25.0
11.8
125.1
59.0
120.7
56.9
0.0
-34.7
0.8
160.6
30.4
18.9
130.2
0.0
130.2
% QoQ
21.8
2.0
26.9
-78.1
-4.0
-8.6
38.6
40.7
2QFY16E
244.8
49.5
195.4
79.8
15.9
6.5
26.9
11.0
152.5
62.3
149.0
60.9
0.0
0.0
0.5
153.0
31.2
20.4
121.8
0.0
121.7
% Var.
5.5
-10.7
9.6
Taro’s 3QFY16 results beat estimates
12.8
-15.2
13.7
14.0
19.8
25.2
31.4
35.5
35.6
45.3
45.3
55.4
55.4
E: MOSL Estimates
12 February 2016
4

Sun Pharma
Operating metrics
Exhibit 6: Key operating metrics
4QFY13 1QFY14
Revenue Mix (%)
India
USA
RoW
API
Revenue Gr. (%)
India
USA
RoW
API
As % of sales
Raw material
Staff cost
R&D cost
Other expenses
Tax Rate
Margins (%)
Gross Margins
EBITDA Margins
EBIT Margins
PAT margins
82.8
41.0
42.0
35.9
84.9
44.0
43.9
(33.4)
80.9
43.6
44.1
37.2
81.7
46.1
47.4
41.5
83.4
44.2
46.7
43.6
73.9
30.3
29.9
20.5
77.2
37.6
34.2
29.5
75.1
30.8
27.1
9.9
74.0
14.3
11.6
19.4
73.7
24.8
26.3
10.4
77.1
27.9
27.2
20.1
75.1
30.6
30.3
25.8
17.2
14.3
7.1
20.3
13.8
15.1
14.5
5.5
21.0
10.0
19.1
12.6
5.0
19.6
15.0
18.3
12.0
7.1
16.5
12.0
16.6
13.0
7.6
18.7
6.4
26.1
17.4
5.5
20.9
11.9
22.8
14.0
5.2
20.4
10.6
24.9
15.9
6.8
21.7
60.2
26.0
18.4
8.9
32.4
(101.8)
26.3
18.8
7.7
22.4
14.2
22.9
17.8
7.0
24.4
19.7
24.9
16.3
8.2
20.3
10.0
25.0
57.3
12.6
5.0
31.9
(11.1)
76.9
22.1
11.0
24.1
57.6
12.8
5.6
30.8
44.4
31.8
23.0
(3.7)
22.4
61.0
11.6
4.9
57.0
17.2
94.6
32.2
20.4
21.9
61.8
12.0
4.3
49.8
20.1
79.2
32.1
(16.7)
23.1
60.6
10.8
5.5
31.5
21.4
39.1
12.9
30.5
25.2
47.4
24.0
3.2
81.1
16.9
48.8
239.3
87.6
22.4
53.1
20.7
3.8
89.3
21.3
64.9
237.6
83.0
25.1
48.7
22.5
3.6
61.0
84.3
26.4
200.3
66.2
25.3
49.1
20.9
4.6
51.4
65.8
22.6
191.2
30.5
27.1
46.9
21.6
4.1
3.2
11.1
2.2
(7.2)
57.4
26.5
48.3
20.5
4.6
(14.7)
1.0
(22.2)
(16.2)
51.8
26.6
45.1
21.8
6.2
2.1
8.3
(5.5)
(0.8)
176.6
2QFY14 3QFY14
4QFY14 1QFY15
2QFY15
3QFY15 4QFY15
1QFY16 2QFY16 3QFY16
Source: Company; MOSL
12 February 2016
5

Sun Pharma
Valuation and view
SUNP has historically commanded 20-25% premium to Indian pharma peers,
typically at 25-27x one-year forward P/E multiples. The stock is currently trading at
46x FY16E, 30x FY17E and 21.7x FY18E, which does not fully value its rich US pipeline
and stable, cash-generating domestic business. Consistent outperformance in the
domestic market with market share gains and high profitability reflect
management’s execution capability (and product selection skills). Identification of
value-accretive assets and integrating them successfully has been one of the
cornerstones of SUNP’s success.
We believe that the valuation premium is likely to be maintained on the back of:
High earnings visibility on a favorable base (forecast EPS CAGR of 26% over
FY15-18E).
Sustained improvement in ROE, implying high capital efficiency. We expect ROE
to expand from 21% in FY15E to 24% by FY18E.
Strong cash generation and Healthy Balance Sheet. We expect SUNP to generate
INR 258b free cash flows over FY16-18E and its cash surplus to reach INR 200b+
(~50% of capital employed)
Our Target price implies 15% upside
We assign a target P/E of 25x to SUNP’s base business EPS for FY18E and arrive at
target price of INR 975, implying 15% upside from current levels. Our target multiple
is:
At higher end of its historic average P/E band (1 yr forward)
At 15% premium to sector average P/E of 22x.
Lower than current trading multiple (FY16E P/E)
Key catalysts going forward are:
We have not factored any potential acquisition that SUNP can execute (net cash
surplus) as well as positive development of its novel molecule (tildrakizumab, in-
licensed from Merck).
Execution of RBXY integration would be a key catalyst to watch out in future.
Higher than expected upsides from niche molecules in US (gGleevec).
Risks to our thesis are:
Currency volatility:
SUNP derives more than 75% of its revenues (and profits)
from overseas business (largely the US) and hence is affected by currency
fluctuations on an operational level. As a prudent measure though, the company
has hedged ~50% of its net exposure to the USD through forward covers
(<12mths duration) in the past. A reversal in current trend (i.e., rupee
appreciation) thus poses downside risk to forecasts.
Increased competition in US derma market:
Taro accounts for 17% of SUNP’s
business and is currently benefitting from lack of enough competition in the US
derma market (and price hikes). We do not expect new player’s entry for 4-5
years at least due to developmental timeline, etc. However, if some of the
approved players (2-3) re-enter the market, there could be risk to pricing in the
US derma market, hurting SUNP (Taro) adversely.
12 February 2016
6

Sun Pharma
Exhibit 7: PE Band (x)
62
52
42
32
22
12
PE (x)
Median(x)
Peak(x)
Min(x)
Avg(x)
54.7
Exhibit 8: PE relative to Sensex
210
140
70
50.0
Sun Pharma PE Relative to Sensex PE (%)
LPA (%)
93.1
24.9
15.7
21.2
30.2
0
-70
Source: Company, MOSL
12 February 2016
7

Sun Pharma
Story in charts
Exhibit 9: Revenues grew 3% in 3Q
Sales (INR b)
82
58
33
32
31
50
32
92
Growth YoY (%)
62
52
7
29
31
35
42
43
40
63
80
69
62
-15
71
64
Exhibit 10: Supply issues continue to hit US business
US sales (USD m)
119
2
35
31
69
56
22
61
26
22
-8
-19
-42
Growth YoY (%)
68 68
276 330 373 414 432 402 601 906 546 492 487 522 504
Source: Company, MOSL
Exhibit 11: Domestic growth recovered in 3Q
Domestic formulations (INR b)
89 89
44
13
17
20
21
18
17
16
11
18
-11
7.9 7.8 8.5 9.5 9.5 9.5 16
1
18
8
19
Growth YoY (%)
84
66
Exhibit 12: R&D spend at 8% of sales in 3Q
R&D cost (INR b)
7.1
7.1 7.6
5.5 5.2
6.8
% of sales
8.9
7.7
8.2
5.7
5.5 5.0
7.0
1.6 2.2 1.9 2.1 3.1 3.1 3.5 4.2 4.7 5.5
5.0 4.8 5.8
Source: Company, MOSL
Exhibit 13: Revenues to grow by 10% CAGR
Formulations (INR b)
API (INR b)
16
Exhibit 14: US generic sales to be driven by new launches
US Sales (USD m)
110.8
14
47.5
-30.5
494
55.0
42.9
39.3
-3.6
729
1130
1615
2249
2167
2581
Growth YoY (%)
11
8
154
265
14
19.1
2518
6
34
5
53
6
75
8
106
272
324
349
FY10 FY11 FY12 FY13 FY14 FY15 FY16E FY17E FY18E
Source: Company, MOSL
12 February 2016
8

Sun Pharma
Exhibit 15: Domestic formulations sales to sustain
India sales (INR b)
82%
30.6
30%
24
22%
29
2%
30
24%
37
67
8%
73
Growth YoY (%)
34.2
Exhibit 16: Margins likely to improve
EBITDA (INR m)
39.9
43.7
43.3
EBITDA Margin (%)
28.3
29.2
33.3
35.7
16%
85
15%
98
12
FY10
20
FY11
32
FY12
49
FY13
69
FY14
77
82
112
129
FY15 FY16E FY17E FY18E
Source: Company, MOSL
Exhibit 17: Earnings to grow at 26% CAGR (on fav. base)
Exhibit 18: Healthy return ratios to sustain
RoE (%)
30.4
23.6
21.0
24.0
25.6
31.5
25.6
31.5
21.5
25.7
21.8
17.5
21.7
24.0
RoCE (%)
30.0
30.8
6
8
11
12
13
19
20
33
39
FY11
FY12
FY13
FY14
FY15
FY16E FY17E FY18E
Source: Company, MOSL
FY10 FY11 FY12 FY13 FY14 FY15 FY16E FY17E FY18E
Source: Company, MOSL
12 February 2016
9

Sun Pharma
Financials and Valuation
Income Statement
Y/E Mar
Net Sales
Change (%)
EBITDA
EBITDA Margin (%)
Depreciation
EBIT
Interest
Other Income
Extraordinary items
PBT
Tax
Tax Rate (%)
Min. Int. & Assoc. Share
Reported PAT
Adjusted PAT
Change (%)
2011
57,214
50.2
19,566
34.2
2,049
17,518
739
3,611
-32
20,357
1,286
6.3
913
18,158
18,186
34.6
2011
1,036
93,798
94,833
3,717
-3,652
103,370
39,128
16,794
22,334
2,355
22,297
61,146
14,895
11,049
22,046
13,156
15,361
10,078
5,283
45,785
103,371
2012
80,098
40.0
31,947
39.9
2,912
29,035
282
4,856
-11
33,598
3,826
11.4
3,855
25,917
25,926
42.6
2012
1,036
120,628
121,663
2,739
-5,199
130,820
46,542
20,406
26,136
3,447
22,129
90,681
20,870
19,261
33,672
16,878
24,950
14,410
10,541
65,730
130,820
2013
112,388
40.3
49,063
43.7
3,362
45,701
443
3,727
-5,836
43,148
8,456
19.6
4,863
29,830
34,791
34.2
2013
1,036
148,862
149,897
2,072
-7,122
161,197
56,026
24,421
31,604
5,626
24,116
113,420
25,778
27,108
40,587
19,948
38,439
15,752
22,687
74,981
161,198
2014
160,044
42.4
69,257
43.3
4,092
65,165
442
6,282
-25,174
45,831
7,022
15.3
7,375
31,434
52,813
51.8
2014
2,071
183,178
185,249
24,982
-9,110
220,333
63,886
28,904
34,982
8,415
27,860
177,393
31,230
22,004
75,902
48,257
61,509
15,887
45,622
115,884
220,333
2015
272,865
70.5
77,198
28.3
11,947
65,250
5,790
6,946
-2,378
64,029
9,147
14.3
9,488
45,394
47,415
-10.2
2015
2,406
253,826
256,232
77,827
-17,516
345,203
130,369
60,617
69,752
20,386
27,163
297,403
56,680
53,123
109,980
77,619
126,574
59,198
67,376
170,828
345,203
2016E
282,997
3.7
82,499
29.2
10,750
71,749
5,000
9,956
-6,852
69,853
11,889
17.0
10,049
47,915
47,825
0.9
2016E
2,406
286,916
289,322
64,585
-17,516
375,100
142,369
69,301
73,068
22,425
27,163
333,260
56,272
52,398
144,293
80,297
137,890
60,407
77,483
195,370
375,099
2017E
335,951
18.7
111,846
33.3
11,750
100,096
3,000
13,000
0
110,096
19,707
17.9
10,850
79,539
69,596
45.5
2017E
2,406
349,565
351,971
47,308
-17,516
431,322
154,369
79,335
75,034
24,667
27,163
403,773
62,678
57,405
192,981
90,709
156,389
67,284
89,105
247,384
431,321
(INR Million)
2018E
361,590
7.6
128,913
35.7
12,500
116,413
1,000
16,500
0
131,913
25,789
19.6
12,300
93,824
93,824
34.8
Balance Sheet
Y/E Mar
Share Capital
Reserves
Net Worth
Debt
Deferred Tax
Total Capital Employed
Gross Fixed Assets
Less: Acc Depreciation
Net Fixed Assets
Capital WIP
Investments
Current Assets
Inventory
Debtors
Cash & Bank
Loans & Adv, Others
Curr Liabs & Provns
Curr. Liabilities
Provisions
Net Current Assets
Total Assets
(INR Million)
2018E
2,406
426,499
428,905
34,795
-17,516
508,043
166,369
90,149
76,220
27,134
27,163
492,801
65,095
61,930
267,176
98,599
172,349
69,878
102,471
320,452
508,042
12 February 2016
10

Sun Pharma
Financials and valuation
Ratios
Y/E Mar
Basic (INR)
EPS
Cash EPS
Book Value
DPS
Payout (incl. Div. Tax.)
Valuation(x)
P/E
Cash P/E
Price / Book Value
EV/Sales
EV/EBITDA
Dividend Yield (%)
Profitability Ratios (%)
RoE
RoCE
Turnover Ratios (%)
Asset Turnover (x)
Debtors (No. of Days)
Inventory (No. of Days)
Creditors (No. of Days)
Net Debt/Equity (x)
2011
7.6
8.4
39.4
1.5
22.1
2012
10.8
12.0
50.6
1.8
17.2
2013
14.5
13.8
62.3
2.2
17.5
2014
22.0
14.8
77.0
2.6
18.7
38.6
57.4
11.0
12.3
28.3
0.3
21.0
23.6
0.6
70
95
98
-0.2
2011
19,566
3,578
-286
-4,048
0
18,811
-16,500
2,311
9,367
0
-7,134
8,225
2,006
-739
-4,213
5,280
16,957
5,089
22,046
24.0
30.4
0.7
88
95
109
-0.2
2012
31,947
4,845
-8,319
-5,373
0
23,099
-10,585
12,515
169
0
-10,416
5,318
-978
-282
-5,115
-1,058
11,626
22,046
33,672
25.6
31.5
0.8
88
84
91
-0.2
2013
49,063
-2,109
-2,336
-10,379
0
34,239
-22,501
11,737
-1,987
0
-24,488
4,334
-668
-443
-6,058
-2,835
6,915
33,672
40,587
31.5
25.6
0.8
50
71
64
-0.2
2014
69,257
-18,892
-5,589
-9,010
0
35,767
-18,580
17,187
-3,745
0
-22,324
6,674
22,910
-442
-7,270
21,872
35,315
40,587
75,902
2015
19.7
23.8
106.5
4.3
21.8
43.0
35.6
8.0
7.3
25.7
0.5
21.5
25.7
1.0
71
76
110
-0.1
2015
77,198
4,569
-20,865
-17,553
0
43,348
-82,570
-39,223
698
0
-81,872
37,513
52,845
-5,790
-11,964
72,605
34,080
75,902
109,982
2016E
19.9
24.4
120.3
5.0
24.3
42.7
34.8
7.1
6.8
23.4
0.6
17.5
21.8
0.8
68
73
110
-0.2
2016E
82,499
3,104
9,770
-11,889
0
83,484
-16,104
67,380
0
0
-16,104
-750
-13,242
-5,000
-14,075
-33,067
34,313
109,980
144,293
2017E
28.9
37.9
146.3
6.0
18.7
29.3
22.3
5.8
5.6
16.7
0.7
21.7
30.0
0.8
62
68
110
-0.4
2017E
111,846
13,000
-3,326
-19,707
0
101,813
-15,958
85,854
0
0
-15,958
0
-17,276
-3,000
-16,890
-37,166
48,688
144,293
192,981
2018E
39.0
44.2
178.3
6.0
15.9
21.7
19.2
4.8
4.9
13.8
0.7
24.0
30.8
0.8
63
66
110
-0.5
Cash Flow Statement
Y/E Mar
Adjusted EBITDA
Non cash opr. exp (inc)
(Inc)/Dec in Wkg. Cap.
Tax Paid
Other operating activities
CF from Op. Activity
(Inc)/Dec in FA & CWIP
Free cash flows
(Pur)/Sale of Invt
Others
CF from Inv. Activity
Inc/(Dec) in Net Worth
Inc / (Dec) in Debt
Interest Paid
Divd Paid (incl Tax) & Others
CF from Fin. Activity
Inc/(Dec) in Cash
Add: Opening Balance
Closing Balance
(INR Million)
2018E
128,913
16,500
1,128
-25,789
0
120,751
-16,153
104,599
0
0
-16,153
0
-12,513
-1,000
-16,890
-30,403
74,196
192,981
267,176
12 February 2016
11

Sun Pharma
Corporate profile
Company description
Sun Pharma is among the largest players in the
domestic formulations market and the most
profitable one. It makes and markets specialty
medicines and APIs for chronic therapy areas such as
cardiology, psychiatry, neurology, etc. Sun has
forayed into regulated markets by acquiring majority
stake in CaracoPharma and has strengthened its
presence in US by recent acquisition of Taro.
Source: MOSL/Bloomberg
Exhibit 1: Sensex rebased
Exhibit 2: Shareholding pattern (%)
Promoter
DII
FII
Others
Sep-15
54.7
8.1
27.6
9.7
Jun-15
54.7
7.8
23.8
13.8
Sep-14
63.7
4.6
22.8
9.0
Exhibit 3: Top holders
Holder Name
LIC of India
Government of Singapore
Company Ltd General Sub Fund
Lakshdeep Investments & Finance Pvt Ltd
Abu Dhabi Investment Authority-Gulab
% Holding
3.0
1.6
1.5
1.5
1.2
Source: Capitaline
Note: FII Includes depository receipts
Source: Capitaline
Exhibit 4: Top management
Name
Israel Makov
Dilip S Shanghvi
Sunil R Ajmera
Designation
Chairman
Managing Director
Company Secretary
Exhibit 5: Directors
Name
Ashwin Dani
Keki M Mistry
Sailesh T Desai
Rekha Sethi
Name
Hasmukh S Shah
S Mohanchand Dadha
Sudhir V Valia
Source: Capitaline
Exhibit 6: Auditors
Name
Deloitte Haskins & Sells LLP
Kailash Sankhlecha & Associates
Type
Statutory
Cost Auditor
Exhibit 7: MOSL forecast v/s consensus
EPS
(INR)
FY16
FY17
FY18
MOSL
forecast
19.9
28.9
39.0
Consensus
forecast
21.9
33.0
39.8
Variation (%)
-9.1
-12.3
-2.0
Source: Bloomberg
Source: Capitaline
12 February 2016
12

Sun Pharma
NOTES
12 February 2016
13

Disclosures
This document has been prepared by Motilal Oswal Securities Limited (hereinafter referred to as Most) to provide information about the company(ies) and/sector(s), if any, covered in the report and may be
Sun Pharma
its
distributed by it and/or
affiliated company(ies). This report is for personal information of the selected recipient/s and does not construe to be any investment, legal or taxation advice to you. This research report does not constitute an offer, invitation or
inducement to invest in securities or other investments and Motilal Oswal Securities Limited (hereinafter referred as MOSt) is not soliciting any action based upon it. This report is not for public distribution and has been furnished to
you solely for your general information and should not be reproduced or redistributed to any other person in any form. This report does not constitute a personal recommendation or take into account the particular investment
objectives, financial situations, or needs of individual clients. Before acting on any advice or recommendation in this material, investors should consider whether it is suitable for their particular circumstances and, if necessary, seek
professional advice. The price and value of the investments referred to in this material and the income from them may go down as well as up, and investors may realize losses on any investments. Past performance is not a guide for
future performance, future returns are not guaranteed and a loss of original capital may occur.
MOSt and its affiliates are a full-service, integrated investment banking, investment management, brokerage and financing group. We and our affiliates have investment banking and other business relationships with a some
companies covered by our Research Department. Our research professionals may provide input into our investment banking and other business selection processes. Investors should assume that MOSt and/or its affiliates are
seeking or will seek investment banking or other business from the company or companies that are the subject of this material and that the research professionals who were involved in preparing this material may educate investors
on investments in such business . The research professionals responsible for the preparation of this document may interact with trading desk personnel, sales personnel and other parties for the purpose of gathering, applying and
interpreting information. Our research professionals are paid on twin parameters of performance & profitability of MOSt.
MOSt generally prohibits its analysts, persons reporting to analysts, and members of their households from maintaining a financial interest in the securities or derivatives of any companies that the analysts cover. Additionally, MOSt
generally prohibits its analysts and persons reporting to analysts from serving as an officer, director, or advisory board member of any companies that the analysts cover. Our salespeople, traders, and other professionals or affiliates
may provide oral or written market commentary or trading strategies to our clients that reflect opinions that are contrary to the opinions expressed herein, and our proprietary trading and investing businesses may make investment
decisions that are inconsistent with the recommendations expressed herein. In reviewing these materials, you should be aware that any or all of the foregoing among other things, may give rise to real or potential conflicts of interest.
MOSt and its affiliated company(ies), their directors and employees and their relatives may; (a) from time to time, have a long or short position in, act as principal in, and buy or sell the securities or derivatives thereof of companies
mentioned herein. (b) be engaged in any other transaction involving such securities and earn brokerage or other compensation or act as a market maker in the financial instruments of the company(ies) discussed herein or act as an
advisor or lender/borrower to such company(ies) or may have any other potential conflict of interests with respect to any recommendation and other related information and opinions.; however the same shall have no bearing
whatsoever on the specific recommendations made by the analyst(s), as the recommendations made by the analyst(s) are completely independent of the views of the affiliates of MOSt even though there might exist an inherent
conflict of interest in some of the stocks mentioned in the research report .Reports based on technical and derivative analysis center on studying charts company's price movement, outstanding positions and trading volume, as
opposed to focusing on a company's fundamentals and, as such, may not match with a report on a company's fundamental analysis. In addition MOST has different business segments / Divisions with independent research
separated by Chinese walls catering to different set of customers having various objectives, risk profiles, investment horizon, etc, and therefore may at times have different contrary views on stocks sectors and markets.
Unauthorized disclosure, use, dissemination or copying (either whole or partial) of this information, is prohibited. The person accessing this information specifically agrees to exempt MOSt or any of its affiliates or employees from,
any and all responsibility/liability arising from such misuse and agrees not to hold MOSt or any of its affiliates or employees responsible for any such misuse and further agrees to hold MOSt or any of its affiliates or employees free
and harmless from all losses, costs, damages, expenses that may be suffered by the person accessing this information due to any errors and delays. The information contained herein is based on publicly available data or other
sources believed to be reliable. Any statements contained in this report attributed to a third party represent MOSt’s interpretation of the data, information and/or opinions provided by that third party either publicly or through a
subscription service, and such use and interpretation have not been reviewed by the third party. This Report is not intended to be a complete statement or summary of the securities, markets or developments referred to in the
document. While we would endeavor to update the information herein on reasonable basis, MOSt and/or its affiliates are under no obligation to update the information. Also there may be regulatory, compliance, or other reasons that
may prevent MOSt and/or its affiliates from doing so. MOSt or any of its affiliates or employees shall not be in any way responsible and liable for any loss or damage that may arise to any person from any inadvertent error in the
information contained in this report. MOSt or any of its affiliates or employees do not provide, at any time, any express or implied warranty of any kind, regarding any matter pertaining to this report, including without limitation the
implied warranties of merchantability, fitness for a particular purpose, and non-infringement. The recipients of this report should rely on their own investigations.
This report is intended for distribution to institutional investors. Recipients who are not institutional investors should seek advice of their independent financial advisor prior to taking any investment decision based on this report or for
any necessary explanation of its contents.
Most and it’s associates may have managed or co-managed public offering of securities, may have received compensation for investment banking or merchant banking or brokerage services, may have received any compensation
for products or services other than investment banking or merchant banking or brokerage services from the subject company in the past 12 months.
Most and it’s associates have not received any compensation or other benefits from the subject company or third party in connection with the research report.
Subject Company may have been a client of Most or its associates during twelve months preceding the date of distribution of the research report
MOSt and/or its affiliates and/or employees may have interests/positions, financial or otherwise of over 1 % at the end of the month immediately preceding the date of publication of the research in the securities mentioned in this
report. To enhance transparency, MOSt has incorporated a Disclosure of Interest Statement in this document. This should, however, not be treated as endorsement of the views expressed in the report.
Motilal Oswal Securities Limited is registered as a Research Analyst under SEBI (Research Analyst) Regulations, 2014. SEBI Reg. No. INH000000412
There are no material disciplinary action that been taken by any regulatory authority impacting equity research analysis activities
Analyst Certification
The views expressed in this research report accurately reflect the personal views of the analyst(s) about the subject securities or issues, and no part of the compensation of the research analyst(s) was, is, or will be directly or
indirectly related to the specific recommendations and views expressed by research analyst(s) in this report. The research analysts, strategists, or research associates principally responsible for preparation of MOSt research receive
compensation based upon various factors, including quality of research, investor client feedback, stock picking, competitive factors and firm revenues
Disclosure of Interest Statement
Analyst ownership of the stock
Served as an officer, director or employee
SUN PHARMACEUTICAL IN LTD
No
No
A graph of daily closing prices of securities is available at www.nseindia.com and http://economictimes.indiatimes.com/markets/stocks/stock-quotes
Regional Disclosures (outside India)
For U.S.
This report is not directed or intended for distribution to or use by any person or entity resident in a state, country or any jurisdiction, where such distribution, publication, availability or use would be contrary to law, regulation or which
would subject MOSt & its group companies to registration or licensing requirements within such jurisdictions.
Motilal Oswal Securities Limited (MOSL) is not a registered broker - dealer under the U.S. Securities Exchange Act of 1934, as amended (the"1934 act") and under applicable state laws in the United States. In addition MOSL is not a
registered investment adviser under the U.S. Investment Advisers Act of 1940, as amended (the "Advisers Act" and together with the 1934 Act, the "Acts), and under applicable state laws in the United States. Accordingly, in the
absence of specific exemption under the Acts, any brokerage and investment services provided by MOSL, including the products and services described herein are not available to or intended for U.S. persons.
This report is intended for distribution only to "Major Institutional Investors" as defined by Rule 15a-6(b)(4) of the Exchange Act and interpretations thereof by SEC (henceforth referred to as "major institutional investors"). This
document must not be acted on or relied on by persons who are not major institutional investors. Any investment or investment activity to which this document relates is only available to major institutional investors and will be
engaged in only with major institutional investors. In reliance on the exemption from registration provided by Rule 15a-6 of the U.S. Securities Exchange Act of 1934, as amended (the "Exchange Act") and interpretations thereof by
the U.S. Securities and Exchange Commission ("SEC") in order to conduct business with Institutional Investors based in the U.S., MOSL has entered into a chaperoning agreement with a U.S. registered broker-dealer, Motilal Oswal
Securities International Private Limited. ("MOSIPL"). Any business interaction pursuant to this report will have to be executed within the provisions of this chaperoning agreement.
The Research Analysts contributing to the report may not be registered /qualified as research analyst with FINRA. Such research analyst may not be associated persons of the U.S. registered broker-dealer, MOSIPL, and therefore,
may not be subject to NASD rule 2711 and NYSE Rule 472 restrictions on communication with a subject company, public appearances and trading securities held by a research analyst account.
For Singapore
Motilal Oswal Capital Markets Singapore Pte Limited is acting as an exempt financial advisor under section 23(1)(f) of the Financial Advisers Act(FAA) read with regulation 17(1)(d) of the Financial Advisors Regulations and is a
subsidiary of Motilal Oswal Securities Limited in India. This research is distributed in Singapore by Motilal Oswal Capital Markets Singapore Pte Limited and it is only directed in Singapore to accredited investors, as defined in the
Financial Advisers Regulations and the Securities and Futures Act (Chapter 289), as amended from time to time.
In respect of any matter arising from or in connection with the research you could contact the following representatives of Motilal Oswal Capital Markets Singapore Pte Limited:
Kadambari Balachandran
Email : kadambari.balachandran@motilaloswal.com
Contact : (+65) 68189233 / 65249115
Office Address : 21 (Suite 31),16 Collyer Quay,Singapore 04931
Motilal Oswal Tower, Level 9, Sayani Road, Prabhadevi, Mumbai 400 025
Phone: +91 22 3982 5500 E-mail: reports@motilaloswal.com
Motilal Oswal Securities Ltd
12 February 2016
14