Allcargo Logistics
BSE SENSEX
23,554
Bloomberg
Equity Shares (m)
M.Cap.(INRb)/(USDb)
52-Week Range (INR)
1, 6, 12 Rel. Per (%)
Avg Val, INRm/ Vol m
Free float (%)
S&P CNX
7,163
AGLL IN
252.1
40.3 / 0.6
218 / 128
-10/12/15
46
30.1
15 February 2016
Q3FY16 Results Update | Sector: Logistics
CMP: INR160
TP: INR243(+52%)
Buy
Macros keep EBITDA/PAT subdued, CFS shines; high FCF keeps balance
sheet strong
Financials & Valuations (INR b)
2016E 2017E 2018E
Y/E Mar
Net Sales
56.2
67.6
74.2
EBITDA
5.3
6.4
7.2
PAT
2.9
3.6
4.4
EPS (INR)
11.5
14.4
17.4
Gr. (%)
20.8
25.0
21.1
BV/Sh (INR)
85.5
98.1 113.3
RoE (%)
14.3
15.7
16.5
RoCE (%)
15.2
17.5
19.1
P/E (x)
13.9
11.1
9.2
P/BV (x)
1.9
1.6
1.4
Estimate change
TP change
Rating change
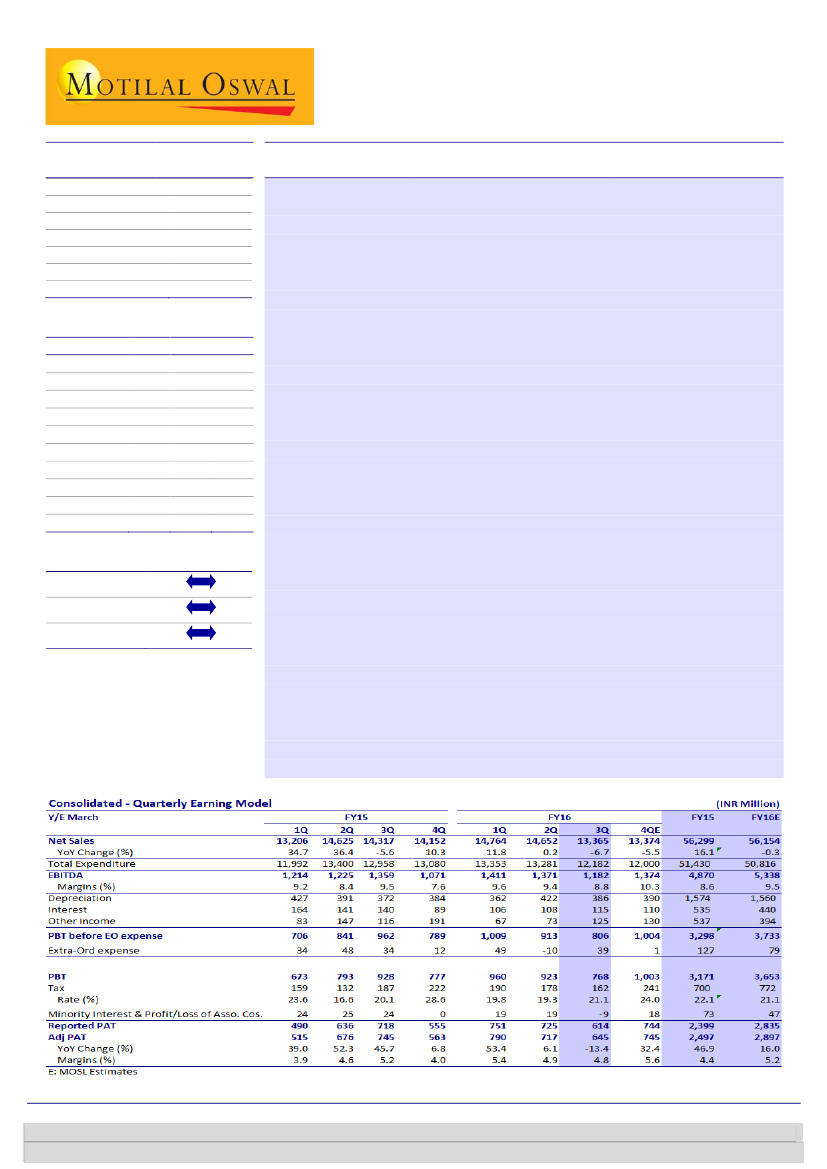
AGLL’s revenue declined 7% YoY and 9% QoQ to INR13.4b in 3QFY16 primarily
impacted by decline in MTO business. Reported EBITDA stood at INR1.2b (-13%
YoY, -14% QoQ); margins declined to 8.9% in 3QFY16 from 9.5% in 3QFY15. PAT
stood at INR0.6b (-14% YoY, -15% QoQ). For 9MFY16, Allcargo’s PAT grew 13% YoY
and its balance sheet continues to remain strong with debt/equity of 0.14 (net debt
of INR2.9b).
MTO volumes up 8% YoY in tough operating environment:
In the backdrop of
excess shipping capacity, Allcargo’s MTO volumes were decent with volumes at
116,168 TEUs (+8% YoY, -1% QoQ) in 3QFY16. Revenues stood at INR11b (-9%
YoY, -11% QoQ) primarily due to decline in freight rates (a pass through
component). While, EBIT stood at INR539m (-12% YoY, -14% QoQ) and margin
at 4.9% (5.1% in 3QFY15, flat QoQ), impacted by expansion costs for new
offices in Americas, Middle East & South East Asia.
CFS business performing strongly:
CFS volumes stood at 74,251 TEUs (+5%
YoY, flat QoQ). CFS revenue stood at INR1.2b (+8.5% YoY, flat QoQ).
Realizations stood at INR15,461/TEU as compared to INR14,566/TEU in
2QFY16. Realizations increased in 3QFY16 primarily due to handling of special
cargo and long standing containers. EBIT/TEU stood at INR5,172/TEU as
compared to INR4,570INR/TEU in 2QFY16 driven by improved efficiencies.
P&E business margins impacted by ship repairs:
While P&E revenue increased
6% YoY to INR1,399m, EBIT declined 45% to INR94m, impacted by (a)
additional depreciation on two new ships that were acquired in 2QFY16, (b)
repair of two ships and (c)INR110m derivative income in 3QFY15. Its crane
utilization continues to be above 90%.
Valuation and view:
We estimate EBITDA/PAT CAGR of 15%/23% through FY15-18E and return
ratios are expected to improve from ~13% to 17%-19% driven by improvement
in margins and reduction in capex intensity in the business.
We value Allcargo Logistics at 14x FY18E EPS, and arrive at a target price of
INR243. Maintain buy. The stock trades at 10.6x FY18EPS.
Investors are advised to refer through important disclosures made at the last page of the Research Report.
Motilal Oswal research is available on www.motilaloswal.com/Institutional-Equities, Bloomberg, Thomson Reuters, Factset and S&P Capital.
Harshad Borawake
(HarshadBorawake@MotilalOswal.com); +91 22 3982 5432
Rajat Agarwal
(Rajat.Agarwal@MotilalOswal.com); +91 22 3982 5558

Allcargo Logistics
Exhibit 1: AGLL 3QFY16 earnings snapshot (INR m)
1QFY15
Volume Details
MTO Volumes (TEU)
CFS/ICD Volumes (TEU)
Financial Summary (INRm)
MTO
CFS/ICD
P&E
Others
Net Revenue
Reported EBITDA
EBITDA margin
Depreciation
EBIT
Interest
Other Income
PBT before exceptionals
Exceptionals
PBT before exceptionals
Tax
Tax rate (%)
PAT
PAT margin (%)
101,937
72,930
2QFY15
108,874
75,398
3QFY15
107,261
70,587
4QFY15
104,128
72,664
1QFY16
113,410
78,727
2QFY16
117,574
77,027
3QFY16 YoY (%) QoQ (%)
116,168
74,251
8
5
-1
-4
11,309
907
1,165
78
13,206
1,214
9.2%
427
787
164
83
706
34
673
159
23.6%
490
3.7%
12,500
1,021
1,267
70
14,618
1,225
8.4%
391
835
141
147
841
48
793
132
16.6%
636
4.4%
12,101
1,059
1,322
93
14,317
1,359
9.5%
372
987
140
116
962
34
928
187
20.1%
718
5.0%
11,828
1,046
1,545
70
14,152
1,071
7.6%
384
687
89
191
789
12
777
222
28.6%
555
3.9%
12,431
1,094
1,425
76
14,779
1,411
9.5%
362
1,048
106
67
1,009
49
960
190
19.8%
751
5.1%
12,323
1,122
1,382
84
14,681
1,371
9.3%
422
949
108
73
913
(10)
923
178
19.3%
725
4.9%
10,964
1,148
1,399
109
13,392
1,183
8.8%
386
797
115
125
807
39
769
162
21.1%
615
4.6%
-9
8
6
17
-6
-13
4
-19
-18
8
-16
15
-17
-13
-14
-11
2
1
30
-9
-14
-8
-16
6
72
-12
-492
-17
-9
-15
Source: Company, MOSL
Key takeaways from concall
Globally LCL freight rates have nearly reached FCL freight rates. However, the
company guided that since LCL players also provide value-added services,
volumes are less likely to see a shift to FCL providers/shipping lines.
The company incurred INR1.3b expenses this quarterly primarily related for
business expansion and re-branding its offerings in the MTO segment.
During the quarter, two vessels were idle for a period of 10 days due to repair
work.
Allcargo had earlier announced plans to start CFS operations in Kolkata.
Operations are expected to commence in late 2016/early 2017. The CFS will
have a total planned capacity of 100,000 TEUs. Land for the CFS has been leased
from the port authority on a long-term basis.
Allcargo has announced plans to purchase controlling stake in CCI infrastructure,
a contract logistics company specializing in white goods, chemicals,
pharmaceuticals.
Allcargo board has approved an enabling resolution to raise INR3b through debt
for funding future expansion. However, no guidance was given on any particular
usage of these funds. Total FCF generated in the 9MFY16 period stood at
INR2.7b.
15 February 2016
2

Allcargo Logistics
Exhibit 2: MTO volumes (TEUs) increased 8% YoY and
declined 1% QoQ in 3QFY16
MTO Volumes (TEUs)
113,410
108,874
101,937
107,261
104,128
117,574
116,168
Exhibit 3: Realizations declined 16.3% YoY and 10.0% QoQ in
3QFY16; EBIT declines 2.8% QoQ
in INR '000/TEU
4.9
5.1
Realizations
5.7
5.2
EBIT (RHS)
5.3
4.6
111
115
113
114
2.1
110
105
94
Q1FY15 Q2FY15 Q3FY15 Q4FY15 Q1FY16 Q2FY16 Q3FY16
Source: MOSL, Company
Q1FY15 Q2FY15 Q3FY15 Q4FY15 Q1FY16 Q2FY16 Q3FY16
Source: MOSL, Company
Exhibit 4: CFS/ICD volumes (TEUs) increased 5.2% YoY and
declined 3.6% QoQ in 3QFY16
CFS/ICD Volumes (TEUs)
75,398
72,930
70,587
72,664
78,727
77,027
74,251
Exhibit 5: Realizations increased 3.2% YoY and 6.1% QoQ in
3QFY16; EBIT increased 18.1% YoY and 13.2% QoQ
in INR '000/TEU
Realizations
EBIT (RHS)
5.2
4.4
4.0
3.3
12
3.3
13
15
14
14
15
15
4.2
4.6
Q1FY15 Q2FY15 Q3FY15 Q4FY15 Q1FY16 Q2FY16 Q3FY16
Source: MOSL, Company
Q1FY15 Q2FY15 Q3FY15 Q4FY15 Q1FY16 Q2FY16 Q3FY16
Source: MOSL, Company
Valuation and view
Allcargo Logistics gives an unique opportunity to participate in the (a) domestic
economic revival (through CFS and P&E) and (b) exposure to global LCL (less
than container load) consolidation market where it is one of the top two players
(fast growing sub-segment in container shipping) with presence in >90
countries.
We believe that Allcargo Logistics through its superior size and global presence
via ECU Line has established an effective competitive advantage versus its
competitors. It is therefore well placed to tackle both any sluggishness in
container business as well as make good use of the opportunities in this space.
Strong balance sheet, increasing FCF will help Allcargo to further consolidate in
global LCL market and can also look at monetizing its domestic land bank to
benefit from upcoming rail DFC (dedicated freight corridor) and GST reform.
We estimate EBITDA/PAT CAGR of 15%/23% through FY15-18E and return ratios
are expected to improve from ~13% to 17%-19% driven by improvement in
margins and reduction in capex intensity in the business.
We value Allcargo Logistics at 14x FY18E EPS, to arrive at a fair value of INR243.
Maintain Buy. The stock trades at 11.1x/9.2x FY17/FY18EPS.
15 February 2016
3

Allcargo Logistics
Story in charts
Exhibit 6: MTO revenues (INRm) grew at 21% CAGR driven
by contribution from acquired entities
Domestic
FCL Marine
Hindustan Cargo
Econocaribe
Ecu-Line
Total
41
5
3
47
9
2
Exhibit 7: Regional MTO revenue share (in %) – America’s
share improved rapidly due to acquisitions
India
Far East
Mediterranean
6
37
3
21
18
2
13
CY09
5
35
2
23
18
3
14
CY10
Africa
ANZ
5
32
2
26
17
3
16
FY12 (15M)
5
29
3
25
19
3
16
FY13
America
Europe
4
30
3
24
24
2
13
FY14
6
30
3
19
29
0
12
FY15
22
21
17
15
-
-
29
28
28
26
8
-
-
17
18
14
12
-
3
7
3
3
3
1
2
0
1
4
3
3
3
3
2
2
2
2
CY06 CY07 CY08 CY09 CY10 FY12 FY13 FY14 FY15
(15M)
Source: Company, MOSL
34
-
32
-
Source: Company, MOSL
Exhibit 8: Expect MTO volumes to grow at 9% CAGR driven
by improving trade volumes
MTO volume ('000 teu)
YoY (%)
30%
20%
10%
422
456
497
542
0%
-10%
-20%
Exhibit 9: Allcargo has presence near the major ports in
India
200
238
337
285
335
CY09 CY10 FY12 - FY13 FY14 FY15 FY16E FY17E FY18E
15M
Source: Company, MOSL
Exhibit 10: Expect CFS volumes to grow at 8% CAGR at FY15-
FY18E
CFS volume ('000 teu)
60%
46%
227
275
285
64%
57%
44%
250
CFS utilization (%)
51%
292
55%
317
60%
343
65%
371
Exhibit 11: P&E revenue growth lagged increase in capital
employed led by slowdown in domestic economy
P&E Capital Employed (INRm)
1,053
579
105
184
574
P&E EBIT (INRm)
745
409
135
174
CY09 CY10 FY12 - FY13
15M
FY14
FY15 FY16E FY17E FY18E
1,146
CY07
1,342
CY08
2,488
CY09
3,611 10,672 10,660 9,762
CY10FY12 (15M)FY13
FY14
9,014
FY15
Source: Company, MOSL
15 February 2016
4

Allcargo Logistics
Exhibit 12: MTO segment contributes the highest to revenue
Revenue share (%)
9
7
10
7
12
8
MTO
11
8
CFS
8
6
P&E
9
7
Exhibit 13: P&E segment contributes the highest to EBIT
EBIT share (%)
23
38
39
MTO
24
37
39
CFS
13
38
P&E
5
36
20
29
30
41
30
83
77
79
81
85
84
49
59
51
FY15
CY09
CY10
FY12 (15M)
FY13
FY14
FY15
CY09
CY10 FY12 (15M) FY13
FY14
Source: Company, MOSL
15 February 2016
5

Allcargo Logistics
Financials and Valuations
Income Statement
Y/E Mar
Net Sales
Change (%)
EBITDA
EBITDA Margin (%)
Depreciation
EBIT
Interest
Other Income
Extraordinary items
PBT
Tax
Tax Rate (%)
Min. Int. & Assoc. Share
Reported PAT
Adjusted PAT
Change (%)
2010
28,633
38.9
2,717
9.5
550
2,167
195
266
0
2,239
480
21.4
100
1,659
1,659
27.7
2010
261
11,528
11,789
3,778
408
16,238
10,429
2,338
8,091
560
1,319
7,273
70
2,528
1,430
3,245
4,397
3,853
543
2,876
16,238
2012
42,804
49.5
5,238
12.2
1,337
3,901
644
452
0
3,709
734
19.8
132
2,844
2,844
71.4
2012
260
14,638
14,898
7,654
753
23,617
16,358
3,801
12,557
854
1,071
9,369
125
3,576
1,341
4,327
4,815
4,431
383
4,555
23,617
2013
39,263
-8.3
3,562
9.1
1,474
2,088
414
662
0
2,335
512
21.9
126
1,697
1,697
-40.3
2013
252
15,604
15,856
7,267
943
24,500
18,850
5,163
13,687
139
1,859
9,641
111
3,825
1,382
4,324
5,429
4,810
619
4,212
24,500
2014
48,594
23.8
3,913
8.1
1,755
2,159
563
365
0
1,960
416
21.2
51
1,493
1,493
-12.0
2014
252
17,679
17,931
9,921
1,045
29,361
20,528
7,094
13,434
236
1,902
11,675
114
5,715
1,647
4,199
6,938
6,336
602
4,737
29,361
2015
56,288
15.8
4,754
8.4
1,574
3,180
535
526
0
3,171
700
22.1
73
2,399
2,399
60.6
2015
252
18,826
19,078
6,134
1,101
26,532
20,244
8,283
11,961
302
894
12,648
117
6,476
1,738
4,318
7,928
7,301
627
4,720
26,532
2016E
56,154
-0.2
5,339
9.5
1,560
3,779
440
394
79
3,813
772
20.2
47
2,994
2,994
24.8
2016E
504
21,053
21,557
5,134
1,101
28,011
20,744
9,843
10,901
302
894
14,993
115
6,460
4,110
4,307
7,732
7,217
516
7,260
28,012
2017E
67,643
20.5
4,262
6.3
1,617
2,645
361
368
0
2,651
1,052
39.7
105
1,494
1,494
-50.1
2017E
504
24,222
24,726
4,134
1,101
30,181
21,244
11,459
9,785
363
894
20,028
144
7,782
6,914
5,189
9,543
8,935
608
10,485
30,181
(INR Million)
2018E
74,231
9.7
4,677
6.3
1,655
3,022
283
497
0
3,235
1,274
39.4
126
1,835
1,835
22.8
Balance Sheet
Y/E Mar
Share Capital
Reserves
Net Worth
Debt
Deferred Tax
Total Capital Employed
Gross Fixed Assets
Less: Acc Depreciation
Net Fixed Assets
Capital WIP
Investments
Current Assets
Inventory
Debtors
Cash & Bank
Loans & Adv, Others
Curr Liabs & Provns
Curr. Liabilities
Provisions
Net Current Assets
Total Assets
(INR Million)
2018E
504
28,062
28,566
3,134
1,101
33,021
21,744
13,114
8,630
399
894
24,950
158
8,540
10,558
5,694
10,506
9,805
700
14,444
33,021
15 February 2016
6

Allcargo Logistics
Financials and Valuations
Ratios
Y/E Mar
Basic (INR)
EPS
Cash EPS
Book Value
DPS
Payout (incl. Div. Tax.)
Valuation(x)
P/E
Cash P/E
Price / Book Value
EV/Sales
EV/EBITDA
Dividend Yield (%)
Profitability Ratios (%)
RoE
RoCE
Turnover Ratios (%)
Asset Turnover (x)
Debtors (No. of Days)
Inventory (No. of Days)
Creditors (No. of Days)
Leverage Ratios (%)
Net Debt/Equity (x)
2010
6.6
8.8
46.9
1.6
27.6
2012
11.3
16.6
59.1
0.8
8.0
2013
6.7
12.6
62.9
0.7
13.0
2014
5.9
12.9
71.1
0.8
14.8
27.0
12.4
2.2
1.0
12.4
0.5
15.3
17.0
1.7
32
1
50
0.2
2010
2,717
189
-376
-653
88
1,966
-4,425
-2,459
380
232
-3,813
1,047
1,707
-195
-199
2,361
513
916
1,430
17.0
17.3
1.8
30
1
43
0.5
2012
5,238
359
-1,353
-930
153
3,468
-5,991
-2,524
1,014
-414
-5,391
0
3,009
-556
-620
1,834
-89
1,430
1,341
11.0
11.3
1.6
36
1
47
0.4
2013
3,562
617
-22
-634
-278
3,244
-1,896
1,348
52
88
-1,757
0
-563
-538
-345
-1,446
41
1,341
1,382
8.8
9.3
1.6
43
1
50
0.5
2014
3,913
334
-195
-373
-572
3,107
-1,290
1,817
-237
-2,665
-4,192
0
2,732
-586
-797
1,350
265
1,382
1,647
2015
9.5
15.8
75.7
1.0
12.5
16.8
10.2
2.1
0.8
9.4
0.6
13.0
13.1
2.1
42
1
53
0.3
2015
4,754
484
113
-478
-573
4,300
-442
3,858
1,218
-1,028
-252
0
-2,509
-550
-898
-3,957
91
1,647
1,738
2016E
11.5
17.7
85.5
1.2
12.5
13.9
9.0
1.9
0.7
7.7
0.7
14.3
15.2
2.0
42
1
55
0.1
2016E
5,339
-80
-168
-772
0
4,319
-499
3,820
0
394
-105
0
-1,000
-440
-403
-1,842
2,372
1,738
4,110
2017E
14.4
20.8
98.1
1.5
12.5
11.1
7.7
1.6
0.6
5.9
0.9
15.7
17.5
2.2
42
1
54
-0.1
2017E
4,262
2,130
-421
-1,052
0
4,919
-562
4,357
0
368
-194
0
-1,000
-361
-560
-1,921
2,804
4,110
6,914
2018E
17.4
24.0
113.3
1.8
12.5
9.2
6.7
1.4
0.4
4.6
1.1
16.5
19.1
2.2
42
1
54
-0.2
Cash Flow Statement
Y/E Mar
Adjusted EBITDA
Non cash opr. exp (inc)
(Inc)/Dec in Wkg. Cap.
Tax Paid
Other operating activities
CF from Op. Activity
(Inc)/Dec in FA & CWIP
Free cash flows
(Pur)/Sale of Invt
Others
CF from Inv. Activity
Inc/(Dec) in Net Worth
Inc / (Dec) in Debt
Interest Paid
Divd Paid (incl Tax) & Others
CF from Fin. Activity
Inc/(Dec) in Cash
Add: Opening Balance
Closing Balance
(INR Million)
2018E
4,677
2,555
-315
-1,274
0
5,643
-535
5,108
0
497
-39
0
-1,000
-283
-677
-1,960
3,644
6,914
10,558
15 February 2016
7

Allcargo Logistics
Corporate profile
Company description
Exhibit 1: Sensex rebased
Incorporated in 1993, Allcargo logistics operates in
MTO,CFS/ICD and Project & Engineering services. It also
provides contract logistics services. Allcargo’s MTO
operations are present in more than 90 pairs of countries.
It operates 6 CFS/ICD in India and has landbanks at
Nagpur, Hyderabad and Bangalore.
Source: MOSL/Bloomberg
Exhibit 2: Shareholding pattern (%)
Promoter
DII
FII
Others
Sep-15
69.9
0.1
6.2
23.8
Jun-15
69.9
0.0
5.9
24.2
Sep-14
69.9
0.0
13.0
17.1
Exhibit 3: Top holders
Holder Name
BLACKSTONE GPV CAPITAL PARTNERS
MAURITIUS V-ALTD
BLACKSTONE GPV CAPITAL PARTNERS
(MAURITIUS) V-K LTD
BLACKSTONE GPV CAPITAL PARTNERS
(MAURITIUS) V-L LTD
NEW VERNON PRIVATE EQUITY LIMITED
ACACIA PARTNERS, LP
% Holding
4.4
4.4
3.8
2.5
2.3
Source: Capitaline
Note: FII Includes depository receipts
Source: Capitaline
Exhibit 4: Top management
Name
Shashi Kiran Shetty
Shailesh Dholakia
Designation
Chairman
&
Managing
Director
Company Secretary
Exhibit 5: Directors
Name
Adarsh Hegde
Arathi Shetty
Keki Elavia
J Ramachandran
Name
Akhilesh Gupta
Hari L Mudra
M P Bansal
Source: Capitaline
*Independent
Exhibit 6: Auditors
Name
Appan & Lokhandwala Associates
BSR & Co LLP
Mehta & Mehta
Mukundan K V
Type
Statutory
Statutory
Secretarial Audit
Internal
Source: Capitaline
Exhibit 7: MOSL forecast v/s consensus
EPS
(INR)
FY16
FY17
FY18
MOSL
forecast
11.5
14.4
17.4
Consensus
forecast
13.5
16.2
19.0
Variation (%)
-15.0
-10.8
-8.6
Source: Bloomberg
15 February 2016
8

Allcargo Logistics
NOTES
15 February 2016
9

This document has been prepared by Motilal Oswal Securities Limited (hereinafter referred to as Most) to provide information about the company(ies) and/sector(s), if any, covered in the report and may be distributed by it and/or its
Allcargo Logistics
affiliated company(ies). This report is for personal information of the selected recipient/s and does not construe to be any investment, legal or taxation advice to you. This research report does not constitute an offer, invitation or
inducement to invest in securities or other investments and Motilal Oswal Securities Limited (hereinafter referred as MOSt) is not soliciting any action based upon it. This report is not for public distribution and has been furnished to
you solely for your general information and should not be reproduced or redistributed to any other person in any form. This report does not constitute a personal recommendation or take into account the particular investment
objectives, financial situations, or needs of individual clients. Before acting on any advice or recommendation in this material, investors should consider whether it is suitable for their particular circumstances and, if necessary, seek
professional advice. The price and value of the investments referred to in this material and the income from them may go down as well as up, and investors may realize losses on any investments. Past performance is not a guide for
future performance, future returns are not guaranteed and a loss of original capital may occur.
MOSt and its affiliates are a full-service, integrated investment banking, investment management, brokerage and financing group. We and our affiliates have investment banking and other business relationships with a some
companies covered by our Research Department. Our research professionals may provide input into our investment banking and other business selection processes. Investors should assume that MOSt and/or its affiliates are
seeking or will seek investment banking or other business from the company or companies that are the subject of this material and that the research professionals who were involved in preparing this material may educate investors
on investments in such business . The research professionals responsible for the preparation of this document may interact with trading desk personnel, sales personnel and other parties for the purpose of gathering, applying and
interpreting information. Our research professionals are paid on twin parameters of performance & profitability of MOSt.
MOSt generally prohibits its analysts, persons reporting to analysts, and members of their households from maintaining a financial interest in the securities or derivatives of any companies that the analysts cover. Additionally, MOSt
generally prohibits its analysts and persons reporting to analysts from serving as an officer, director, or advisory board member of any companies that the analysts cover. Our salespeople, traders, and other professionals or affiliates
may provide oral or written market commentary or trading strategies to our clients that reflect opinions that are contrary to the opinions expressed herein, and our proprietary trading and investing businesses may make investment
decisions that are inconsistent with the recommendations expressed herein. In reviewing these materials, you should be aware that any or all of the foregoing among other things, may give rise to real or potential conflicts of interest.
MOSt and its affiliated company(ies), their directors and employees and their relatives may; (a) from time to time, have a long or short position in, act as principal in, and buy or sell the securities or derivatives thereof of companies
mentioned herein. (b) be engaged in any other transaction involving such securities and earn brokerage or other compensation or act as a market maker in the financial instruments of the company(ies) discussed herein or act as an
advisor or lender/borrower to such company(ies) or may have any other potential conflict of interests with respect to any recommendation and other related information and opinions.; however the same shall have no bearing
whatsoever on the specific recommendations made by the analyst(s), as the recommendations made by the analyst(s) are completely independent of the views of the affiliates of MOSt even though there might exist an inherent
conflict of interest in some of the stocks mentioned in the research report .Reports based on technical and derivative analysis center on studying charts company's price movement, outstanding positions and trading volume, as
opposed to focusing on a company's fundamentals and, as such, may not match with a report on a company's fundamental analysis. In addition MOST has different business segments / Divisions with independent research
separated by Chinese walls catering to different set of customers having various objectives, risk profiles, investment horizon, etc, and therefore may at times have different contrary views on stocks sectors and markets.
Unauthorized disclosure, use, dissemination or copying (either whole or partial) of this information, is prohibited. The person accessing this information specifically agrees to exempt MOSt or any of its affiliates or employees from,
any and all responsibility/liability arising from such misuse and agrees not to hold MOSt or any of its affiliates or employees responsible for any such misuse and further agrees to hold MOSt or any of its affiliates or employees free
and harmless from all losses, costs, damages, expenses that may be suffered by the person accessing this information due to any errors and delays. The information contained herein is based on publicly available data or other
sources believed to be reliable. Any statements contained in this report attributed to a third party represent MOSt’s interpretation of the data, information and/or opinions provided by that third party either publicly or through a
subscription service, and such use and interpretation have not been reviewed by the third party. This Report is not intended to be a complete statement or summary of the securities, markets or developments referred to in the
document. While we would endeavor to update the information herein on reasonable basis, MOSt and/or its affiliates are under no obligation to update the information. Also there may be regulatory, compliance, or other reasons that
may prevent MOSt and/or its affiliates from doing so. MOSt or any of its affiliates or employees shall not be in any way responsible and liable for any loss or damage that may arise to any person from any inadvertent error in the
information contained in this report. MOSt or any of its affiliates or employees do not provide, at any time, any express or implied warranty of any kind, regarding any matter pertaining to this report, including without limitation the
implied warranties of merchantability, fitness for a particular purpose, and non-infringement. The recipients of this report should rely on their own investigations.
This report is intended for distribution to institutional investors. Recipients who are not institutional investors should seek advice of their independent financial advisor prior to taking any investment decision based on this report or for
any necessary explanation of its contents.
Most and it’s associates may have managed or co-managed public offering of securities, may have received compensation for investment banking or merchant banking or brokerage services, may have received any compensation
for products or services other than investment banking or merchant banking or brokerage services from the subject company in the past 12 months.
Most and it’s associates have not received any compensation or other benefits from the subject company or third party in connection with the research report.
Subject Company may have been a client of Most or its associates during twelve months preceding the date of distribution of the research report
MOSt and/or its affiliates and/or employees may have interests/positions, financial or otherwise of over 1 % at the end of the month immediately preceding the date of publication of the research in the securities mentioned in this
report. To enhance transparency, MOSt has incorporated a Disclosure of Interest Statement in this document. This should, however, not be treated as endorsement of the views expressed in the report.
Motilal Oswal Securities Limited is registered as a Research Analyst under SEBI (Research Analyst) Regulations, 2014. SEBI Reg. No. INH000000412
There are no material disciplinary action that been taken by any regulatory authority impacting equity research analysis activities
Disclosures
Analyst Certification
The views expressed in this research report accurately reflect the personal views of the analyst(s) about the subject securities or issues, and no part of the compensation of the research analyst(s) was, is, or will be directly or
indirectly related to the specific recommendations and views expressed by research analyst(s) in this report. The research analysts, strategists, or research associates principally responsible for preparation of MOSt research receive
compensation based upon various factors, including quality of research, investor client feedback, stock picking, competitive factors and firm revenues
Disclosure of Interest Statement
Analyst ownership of the stock
Served as an officer, director or employee
ALLCARGO LOGISTICS LTD
No
No
A graph of daily closing prices of securities is available at www.nseindia.com and http://economictimes.indiatimes.com/markets/stocks/stock-quotes
Regional Disclosures (outside India)
For U.S.
This report is not directed or intended for distribution to or use by any person or entity resident in a state, country or any jurisdiction, where such distribution, publication, availability or use would be contrary to law, regulation or which
would subject MOSt & its group companies to registration or licensing requirements within such jurisdictions.
Motilal Oswal Securities Limited (MOSL) is not a registered broker - dealer under the U.S. Securities Exchange Act of 1934, as amended (the"1934 act") and under applicable state laws in the United States. In addition MOSL is not a
registered investment adviser under the U.S. Investment Advisers Act of 1940, as amended (the "Advisers Act" and together with the 1934 Act, the "Acts), and under applicable state laws in the United States. Accordingly, in the
absence of specific exemption under the Acts, any brokerage and investment services provided by MOSL, including the products and services described herein are not available to or intended for U.S. persons.
This report is intended for distribution only to "Major Institutional Investors" as defined by Rule 15a-6(b)(4) of the Exchange Act and interpretations thereof by SEC (henceforth referred to as "major institutional investors"). This
document must not be acted on or relied on by persons who are not major institutional investors. Any investment or investment activity to which this document relates is only available to major institutional investors and will be
engaged in only with major institutional investors. In reliance on the exemption from registration provided by Rule 15a-6 of the U.S. Securities Exchange Act of 1934, as amended (the "Exchange Act") and interpretations thereof by
the U.S. Securities and Exchange Commission ("SEC") in order to conduct business with Institutional Investors based in the U.S., MOSL has entered into a chaperoning agreement with a U.S. registered broker-dealer, Motilal Oswal
Securities International Private Limited. ("MOSIPL"). Any business interaction pursuant to this report will have to be executed within the provisions of this chaperoning agreement.
The Research Analysts contributing to the report may not be registered /qualified as research analyst with FINRA. Such research analyst may not be associated persons of the U.S. registered broker-dealer, MOSIPL, and therefore,
may not be subject to NASD rule 2711 and NYSE Rule 472 restrictions on communication with a subject company, public appearances and trading securities held by a research analyst account.
For Singapore
Motilal Oswal Capital Markets Singapore Pte Limited is acting as an exempt financial advisor under section 23(1)(f) of the Financial Advisers Act(FAA) read with regulation 17(1)(d) of the Financial Advisors Regulations and is a
subsidiary of Motilal Oswal Securities Limited in India. This research is distributed in Singapore by Motilal Oswal Capital Markets Singapore Pte Limited and it is only directed in Singapore to accredited investors, as defined in the
Financial Advisers Regulations and the Securities and Futures Act (Chapter 289), as amended from time to time.
In respect of any matter arising from or in connection with the research you could contact the following representatives of Motilal Oswal Capital Markets Singapore Pte Limited:
Kadambari Balachandran
Email : kadambari.balachandran@motilaloswal.com
Contact : (+65) 68189233 / 65249115
Office Address : 21 (Suite 31),16 Collyer Quay,Singapore 04931
Motilal Oswal Tower, Level 9, Sayani Road, Prabhadevi, Mumbai 400 025
Phone: +91 22 3982 5500 E-mail: reports@motilaloswal.com
Motilal Oswal Securities Ltd
15 February 2016
10