15 February 2016
Q3FY16 Results Update | Sector: Others
Jain Irrigation
Buy
BSE SENSEX
23,554
Bloomberg
Equity Shares (m)
M.Cap.(INRb)/(USDb)
52-Week Range (INR)
1, 6, 12 Rel. Per (%)
Avg Val, INRm/ Vol m
Free float (%)
S&P CNX
7,163
JI IN
443.1
24.5 / 0.4
79 / 50
-9/-4/1
281
71.3
CMP: INR54
TP: INR68(+28%)
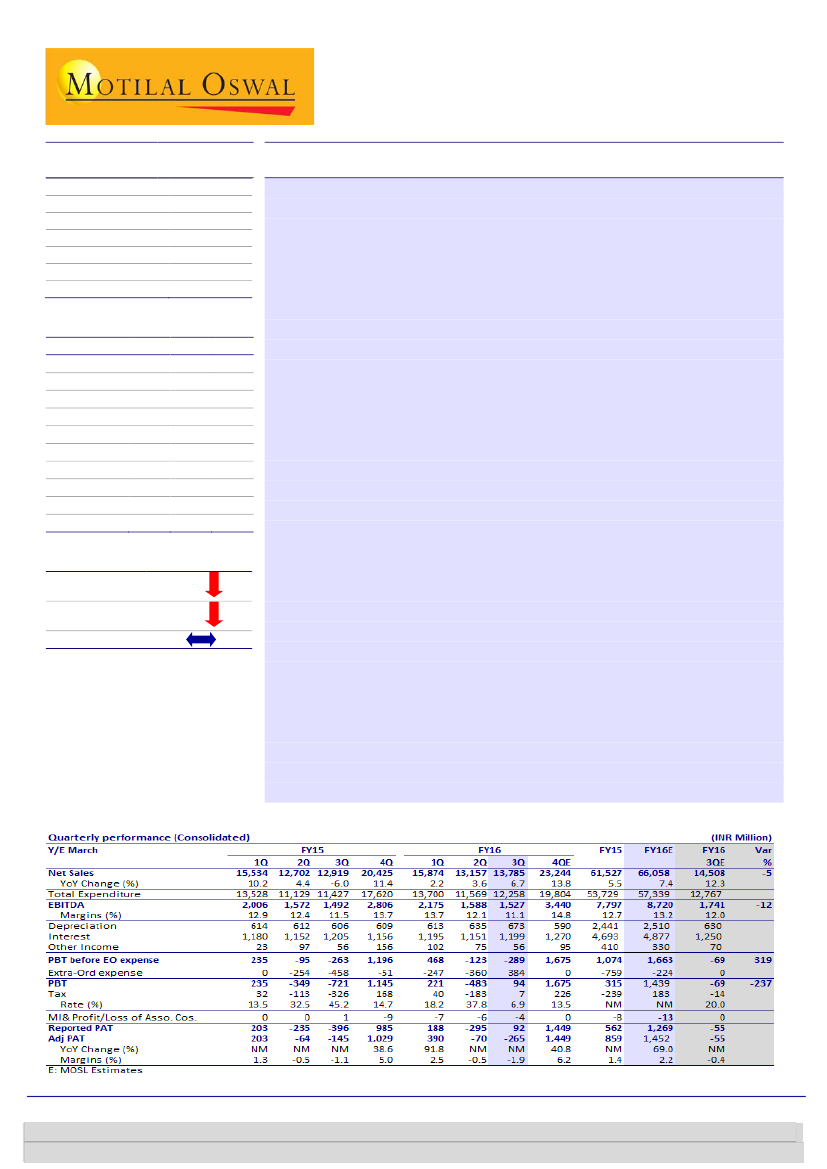
Results below estimates; de-leveraging on track
Results below estimates:
JI reported overall revenue of INR13.8b (est. of
INR14.5b), marking a 6.7% YoY growth. EBITDA stood at INR1.5b (est. of
INR1.7) in 3QFY16, with EBITDA margins at 11.1% (est. of 12%), a contraction of
40bp. During the quarter, forex gain stood at INR384m. Consequently, adjusted
PAT for the quarter stood at a loss of INR265m (est. a loss of INR55m) as
against a loss of INR145m in 3QFY15.
Growth led by overseas business:
Growth was led by exports which grew
11.3%. Contribution of overseas markets in consolidated revenue was at
50.5%. On a consolidated basis, MIS business grew 7.9% YoY, while food
processing grew 11.3% YoY and piping business grew 13.1% YoY. On a
standalone basis, MIS grew 6% where retail grew 14%, exports grew 9% while
projects business de-grew 21.7%. Projects business is generally lumpy and
newer contracts were still under negotiation. Piping business grew 12.8% led
by PE piping which grew 23.8%, food processing grew 1.6% led by onion
dehydration of 76.7% while fruit processing business de-grew 15.4%. Strong
growth in onion is due to base effect where onion as raw material was not
available last year. Margins in MIS business were sub-20%. The fund raising of
USD120m transaction is expected to completely by 4Q and should go towards
deleveraging.
3QFY16 sees food processing foray into B2C:
JI recently launched their first
branded retail product called “AamRus” under the brand name of “Jain
FarmFresh”. This was in-line with plans to enter the B2C business. JI has also
signed an MOU at the Make in India week with Hindustan Coca Cola Beverages
(HCCB) and Maharashtra government to partner for orange processing,
marking JI’s extension with HCCB into orange segment.
Valuation and view:
We expect 10.4% revenue CAGR, and 13% EBITDA CAGR
over FY15-18, translating into EPS growth from INR1.9 in FY15 to INR7.6 in
FY18. We cut our estimates by 11%/20%/23% for FY16/FY17/FY18 to factor in
lower topline growth and higher interest costs. Maintain
Buy
with a TP of
INR68, 9x FY18E EPS (rolled over to FY18).
Financials & Valuations (INR b)
2016E 2017E 2018E
Y/E Mar
66.1
73.7
82.7
Net Sales
8.7
10.0
11.2
EBITDA
1.5
2.8
3.9
PAT
3.1
5.4
7.6
EPS (INR)
69.0
73.0
39.6
Gr. (%)
65.5
64.0
70.7
BV/Sh (INR)
5.7
8.9
11.3
RoE (%)
10.3
12.0
13.4
RoCE (%)
17.0
9.8
7.1
P/E (x)
0.8
0.8
0.8
P/BV (x)
Estimate change
TP change
Rating change
-23%
-17%
Niket Shah
(Niket.Shah@MotilalOswal.com); +91 22 3982 5426
Chintan Modi
(Chintan.Modi@MotilalOswal.com); +912239825422/Kaustubh
Kale
(Kaustubh.Kale@MotilalOswal.com); +912230102498
Investors are advised to refer through important disclosures made at the last page of the Research Report.
Motilal Oswal research is available on www.motilaloswal.com/Institutional-Equities, Bloomberg, Thomson Reuters, Factset and S&P Capital.

Jain Irrigation
Results below estimates
JI reported overall revenue of INR13.8b (est. of INR14.5b), marking a 6.7% YoY
growth.
EBITDA stood at INR1.5b (est. of INR1.7) in 3QFY16, with EBITDA margins at
11.1% (est. of 12%), a contraction of 40bp.
During the quarter, forex gain stood at INR384m.
Consequently, adjusted PAT for the quarter stood at a loss of INR265m (est. a
loss of INR55m) as against a loss of INR145m in 3QFY15
Exhibit 1: Consolidated revenue trend (INR m)
Consolidated Revenue (INR m)
22.3
11.5
12,171 13,746
18,333
15,534 12,702
26.6
9.0
10.2
4.4
-6.0
12,919
2.2
11.4
3.6
6.7
Growth (YoY) %
14,094
20,425 15,874 13,157 13,785
Source: Company, MOSL
Exhibit 2: EBITDA trend (INR m)
EBITDA
14.8
Margins (%)
13.7
14.0 12.9
12.5 12.4
12.4 11.5
2,562
1,523 1,710
2,006
1,572 1,492
2,806
13.7
12.1 11.1
1,588 1,527
Exhibit 3: PAT trend (INR m)
PAT
-93.7 1.5
0.0
-51
364
Growth (%)
91.8
0.0
-1.5 NM
NM
38.6
390
1,029
-64 -145
0.0
0.0
2,086
2,175
263 742 203
-70 -265
Source: Company, MOSL
Growth led by overseas markets
Growth was led by exports which grew 11.3%. Contribution of overseas markets
in consolidated revenue was at 50.5%.
On a consolidated basis, MIS business grew 7.9% YoY, while food processing
grew 11.3% YoY and piping business grew 13.1% YoY.
On a standalone basis, MIS grew 6% where retail grew 14%, exports grew 9%
while projects business de-grew 21.7%. Projects business is generally lumpy and
newer contracts are still under negotiation. Exports business showed growth
bucking a de-growth trend since past few quarters.
Piping business grew 12.8% led by PE piping which grew 23.8%, food processing
grew 1.6% led by onion dehydration of 76.7% while fruit processing business de-
15 February 2016
2

Jain Irrigation
grew 15.4%. For piping business, there has been some realizations drop, so the
volume growth has been more than overall value growth. Strong growth in
onion is due to base effect where onion as raw material was not available last
year.
Margins in MIS business were sub-20%. Margins in piping and sheets have
improved due to benign raw material prices. EBITDA was impacted by benign
polymer prices, where some inventory write offs were done.
In case of retail MIS business, most of the states showed growth – Maharashtra,
Andhra Pradesh, Karnataka, Madhya Pradesh, Rajasthan. However there was
marginal de-growth in Gujarat and Tamil Nadu.
MIS business contribution by segment
Segment
Retail
Project
Export
Total
3QFY15
69%
19%
11%
100%
3QFY16
74%
14%
12%
100%
YoY
5%
-5%
0%
Exhibit 4: MIS business growth by segment
Segment
Retail
Project
Export
Total
3QFY15
2,527
707
414
3,648
3QFY16
2,878
554
451
3,883
YoY
14%
-22%
9%
6%
Source: Company, MOSL
Exhibit 5: Break-up of MIS receivables (INR b)
MIS -Receivables
Dealer and Institutional
Project
Govt. Subsidy
Export
Total
FY12
2.5
3.1
9.7
0.6
17.7
FY13
1.7
2.4
7.1
0.4
12.7
FY14
2.2
3.4
3.9
1.0
11.9
1QFY15
2.1
4.0
3.4
0.8
11.5
2QFY15
1.7
4.4
2.6
0.6
10.5
3QFY15
1.5
3.4
2.7
0.7
9.6
4QFY15
1.6
2.9
2.6
0.8
9.1
1QFY16
2.6
3.3
3.0
0.5
9.4
2QFY16
2.4
3.1
2.9
0.6
9.0
3QFY16
2.3
2.9
3.1
0.9
9.1
Source: Company, MOSL
Exhibit 6: MIS revenue trend
MIS revenue (INR M)
24.8
29.6
25.7
10.2
-10.5
Growth (YoY %)
Exhibit 7: MIS networking capital trend
Net Working Capital
255 235 255 245
217 205 194
185
16.5 17.2
296 317 306
3.8
5.1
-19.4
6.5
3,855
2,933
4,074 6,225 4,248 3,896 3,647 6,4624,465 3,140 3,884
Source: Company, MOSL
15 February 2016
3

Jain Irrigation
Exhibit 8: MIS debtors trend YoY
308
Debtor days (Gross)
279 265
257 243
211 197
188 187 187 188
Exhibit 9: MIS inventory days trend YoY
Inventory days
98
103 102 101
85
92
92
95
116 113 113
Source: Company, MOSL
Exhibit 10: PVC Piping revenue trend
36.5
PVC Pipes Revenue (INR m)
-8.3
-20.6
21.5
-11.1
1,323
1,757
Growth (YoY %)
12.2
Exhibit 11: Piping net working capital days negative
Net Working Capital
8
13
1.6
3,247
1,089
3.0
2,440 2,578
1.0
2,604
2.4
1,355
6
-11
1,862
-16
-7
-8
-20
-11
-1
-31
1,976
2,738
-16
Source: Company, MOSL
Exhibit 12: Piping inventory days trend
Inventory days
58
60
54
35
37
37
40
44
48
Exhibit 13: Piping receivable days trend
Debtor days (Gross)
67
42
41
58
39
61
90
70
69
72
51
44
49
Source: Company, MOSL
15 February 2016
4

Jain Irrigation
Exhibit 14: PE piping revenues trend (INR m)
PE Piping Revenue
197.7
95.9
-3.3
22.8
68.9
100.0
67.7
23.8
65
22
-17
19.1
-30.0 -39.2 -41.1
342 539 604 676 407 377 367 398 407 377 409
0.0
0
12
Growth (YoY %)
Exhibit 15: PVC Sheets revenues trend (INR m)
PVC Sheets revenue
117
Rev. YoY
-7.5 -55.4 -29.4
753
752 1,688 1,479 1,259 696
2,126 1,391 1,263 1,293
1,044
Source: Company, MOSL
Exhibit 16: Food processing revenue trend (INR m)
Fruit Processing revenue (INR m)
34
3
1,352
1,135
2,866 1,952
32
42
30
5
1,472
24
-3
3,554 1,892
1,655
17
2
1,496
Rev. YoY
28
1,376
1,418
Source: Company, MOSL
Exhibit 17: FP inventory days trend
Inventory days
345
315
286
190
264 276 246
157
263 251
234
Exhibit 18: FP receivable days trend
Debtor days (Gross)
133
66
66
88
48
87
102
98
118 122 126
Source: Company, MOSL
15 February 2016
5

Jain Irrigation
Exhibit 19: FP net working capital days trend
Net Working Capital
195
226
236
197
279
251
162
155
176
135
78
1QFY14 2QFY14 3QFY14 4QFY14 1QFY15 2QFY15 3QFY15 4QFY15 1QFY16 2QFY16 3QFY16
Source: Company, MOSL
Exhibit 20: C/L inventory days trend
Inventory days
345
315
286
190
264 276 246
157
263 251
234
Exhibit 21: C/L receivable days trend
Debtor days (Gross)
133
66
66
88
48
87
102
98
118 122 126
Source: Company, MOSL
Exhibit 22: C/L net working capital days trend
Net Working Capital
226
195
176
135
78
236
197
251
279
162
155
1QFY14 2QFY14 3QFY14 4QFY14 1QFY15 2QFY15 3QFY15 4QFY15 1QFY16 2QFY16 3QFY16
Source: Company, MOSL
Launches its first B2C product ‘Aamrus’ in 3QFY16
JI launched their first branded retail product called “AamRus” under the brand
name of “Jain FarmFresh”. AamRus is a sweetened frozen mango pulp, with no
added colours, flavours or preservatives, making it a 100% natural product.
The launch is in-line with company’s plans to enter the B2C segment as
highlighted in past.
15 February 2016
6

Jain Irrigation
This is the first retail product catering to end consumer from bouquet of retail
products in the processed fruits, vegetables and spices categories coming up in
the future.
AamRus is available in Hypercity and Sahkari Bhandaar Stores in Mumbai and is
expanding rapidly in general and modern trade segments. Product is expected
to be available across Mumbai by 4QFY16.
Company plans to expand to rest of Maharashtra, Gujarat, MP and other states
in western and northern India within 6 months.
Jain Irrigation at the ‘Make in India Week’ signed an MOU with Hindustan Coco
Cola Beverages (HCCB) and Maharashtra government to partner in setting up an
integrated horticulture project in Vidarbha region of Maharashtra. The project
envisages setting up of an orange processing plant, marking JI’s extension of
partnership with HCCB into the orange segment. This food park shall take a year
to setup and is estimated to have a capex of close to INR1b .
De-leveraging on track; fund raising transaction to be complete by 4QFY16
The fund raising of USD120m transaction is expected to completely by 4Q and
should go towards deleveraging the balance sheet.
The transaction is currently awaiting CCI clearance, which should happen in the
next few weeks, following which the transaction formalities and capitalization
should be done by 4QFY16.
Management pointed out that majority of the funds raised will be utilized to
reduce debt.
32% of net debt (standalone) and 49% of net debt (consolidated) was in foreign
currency as at 3QFY16, which has also impacted the increase of debt.
We expect net debt to equity of 0.7x by FY18.
Exhibit 24: Consolidated net debt
Consolidated Net Debt (INR b)
31.45
28.6
29.19
32.58
41.9 42
40.1
38.9
39.8
42.4 42.9
39.3
40.21
42.68
43.57
Exhibit 23: Standalone net debt
Standalone Net Debt (INR b)
30.8 31.1
29.4
28.2
31.6 31.7
29.9
Source: Company, MOSL
15 February 2016
7

Jain Irrigation
Exhibit 25: Debt Equity to decline from 1.8x in FY15 to 0.7x in FY17
Net Debt (INR m)
2.0
1.8
1.8
0.9
34,442
35,654
38,601
38,647
28,639
25,022
FY12
FY13
FY14
FY15
FY16E
FY17E
0.8
0.7
23,782
FY18E
Net DER (x)
1.6
Source: Company, MOSL
Other highlights from conference call
Management highlighted that 4Q is generally the strongest quarter and expects
4QFY16 also to show good growth considering the order book. They highlighted
that there is a fair chance FY16 shall have a double digit growth overall.
Management expects Union Budget to be positive for agriculture, given the
government focus on micro irrigation.
Management expects Company not to be under full tax in current year and shall
pay under MAT.
We value JI at a multiple of 9x FY18E EPS (rolled over to FY18) which we believe is
justified considering:
Valuation and view
India’s largest MIS player with a dominant market share of 55%
JI is the largest player in India's organized micro irrigation sector, with a dominant
market share of 55% and much higher than the second largest player Netafim (20%
market share). There remains immense potential for micro irrigation in India as out
of total irrigation potential of ~140 Mha and MIS potential of ~69.5 Mha, only 5 Mha
(~3.5% of the total irrigation potential) is covered under MIS currently, implying
significant growth potential over the long term. JI with its dominant market
leadership is best placed to capture this growth potential.
Change in business model to drive de-leveraging
JI has changed its business model to ensure that the company is not exposed to
payment delays associated with subsidy receivables. Management is targeting to
reduce gross receivable days to 130 in FY16 which should ensure annual debt
reduction due to better working capital management. The company is also raising
INR8b - INR4b food processing stake sale and INR4b dilution at parent level, majority
proceeds of which would go towards further debt retirement. As a result, we expect
net debt to equity ratio to reduce to 0.7x in FY18 from 1.8x in FY15
Strong leadership in the high-growth food processing business
JI is India’s largest player in the food processing sector, with a market share of ~30%
and is the third largest in the world. Only 2% of India’s total produce is processed,
compared to ~60-80% in some developed countries (80% US and Malaysia). Also,
15 February 2016
8

Jain Irrigation
India's share in the global food trade is a miniscule 1.5%. Given the growing demand
for processed food, due to lifestyle changes and storage advantages, the segment is
expected to be a strong growth driver for the company.
Exhibit 26: 15-year PE band
65
52
4.5
39
26
13
0
26.5
21.5
Negative
Earnings
Cycle
32.4
3.0
1.5
10.2
0.0
2.8
2.2
1.8
0.8
P/E (x)
5 Yrs Avg(x)
15 Yrs Avg(x)
10 Yrs Avg(x)
Exhibit 27: 15-year PB band
P/B (x)
15 Yrs Avg(x)
10 Yrs Avg(x)
6.0
5 Yrs Avg(x)
Source: Company, MOSL
We value the stock at 9x FY18E EPS and arrive at a target price of INR68 – 28%
upside. Maintain
Buy
rating.
15 February 2016
9

Jain Irrigation
Story in charts
Exhibit 28: JI is the market leader in MIS business in India
Market share of key players in micro irrigation systems in India
55%
Exhibit 29: MIS penetration in India is lowest in world
90%
MIS penetration across countries (%)
78%
65%
55%
52%
20%
25%
10%
Israel
Russia
Spain
US
Brazil
China
3%
India
Jain Irrigation
Netafim
Others
Source: Company, MOSL
Exhibit 30: Gross debtors set to decline
Gross Sundry Debtors
369
343
334
257
188
155
140
120
Exhibit 31: Hence, debt to equity to decline from 1.8x to
0.7x
Net Debt (INR m)
2.0
1.8
1.8
0.9
34,442 35,654 38,601 38,647
28,639
25,022
0.8
0.7
23,782
FY18E
Net DER (x)
1.6
FY11
FY12
FY13
FY14
FY15
FY16E FY17E FY18E
Source: Company, MOSL
FY12
FY13
FY14
FY15
FY16E
FY17E
Source: Company, MOSL
Exhibit 32: Food processing is another key opportunity for JI
% of food processing
80%
80%
70%
Exhibit 33: RoE to improve
13.5
RoE (%)
11.3
8.9
30%
2%
USA
Malaysia
France
Thailand
India
FY12
FY13
FY14
FY15
2.4
3.1
4.0
5.7
Source: Company, MOSL
FY16E
FY17E
FY18E
Source: Company, MOSL
15 February 2016
10

Jain Irrigation
Key assumptions
Exhibit 34: Key assumptions
Assumptions
1. Micro Irrigation Systems
% growth (YoY)
% of net sales
2. Plastic Piping Systems
% growth (YoY)
% of net sales
3. Agro Processing
% growth (YoY)
% of net sales
4. Others
% growth (YoY)
% of net sales
5. Net Subsidiary Sales
% growth (YoY)
% of net sales
Total Gross Sales
Less: Excise Duty
Net Sales
% growth (YoY)
FY13
14,040
-26%
27%
11,157
13%
22%
5,399
4%
11%
3,039
35%
6%
16,156
33%
31%
51,334
1,117
50,217
2%
FY14
17,087
22%
29%
13,929
25%
23%
6,729
25%
11%
2,675
-12%
4%
17,277
7%
29%
59,859
1,578
58,281
16%
FY15
18,158
6%
29%
13,015
-7%
21%
8,397
25%
13%
2,465
-8%
4%
19,562
13%
31%
63,147
1,566
61,581
6%
FY16E
18,975
4%
28%
15,070
16%
22%
9,348
11%
14%
2,792
13%
4%
19,953
2%
29%
67,738
1,680
66,058
7%
FY17E
20,114
6%
27%
16,447
9%
22%
10,679
14%
14%
3,646
31%
5%
22,946
15%
30%
75,546
1,874
73,672
12%
FY18E
21,522
7%
25%
18,118
10%
21%
12,405
16%
15%
4,572
25%
5%
26,388
15%
31%
84,841
2,104
82,737
12%
Source: Company, MOSL
15 February 2016
11

Jain Irrigation
Financials and Valuations
Income Statement
Y/E Mar
Net Sales
Change (%)
EBITDA
EBITDA Margin (%)
Depreciation
EBIT
Interest
Other Income
Extraordinary items
PBT
Tax
Tax Rate (%)
Min. Int. & Assoc. Share
Reported PAT
Adjusted PAT
Change (%)
2011
41,528
21.4
7,480
18.0
1,222
6,258
3,270
1,106
0
4,094
1,213
29.6
74
2,807
2,807
13.8
2011
772
14,787
15,558
29,842
662
46,586
28,467
8,050
20,417
956
211
41,396
14,864
16,924
4,144
5,463
16,394
15,674
720
25,002
46,586
2012
49,206
18.5
8,155
16.6
1,441
6,714
4,768
345
0
2,290
4
0.2
51
2,235
2,235
-20.4
2012
810
16,726
17,537
37,986
1,037
57,057
33,528
9,793
23,735
1,980
236
48,180
14,614
22,712
3,308
7,546
17,073
16,365
708
31,107
57,057
2013
50,217
2.1
7,253
14.4
1,696
5,558
4,855
668
-1,245
125
80
63.9
14
31
480
-78.5
2013
910
20,770
21,680
38,051
912
60,643
37,726
11,640
26,086
749
38
50,405
17,231
19,547
2,359
11,269
16,636
16,095
541
33,770
60,643
2014
58,281
16.1
7,700
13.2
2,045
5,654
4,676
463
-2,300
-860
-462
53.7
0
-398
667
38.9
2014
925
20,831
21,755
40,583
217
62,761
41,514
13,742
27,771
807
14
52,258
18,364
17,994
1,968
13,932
18,089
17,473
617
34,169
62,761
2015
61,527
5.6
7,797
12.7
2,441
5,357
4,693
410
-767
306
-239
-78.0
-8
554
867
30.1
2015
925
20,474
21,399
42,309
-157
63,551
43,664
16,057
27,607
526
621
53,687
18,566
19,541
3,041
12,539
18,890
18,274
616
34,797
63,551
2016E
66,058
7.4
8,720
13.2
2,510
6,210
4,877
330
-224
1,439
183
12.7
-13
1,269
1,465
68.9
2016E
925
29,385
30,310
33,309
-157
63,462
45,964
18,566
27,398
0
621
54,954
19,496
19,645
4,049
11,764
19,510
18,901
609
35,443
63,462
2017E
73,672
11.5
9,980
13.5
2,638
7,342
4,219
354
0
3,476
695
20.0
-16
2,796
2,796
90.9
2017E
1,024
31,750
32,774
32,109
-157
64,726
48,264
21,205
27,059
0
621
59,487
21,886
20,033
6,466
11,101
22,442
21,609
833
37,046
64,726
(INR Million)
2018E
82,737
12.3
11,208
13.5
2,767
8,441
3,970
381
0
4,851
970
20.0
-19
3,900
3,900
39.5
Balance Sheet
Y/E Mar
Share Capital
Reserves
Net Worth
Debt
Deferred Tax
Total Capital Employed
Gross Fixed Assets
Less: Acc Depreciation
Net Fixed Assets
Capital WIP
Investments
Current Assets
Inventory
Debtors
Cash & Bank
Loans & Adv, Others
Curr Liabs & Provns
Curr. Liabilities
Provisions
Net Current Assets
Total Assets
(INR Million)
2018E
1,024
35,157
36,181
30,909
-157
66,932
50,564
23,972
26,592
0
621
65,233
24,915
21,345
6,506
12,467
25,513
24,537
976
39,720
66,933
15 February 2016
12

Jain Irrigation
Financials and Valuations
Ratios
Y/E Mar
Basic (INR)
EPS
Cash EPS
Book Value
DPS
Payout (incl. Div. Tax.)
Valuation(x)
P/E
Cash P/E
Price / Book Value
EV/Sales
EV/EBITDA
Dividend Yield (%)
Profitability Ratios (%)
RoE
RoCE
Turnover Ratios (%)
Asset Turnover (x)
Debtors (No. of Days)
Inventory (No. of Days)
Creditors (No. of Days)
Leverage Ratios (%)
Net Debt/Equity (x)
2011
7.5
10.6
40.3
1.0
15.6
7.2
5.0
1.3
1.3
7.1
1.8
20.2
18.0
0.9
149
131
112
1.6
2011
7,480
695
-6,069
-1,047
0
1,059
-4,930
-3,871
-140
63
-5,007
780
5,507
-2,717
-418
3,153
-796
4,940
4,144
2012
5.6
9.2
43.3
1.0
20.6
9.5
5.8
1.2
1.3
7.6
1.9
13.5
14.0
0.9
168
108
102
2.0
2012
8,155
-201
-6,166
-938
0
850
-5,270
-4,420
-114
55
-5,330
14
8,143
-4,051
-432
3,674
-805
4,114
3,308
2013
1.1
4.8
47.7
0.6
588.3
49.2
11.1
1.1
1.3
8.7
1.0
2.4
10.8
0.8
142
125
97
1.6
2013
7,253
444
-3,127
-295
0
4,275
-2,943
1,333
-104
-336
-3,383
3,903
-586
-4,843
-307
-1,832
-939
3,298
2,359
2014
1.4
5.9
47.0
0.6
-68.0
37.1
9.1
1.1
1.1
8.6
1.1
3.1
10.0
0.9
113
115
84
1.8
2014
7,700
-377
-1,551
-41
0
5,731
-2,615
3,116
-408
139
-2,885
0
1,216
-4,638
220
-3,202
-356
2,324
1,968
2015
1.9
7.1
46.3
0.6
50.2
28.8
7.5
1.2
1.1
8.5
1.1
4.0
9.1
0.9
116
110
80
1.8
2015
7,797
-46
-868
-271
0
6,613
-2,093
4,520
-385
189
-2,288
0
1,656
-4,641
-623
-3,608
717
2,324
3,041
2016E
3.1
8.6
65.5
0.6
22.1
17.0
6.2
0.8
0.9
6.5
1.1
5.7
10.3
1.0
109
108
89
0.9
2016E
8,720
-224
361
-183
0
8,674
-1,774
6,900
0
330
-1,444
7,920
-9,000
-4,877
-265
-6,223
1,008
3,041
4,049
2017E
5.4
10.6
64.0
0.9
15.5
9.8
5.1
0.8
0.7
5.3
1.7
8.9
12.0
1.1
99
108
92
0.8
2017E
9,980
0
815
-695
0
10,100
-2,300
7,800
0
354
-1,946
99
-1,200
-4,219
-416
-5,736
2,417
4,049
6,466
2018E
7.6
13.0
70.7
1.0
12.7
7.1
4.1
0.8
0.6
4.6
1.9
11.3
13.4
1.2
94
110
93
0.7
Cash Flow Statement
Y/E Mar
Adjusted EBITDA
Non cash opr. exp (inc)
(Inc)/Dec in Wkg. Cap.
Tax Paid
Other operating activities
CF from Op. Activity
(Inc)/Dec in FA & CWIP
Free cash flows
(Pur)/Sale of Invt
Others
CF from Inv. Activity
Inc/(Dec) in Net Worth
Inc / (Dec) in Debt
Interest Paid
Divd Paid (incl Tax) & Others
CF from Fin. Activity
Inc/(Dec) in Cash
Add: Opening Balance
Closing Balance
(INR Million)
2018E
11,208
0
-2,635
-970
0
7,603
-2,300
5,303
0
381
-1,919
0
-1,200
-3,970
-474
-5,644
39
6,466
6,506
15 February 2016
13

Jain Irrigation
Corporate profile
Established in 1986, JI is a transnational organization
headquartered at Jalgaon, Maharashtra, India. JI employs
over 5,000 associates and manufactures a number of
products, including drip and sprinkler irrigation systems,
PVC & PE piping systems, plastic sheets, green houses,
bio-fertilizers, solar products including water-heating
systems, photovoltaic appliances and solar pumps. JI
processes fruits and vegetables into aseptic concentrates,
frozen fruits and dehydrated vegetables, respectively. It
has 21 manufacturing plants spread over 5 continents and
its products are supplied to 110 countries through 3,000
dealers and distributors worldwide.
Exhibit 2: Shareholding pattern (%)
Promoter
DII
FII
Others
Sep-15
28.7
2.5
37.8
31.0
Jun-15
28.7
2.0
41.6
27.7
Sep-14
28.7
3.3
48.0
20.1
Company description
Exhibit 1: Sensex rebased
Source: MOSL/Bloomberg
Exhibit 3: Top holders
Holder Name
MKCP Institutional Investor (Mauritius) II Ltd
International Finance Corporation
Templeton Funds -Templeton Foreign Fund
Macquarie Bank Ltd
Calvert Impact Fund Inc-Calvert Global
Water Fund
% Holding
7.9
3.0
2.7
2.3
2.0
Source: Capitaline
Note: FII Includes depository receipts
Source: Capitaline
Exhibit 4: Top management
Name
Bhavarlal H Jain
Ashok B Jain
Anil B Jain
Ajit B jain
Atul Bhavarlal Jain
A V Ghodgaonkar
Designation
Chairman
Vice Chairman
Managing Director
Joint Managing Director
Company Secretary
Exhibit 5: Directors
Name
Arun Kumar Jain
Ghanshyam Dass
Radhika C Pereira
R Swaminathan
Name
D R Mehta
H P Singh
Vasant V Warty
Source: Capitaline
Exhibit 6: Auditors
Name
Haribhakti & Co
V Laxman & Co
Type
Statutory
Secretarial Audit
Exhibit 7: MOSL forecast v/s consensus
EPS
(INR)
FY16
FY17
FY18
MOSL
forecast
4.8
6.9
9.9
Consensus
forecast
3.2
5.9
8.4
Variation (%)
49.5
16.2
18.2
Source: Bloomberg
Source: Capitaline
15 February 2016
14

Jain Irrigation
NOTES
15 February 2016
15

Disclosures
This document has been prepared by Motilal Oswal Securities Limited (hereinafter referred to as Most) to provide information about the company(ies) and/sector(s), if any, covered in the report and may be distributed by it and/or its
Jain Irrigation
affiliated company(ies). This report is for personal information of the selected recipient/s and does not construe to be any investment, legal or taxation advice to you. This research report does not constitute an offer, invitation or
inducement to invest in securities or other investments and Motilal Oswal Securities Limited (hereinafter referred as MOSt) is not soliciting any action based upon it. This report is not for public distribution and has been furnished to
you solely for your general information and should not be reproduced or redistributed to any other person in any form. This report does not constitute a personal recommendation or take into account the particular investment
objectives, financial situations, or needs of individual clients. Before acting on any advice or recommendation in this material, investors should consider whether it is suitable for their particular circumstances and, if necessary, seek
professional advice. The price and value of the investments referred to in this material and the income from them may go down as well as up, and investors may realize losses on any investments. Past performance is not a guide for
future performance, future returns are not guaranteed and a loss of original capital may occur.
MOSt and its affiliates are a full-service, integrated investment banking, investment management, brokerage and financing group. We and our affiliates have investment banking and other business relationships with a some
companies covered by our Research Department. Our research professionals may provide input into our investment banking and other business selection processes. Investors should assume that MOSt and/or its affiliates are
seeking or will seek investment banking or other business from the company or companies that are the subject of this material and that the research professionals who were involved in preparing this material may educate investors
on investments in such business . The research professionals responsible for the preparation of this document may interact with trading desk personnel, sales personnel and other parties for the purpose of gathering, applying and
interpreting information. Our research professionals are paid on twin parameters of performance & profitability of MOSt.
MOSt generally prohibits its analysts, persons reporting to analysts, and members of their households from maintaining a financial interest in the securities or derivatives of any companies that the analysts cover. Additionally, MOSt
generally prohibits its analysts and persons reporting to analysts from serving as an officer, director, or advisory board member of any companies that the analysts cover. Our salespeople, traders, and other professionals or affiliates
may provide oral or written market commentary or trading strategies to our clients that reflect opinions that are contrary to the opinions expressed herein, and our proprietary trading and investing businesses may make investment
decisions that are inconsistent with the recommendations expressed herein. In reviewing these materials, you should be aware that any or all of the foregoing among other things, may give rise to real or potential conflicts of interest.
MOSt and its affiliated company(ies), their directors and employees and their relatives may; (a) from time to time, have a long or short position in, act as principal in, and buy or sell the securities or derivatives thereof of companies
mentioned herein. (b) be engaged in any other transaction involving such securities and earn brokerage or other compensation or act as a market maker in the financial instruments of the company(ies) discussed herein or act as an
advisor or lender/borrower to such company(ies) or may have any other potential conflict of interests with respect to any recommendation and other related information and opinions.; however the same shall have no bearing
whatsoever on the specific recommendations made by the analyst(s), as the recommendations made by the analyst(s) are completely independent of the views of the affiliates of MOSt even though there might exist an inherent
conflict of interest in some of the stocks mentioned in the research report .Reports based on technical and derivative analysis center on studying charts company's price movement, outstanding positions and trading volume, as
opposed to focusing on a company's fundamentals and, as such, may not match with a report on a company's fundamental analysis. In addition MOST has different business segments / Divisions with independent research
separated by Chinese walls catering to different set of customers having various objectives, risk profiles, investment horizon, etc, and therefore may at times have different contrary views on stocks sectors and markets.
Unauthorized disclosure, use, dissemination or copying (either whole or partial) of this information, is prohibited. The person accessing this information specifically agrees to exempt MOSt or any of its affiliates or employees from,
any and all responsibility/liability arising from such misuse and agrees not to hold MOSt or any of its affiliates or employees responsible for any such misuse and further agrees to hold MOSt or any of its affiliates or employees free
and harmless from all losses, costs, damages, expenses that may be suffered by the person accessing this information due to any errors and delays. The information contained herein is based on publicly available data or other
sources believed to be reliable. Any statements contained in this report attributed to a third party represent MOSt’s interpretation of the data, information and/or opinions provided by that third party either publicly or through a
subscription service, and such use and interpretation have not been reviewed by the third party. This Report is not intended to be a complete statement or summary of the securities, markets or developments referred to in the
document. While we would endeavor to update the information herein on reasonable basis, MOSt and/or its affiliates are under no obligation to update the information. Also there may be regulatory, compliance, or other reasons that
may prevent MOSt and/or its affiliates from doing so. MOSt or any of its affiliates or employees shall not be in any way responsible and liable for any loss or damage that may arise to any person from any inadvertent error in the
information contained in this report. MOSt or any of its affiliates or employees do not provide, at any time, any express or implied warranty of any kind, regarding any matter pertaining to this report, including without limitation the
implied warranties of merchantability, fitness for a particular purpose, and non-infringement. The recipients of this report should rely on their own investigations.
This report is intended for distribution to institutional investors. Recipients who are not institutional investors should seek advice of their independent financial advisor prior to taking any investment decision based on this report or for
any necessary explanation of its contents.
Most and it’s associates may have managed or co-managed public offering of securities, may have received compensation for investment banking or merchant banking or brokerage services, may have received any compensation
for products or services other than investment banking or merchant banking or brokerage services from the subject company in the past 12 months.
Most and it’s associates have not received any compensation or other benefits from the subject company or third party in connection with the research report.
Subject Company may have been a client of Most or its associates during twelve months preceding the date of distribution of the research report
MOSt and/or its affiliates and/or employees may have interests/positions, financial or otherwise of over 1 % at the end of the month immediately preceding the date of publication of the research in the securities mentioned in this
report. To enhance transparency, MOSt has incorporated a Disclosure of Interest Statement in this document. This should, however, not be treated as endorsement of the views expressed in the report.
Motilal Oswal Securities Limited is registered as a Research Analyst under SEBI (Research Analyst) Regulations, 2014. SEBI Reg. No. INH000000412
There are no material disciplinary action that been taken by any regulatory authority impacting equity research analysis activities
Analyst Certification
The views expressed in this research report accurately reflect the personal views of the analyst(s) about the subject securities or issues, and no part of the compensation of the research analyst(s) was, is, or will be directly or
indirectly related to the specific recommendations and views expressed by research analyst(s) in this report. The research analysts, strategists, or research associates principally responsible for preparation of MOSt research receive
compensation based upon various factors, including quality of research, investor client feedback, stock picking, competitive factors and firm revenues
Disclosure of Interest Statement
Analyst ownership of the stock
Served as an officer, director or employee
JAIN IRRIGATION SYSTEMS LTD
No
No
A graph of daily closing prices of securities is available at www.nseindia.com and http://economictimes.indiatimes.com/markets/stocks/stock-quotes
Regional Disclosures (outside India)
For U.S.
This report is not directed or intended for distribution to or use by any person or entity resident in a state, country or any jurisdiction, where such distribution, publication, availability or use would be contrary to law, regulation or which
would subject MOSt & its group companies to registration or licensing requirements within such jurisdictions.
Motilal Oswal Securities Limited (MOSL) is not a registered broker - dealer under the U.S. Securities Exchange Act of 1934, as amended (the"1934 act") and under applicable state laws in the United States. In addition MOSL is not a
registered investment adviser under the U.S. Investment Advisers Act of 1940, as amended (the "Advisers Act" and together with the 1934 Act, the "Acts), and under applicable state laws in the United States. Accordingly, in the
absence of specific exemption under the Acts, any brokerage and investment services provided by MOSL, including the products and services described herein are not available to or intended for U.S. persons.
This report is intended for distribution only to "Major Institutional Investors" as defined by Rule 15a-6(b)(4) of the Exchange Act and interpretations thereof by SEC (henceforth referred to as "major institutional investors"). This
document must not be acted on or relied on by persons who are not major institutional investors. Any investment or investment activity to which this document relates is only available to major institutional investors and will be
engaged in only with major institutional investors. In reliance on the exemption from registration provided by Rule 15a-6 of the U.S. Securities Exchange Act of 1934, as amended (the "Exchange Act") and interpretations thereof by
the U.S. Securities and Exchange Commission ("SEC") in order to conduct business with Institutional Investors based in the U.S., MOSL has entered into a chaperoning agreement with a U.S. registered broker-dealer, Motilal Oswal
Securities International Private Limited. ("MOSIPL"). Any business interaction pursuant to this report will have to be executed within the provisions of this chaperoning agreement.
The Research Analysts contributing to the report may not be registered /qualified as research analyst with FINRA. Such research analyst may not be associated persons of the U.S. registered broker-dealer, MOSIPL, and therefore,
may not be subject to NASD rule 2711 and NYSE Rule 472 restrictions on communication with a subject company, public appearances and trading securities held by a research analyst account.
For Singapore
Motilal Oswal Capital Markets Singapore Pte Limited is acting as an exempt financial advisor under section 23(1)(f) of the Financial Advisers Act(FAA) read with regulation 17(1)(d) of the Financial Advisors Regulations and is a
subsidiary of Motilal Oswal Securities Limited in India. This research is distributed in Singapore by Motilal Oswal Capital Markets Singapore Pte Limited and it is only directed in Singapore to accredited investors, as defined in the
Financial Advisers Regulations and the Securities and Futures Act (Chapter 289), as amended from time to time.
In respect of any matter arising from or in connection with the research you could contact the following representatives of Motilal Oswal Capital Markets Singapore Pte Limited:
Kadambari Balachandran
Email : kadambari.balachandran@motilaloswal.com
Contact : (+65) 68189233 / 65249115
Office Address : 21 (Suite 31),16 Collyer Quay,Singapore 04931
Motilal Oswal Tower, Level 9, Sayani Road, Prabhadevi, Mumbai 400 025
Phone: +91 22 3982 5500 E-mail: reports@motilaloswal.com
Motilal Oswal Securities Ltd
15 February 2016
16