16 February 2016
Q3FY16 Results Update | Sector: Fertilizers
PI Industries
Buy
BSE SENSEX
23,192
Bloomberg
Equity Shares (m)
M.Cap.(INRb)/(USDb)
52-Week Range (INR)
1, 6, 12 Rel. Per (%)
Avg Val, (INR m)
Free float (%)
S&P CNX
7,048
PI IN
137.1
79 / 1.2
786/552
-7/0/23
160
41.6
CMP: INR576
TP: INR755 (+31%)
Levers intact; Growth momentum to continue
Financials & Valuations (INR b)
Y/E Mar
2016E 2017E 2018E
21.2
26.1
31.6
Net Sales
4.4
5.6
7.0
EBITDA
2.9
3.7
4.7
PAT
21.0
26.9
34.3
EPS (INR)
16.9
28.0
27.5
Gr. (%)
82.4 103.9 131.5
BV/Sh (INR)
28.4
28.9
29.2
RoE (%)
36.4
38.5
40.5
RoCE (%)
27.3
21.3
16.7
P/E (x)
7.0
5.5
4.4
P/BV (x)
Estimate change
TP change
Rating change
3%
6%
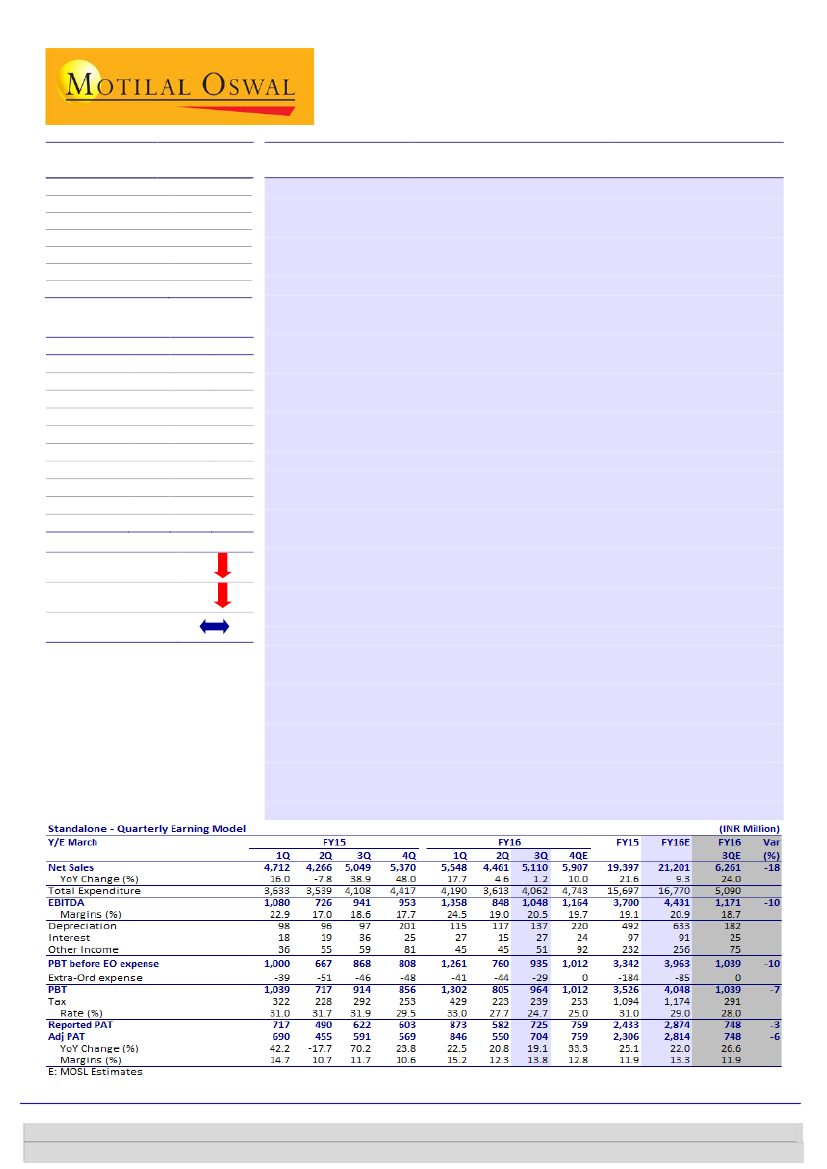
Revenue growth below estimate:
PI reported overall revenue of INR5,110m (est.
INR6,261m) in 3QFY16, a 1.2% YoY growth led by CSM business which grew 9%
while agri business de-grew 13% due to lower acreages in rabi. CSM business
showed moderate performance due to deferred procurement schedules from
global customers on account of higher inventory at customer end, impacting
geographies like USA, Brazil and Australia.
EBITDA margin expands 190bp:
EBITDA margin expanded 190bp to 20.5% (est.
18.7%), led by better mix of revenues as share of high margin CSM increased to
72% in 3QFY16 from 68% in 3QFY15 also aided by better product mix and cost
efficiencies. EBITDA stood at INR1,048m (est. INR1,171m), up 11.4% YoY. Tax rate
was lower at 24.7% (31.9% in 3QFY15) due to tax benefits on account of Jambusar
facility. Adj. PAT grew 19% to INR704m (est. INR748m) in 3QFY16.
CSM order book grows 28% QoQ:
Order book stood at USD780m, growing 28%
QoQ from USD610m in 3QFY16. Management highlighted that the same is
executable over next 3-4 years. The increase in order book was from both existing
as well as newer molecules. Jambusar Phase III began operations in Jan 2016 and
thus both Phase II and III are now operational (income tax exempt for first 5 years);
coupled with commercialization of 1-2 molecules every year, and execution of
order book should drive CSM revenue going ahead. PI launched Bio Vita X and
Vibrant (addressable market of INR13b) during the quarter which shall keep
momentum for domestic business going forward. Recently launched products
currently contribute ~15% of revenues, signifying growth potential for ramp up.
Management highlighted that Nominee Gold should continue to post strong
growth since opportunity is huge while penetration is 10% (as against potential for
30%), also dynamics for rice are still favorable as compared to corn and cotton.
Valuation and view:
We cut our estimates by 4.5%/5.2%/3.2% for FY16/FY17/FY18
to factor in back-ended recovery in CSM and agro. With best-in-class capital
efficiency (40% RoCE), insignificant debt-to-equity and robust growth outlook (18%
revenue CAGR and 24% PAT CAGR), we believe PI is one of the best plays on India’s
agri sector and CSM opportunities. We believe mix change in favor of the R&D-
intensive CSM business would continue to drive rerating for the stock. We maintain
Buy
rating with a target price of INR755, 22x FY18E EPS (rolled over to FY18).
Niket Shah
(Niket.Shah@MotilalOswal.com); +91 22 3982 5426
Chintan Modi
(Chintan.Modi@MotilalOswal.com); +912239825422/Kaustubh
Kale
(Kaustubh.Kale@MotilalOswal.com); +912230102498
Investors are advised to refer through important disclosures made at the last page of the Research Report.
Motilal Oswal research is available on www.motilaloswal.com/Institutional-Equities, Bloomberg, Thomson Reuters, Factset and S&P Capital.

PI Industries
Revenues impacted by moderate CSM performance
PI reported overall revenue of INR5,110m (est. INR6,261m) in 3QFY16, a 1.2%
YoY growth led by CSM business which grew 9% while agri business de-grew
13% due to lower acreages in rabi.
CSM business showed moderate performance due to deferred procurement
schedules from global customers on account of higher inventory at customer
end, impacting geographies like USA, Brazil and Australia.
Exhibit 1: Revenue growth trend
70%
55%
29%
10%
4,061
4,628
3,634
3,627
16%
-8%
4,712
4,266
5,049
5,370
5,548
4,461
39%
Revenues (INR m)
Growth (%)
48%
18%
5%
1%
5,110
1QFY14 2QFY14 3QFY14 4QFY14 1QFY15 2QFY15 3QFY15 4QFY15 1QFY16 2QFY16 3QFY16
Source: Company, MOSL
Exhibit 2: CSM growth trend
119%
133%
CSM Revenues (INR m)
Growth (%)
34%
4%
2,080
2,442
2,345
2,350
8%
-14%
2,250
2,110
44%
55%
26%
0%
8%
3,660
3,380
3,650
2,842
2,110
1QFY14 2QFY14 3QFY14 4QFY14 1QFY15 2QFY15 3QFY15 4QFY15 1QFY16 2QFY16 3QFY16
Source: Company, MOSL
Exhibit 3: Domestic agri growth trend
37%
Domestic Agri Revenues (INR m)
26%
30%
Growth (%)
35%
20%
13%
21%
10%
-2%
9%
1,960
2,185
1,289
1,270
2,460
2,150
1,670
1,720
2,706
2,340
-13%
1,450
1QFY14 2QFY14 3QFY14 4QFY14 1QFY15 2QFY15 3QFY15 4QFY15 1QFY16 2QFY16 3QFY16
Source: Company, MOSL
16 February 2016
2

PI Industries
EBITDA margin expands 190bp
EBITDA margin expanded 190bp to 20.5% (est. 18.7%), led by better mix of
revenues as share of high margin CSM increased to 72% in 3QFY16 from 68% in
3QFY15 also aided by better product mix and cost efficiencies.
EBITDA stood at INR1,048m (est. INR1,171m), up 11.4% YoY. Tax rate was lower
at 24.7% (31.9% in 3QFY15) due to tax benefits on account of Jambusar SEZ
facility and extension of Udaipur facility.
Adj. PAT grew 19% to INR704m (est. INR748m) in 3QFY16.
Exhibit 5: PAT trend
%
24%
19% 21%
PAT
15%
12% 12%
10%
12%
11% 12% 11%
%
16%
13%
14%
Exhibit 4: EBITDA trend
EBITDA
19% 19%
23%
16%
14%
19% 18%
17%
789 895 594 511 1,080 726 941 953 1,358 848 1,048
485 553 347 452 717 490 622 603 873 582 725
Source: Company, MOSL
CSM order book stands at USD780m
Order book stood at USD780m, growing 28% QoQ from USD610m in 3QFY16.
Management highlighted that the same is executable over next 3-4 years.
The increase in order book was from both existing as well as newer molecules.
Jambusar Phase III began operations in Jan 2016 and thus both Phase II and III
are now operational (income tax exempt for first 5 years); coupled with
commercialization of 1-2 molecules every year, and execution of order book
should drive CSM revenue going ahead.
These Jambusar plants enjoy 100% exemption from income tax for the first five
years and 50% for next five years.
Domestic Agri Business to see bounce back led by normal monsoon
PI launched Bio Vita X and Vibrant (addressable market of INR13b) during the
quarter which shall keep momentum for domestic business going forward.
Recently launched products currently contribute ~15% of revenues, signifying
growth potential for ramp up.
Management highlighted that Nominee Gold should continue to post strong
growth since opportunity is huge while penetration is 10% (as against potential
for 30%), also dynamics for rice are still favorable as compared to corn and
cotton.
Other conference call highlights:-
Net cash from operations stood at INR2.35b while debt to equity ratio stood at
0.09x.
Tax rate for FY16 is expected to be 27-28% while for FY17 and FY18 should be
higher than that – 29-30%.
3
16 February 2016

PI Industries
Guidance:
CSM should see close to 18-20% growth in FY17, while 4QFY16
growth should be in mid-teens.
We value PI at 22x FY18E EPS (rolled over to FY18), which we believe is justified
considering:
Valuation and View
PI boasts of a unique business model—a strong R&D-led custom synthesis
business (59% of revenues) build over the last two decades, and an equally
compelling domestic agro-chemicals business (41% of revenues), largely built by
in-licensing arrangements with major global agro-chemicals innovators.
With a mere 10% penetration, we believe there is untapped growth potential in
PI’s largest product—Nominee Gold, which (along with new products like
Osheen, Vibrant) will continue to drive growth momentum for the domestic
agro-chemicals business.
With a strong order book amounting to USD780m, the CSM business has robust
revenue visibility—book-to-bill of 4.2x; we thus expect 18% revenue CAGR over
FY15-18. We believe the foray into new segments like pharmaceuticals and
electronics chemicals will be the next key growth drivers for the CSM business.
With best-in-class capital efficiency (40% RoCE, low debt equity, robust growth
outlook—18% revenue CAGR and 24% PAT CAGR), we believe PI is one of the
best plays on India’s agri sector and CSM opportunities.
We value the stock at 22x FY18E earnings and
maintain Buy
with a target price
of INR755.
Exhibit 6: Year PE band
40
32
P/E (x)
5 Yrs Avg(x)
15 Yrs Avg(x)
10 Yrs Avg(x)
Exhibit 7: 10 Year PB band
9.0
P/B (x)
5 Yrs Avg(x)
15 Yrs Avg(x)
10 Yrs Avg(x)
6.0
24
16.8
16
8
7.4
0
0.0
10.0
3.0
4.2
2.4
1.7
24.2
6.3
Source: Company, MOSL
16 February 2016
4

PI Industries
Quarterly metrics
Exhibit 8: Quarterly metrics
2QFY14
Revenues (INR M)
Agri-input
CSM
Revenue growth (%)
Agri-input
CSM
2,185
2,442
3QFY14
1,289
2,345
4QFY14
1,270
2,350
1QFY15
2,460
2,250
2QFY15
2,150
2,110
3QFY15
1,670
3,380
4QFY15 1QFY16
1,720
3,650
2,706
2,842
2QFY16
2,340
2,110
3QFY16
1,450
3,660
13%
133%
20%
34%
21%
4%
26%
8%
-2%
-14%
30%
44%
35%
55%
10%
26%
10%
0%
-13%
8%
Source: Company, MOSL
16 February 2016
5

PI Industries
Story in charts
Exhibit 9: CSM contribution to increase
Domestic agri-inputs
39%
36%
CSM exports
Exhibit 10: Order book to revenue ratio in CSM
Revenue USD mn
Order book to revenue
Order book USD mn
42%
52%
58%
59%
63%
65%
65%
3.85
300
578
2.77
305
110
FY13
153
395
2.58
187
3.09
61%
64%
58%
48%
42%
41%
37%
35%
35%
78
FY12
FY10 FY11 FY12 FY13 FY14 FY15 FY16E FY17E FY18E
Source: Company, MOSL
FY14
FY15
Source: Company, MOSL
Exhibit 11: Consistently strong asset turnover
Asset Turnover (x)
1.8
1.4
1.4
1.8
1.6
1.8
1.7
Exhibit 12: High cash flow generating
Free cash flow (INR m)
1,548
429
2,705
2,644
156
(47)
FY12
FY13
FY14
FY15
FY16E
FY17E
FY18E
FY12
(490)
FY13
FY14
FY15
FY16E
FY17E
FY18E
Source: Company, MOSL
Exhibit 13: Expected to be debt-free by FY17
0.7
Exhibit 14: RoCE to improve to 40.5% (%)
RoCE (x)
34.9
39.9
36.4
38.5
40.5
0.4
0.1
25.6
0.1
FY15
0.1
FY16E
(0.1)
FY17E
FY18E
(0.1)
Source: Company, MOSL
25.3
FY12
FY13
FY14
FY12
FY13
FY14
FY15
FY16E
FY17E
FY18E
Source: Company, MOSL
16 February 2016
6

PI Industries
Key assumptions
Exhibit 15: Assumption sheet
FY12
Revenues (INR m)
Domestic agro-chemicals
CSM
Revenues growth (%)
Domestic agro-chemicals
CSM
EBITDA (INR m)
Domestic agro-chemicals
CSM
EBITDA margins (%)
Domestic agro-chemicals
CSM
16%
18%
12%
19%
16%
19%
16%
21%
16%
24%
17%
24%
17%
25%
23%
59%
1,434
783
672
9%
61%
1,806
664
1,132
22%
54%
2,889
1,039
1,785
19%
24%
3,727
1,276
2,400
-2%
10%
4,448
1,235
3,213
18%
22%
5,596
1,521
4,074
20%
22%
6,858
1,826
5,032
8,791
5,052
3,731
FY13
11,515
5,500
6,001
FY14
15,955
6,700
9,250
FY15
19,403
7,973
11,430
FY16E
21,201
7,814
13,388
FY17E
26,056
9,220
16,836
FY18E
31,604
11,064
20,540
Source: Company, MOSL
16 February 2016
7

PI Industries
Financials and Valuations
Income Statement
Y/E Mar
Net Sales
Change (%)
EBITDA
EBITDA Margin (%)
Depreciation
EBIT
Interest
Other Income
Extraordinary items
PBT
Tax
Tax Rate (%)
Min. Int. & Assoc. Share
Reported PAT
Adjusted PAT
Change (%)
2011
7,200
32.7
1,152
16.0
157
995
185
104
0
914
263
28.8
0
651
651
55.4
2011
112
2,025
2,137
2,383
326
4,846
3,617
1,076
2,541
335
5
3,760
1,410
1,750
70
530
1,794
1,660
133
1,966
4,846
2012
8,791
22.1
1,434
16.3
173
1,261
199
51
321
1,434
398
27.8
0
1,036
804
23.5
2012
125
3,129
3,254
2,468
329
6,051
4,160
1,185
2,975
810
5
4,226
1,788
1,722
94
622
1,965
1,781
184
2,261
6,051
2013
11,514
31.0
1,806
15.7
220
1,586
218
82
0
1,450
477
32.9
0
973
973
21.0
2013
136
5,182
5,317
2,172
483
7,972
6,178
1,398
4,781
605
5
5,956
2,418
2,625
161
752
3,375
3,151
224
2,581
7,972
2014
15,955
38.6
2,889
18.1
316
2,573
118
158
0
2,613
733
28.1
0
1,880
1,880
93.2
2014
136
6,809
6,945
1,223
437
8,605
6,829
1,563
5,267
425
5
7,482
3,188
2,568
438
1,289
4,574
4,251
324
2,908
8,605
2015
19,403
21.6
3,727
19.2
498
3,229
97
420
0
3,552
1,093
30.8
0
2,459
2,459
30.8
2015
137
8,828
8,965
1,148
369
10,481
7,050
1,724
5,326
1,332
5
9,668
3,782
3,826
341
1,719
5,851
5,437
413
3,817
10,481
2016E
21,201
9.3
4,431
20.9
633
3,798
91
341
0
4,048
1,174
29.0
0
2,874
2,874
16.9
2016E
137
11,119
11,256
1,348
369
12,972
11,050
2,357
8,693
318
5
10,010
3,875
3,776
297
2,062
6,054
5,232
822
3,956
12,972
2017E
26,056
22.9
5,602
21.5
759
4,843
54
320
0
5,110
1,431
28.0
0
3,679
3,679
28.0
2017E
137
14,049
14,186
0
369
14,554
12,300
3,116
9,184
208
5
12,695
4,729
4,640
851
2,475
7,538
6,502
1,036
5,157
14,554
(INR Million)
2018E
31,604
21.3
6,953
22.0
840
6,113
0
401
0
6,513
1,824
28.0
0
4,689
4,689
27.5
Balance Sheet
Y/E Mar
Share Capital
Reserves
Net Worth
Debt
Deferred Tax
Total Capital Employed
Gross Fixed Assets
Less: Acc Depreciation
Net Fixed Assets
Capital WIP
Investments
Current Assets
Inventory
Debtors
Cash & Bank
Loans & Adv, Others
Curr Liabs & Provns
Curr. Liabilities
Provisions
Net Current Assets
Total Assets
(INR Million)
2018E
137
17,823
17,960
0
369
18,329
13,550
3,956
9,594
32
5
16,872
5,694
5,628
2,580
2,970
8,174
7,829
345
8,698
18,329
16 February 2016
8

PI Industries
Financials and Valuations
Ratios
Y/E Mar
Basic (INR)
EPS
Cash EPS
Book Value
DPS
Payout (incl. Div. Tax.)
Valuation(x)
P/E
Cash P/E
Price / Book Value
EV/Sales
EV/EBITDA
Dividend Yield (%)
Profitability Ratios (%)
RoE
RoCE
Turnover Ratios (%)
Asset Turnover (x)
Debtors (No. of Days)
Inventory (No. of Days)
Creditors (No. of Days)
Leverage Ratios (%)
Net Debt/Equity (x)
2011
5.8
7.2
19.1
0.4
9.0
2012
6.4
7.8
26.0
0.9
14.0
2013
7.2
8.8
39.2
1.0
16.2
2014
13.8
16.1
51.0
2.0
17.0
41.6
35.6
11.2
4.9
27.3
0.3
35.3
29.1
1.5
83
122
144
1.1
2011
1,152
77
-839
-180
0
210
-969
-758
0
20
-949
0
946
-177
-15
754
16
54
70
29.8
25.6
1.4
68
133
132
0.7
2012
1,434
331
-390
-400
69
1,044
-1,091
-47
0
51
-1,040
-28
359
-212
-100
20
24
70
94
22.7
25.3
1.4
79
131
171
0.4
2013
1,806
20
-425
-380
0
1,020
-1,510
-490
0
105
-1,405
1,187
-402
-251
-82
452
67
94
161
30.7
34.9
1.8
56
126
169
0.1
2014
2,889
19
-81
-743
104
2,188
-640
1,548
0
179
-461
40
-1,097
-115
-279
-1,451
276
161
437
2015
18.0
21.6
65.6
2.5
16.9
31.9
26.5
8.7
4.1
21.2
0.4
30.9
39.9
1.8
69
124
178
0.1
2015
3,727
197
-971
-1,195
83
1,841
-1,685
156
0
274
-1,412
38
-153
-111
-300
-526
-96
437
341
2016E
21.0
25.7
82.4
3.5
20.3
27.3
22.4
7.0
3.7
17.9
0.6
28.4
36.4
1.6
62
120
162
0.1
2016E
4,431
341
-184
-1,174
0
3,415
-2,986
429
0
0
-2,986
0
200
-91
-583
-474
-45
341
297
2017E
26.9
32.5
103.9
4.5
20.4
21.3
17.7
5.5
3.0
13.8
0.8
28.9
38.5
1.8
62
120
165
-0.1
2017E
5,602
320
-646
-1,431
0
3,846
-1,140
2,705
0
0
-1,140
0
-1,348
-54
-749
-2,151
555
297
851
2018E
34.3
40.5
131.5
5.5
19.5
16.7
14.2
4.4
2.4
10.9
1.0
29.2
40.5
1.7
62
120
165
-0.1
Cash Flow Statement
Y/E Mar
Adjusted EBITDA
Non cash opr. exp (inc)
(Inc)/Dec in Wkg. Cap.
Tax Paid
Other operating activities
CF from Op. Activity
(Inc)/Dec in FA & CWIP
Free cash flows
(Pur)/Sale of Invt
Others
CF from Inv. Activity
Inc/(Dec) in Net Worth
Inc / (Dec) in Debt
Interest Paid
Divd Paid (incl Tax) & Others
CF from Fin. Activity
Inc/(Dec) in Cash
Add: Opening Balance
Closing Balance
(INR Million)
2018E
6,953
401
-1,812
-1,824
0
3,717
-1,073
2,644
0
0
-1,073
0
0
0
-915
-915
1,729
851
2,580
16 February 2016
9

PI Industries
Corporate profile
Company description
Mr. Piyush Singhal founded PI Industries in 1947 as
Mewar Oil and General Mills Limited, which was
predominantly into edible oils business. A decade
later, the company started selling agro-chemicals.
The name was changed to PI Industries in 1990s. PI
has two business activities: (a) Domestic Agri Inputs
offering plant protection products, and specialty
plant nutrient products and solutions, (b) Custom
Synthesis & Manufacturing (CSM) for contract
research and production of agro-chemicals,
intermediates and other niche fine chemicals for
global innovators.
Exhibit 1: Sensex rebased
Source: MOSL/Bloomberg
Exhibit 2: Shareholding pattern (%)
Promoter
DII
FII
Others
Sep-15
58.4
8.8
17.0
15.9
Jun-15
58.4
8.5
17.5
15.7
Sep-14
58.4
7.4
19.1
15.1
Exhibit 3: Top holders
Holder Name
Cartica Capial Ltd.
ICICI Prudential Value Discovry Fund
Axis Mutual Fund Trustee limited Ac Axis
Mutual Fund A/c Axios Long Term Equity
Fund
Oppenheimer International Small company
Fund
Rowanhill Investments Ltd.
% Holding
5.7
3.0
2.1
1.9
1.5
Source: Capitaline
Note: FII Includes depository receipts
Source: Capitaline
Exhibit 4: Top management
Name
Salil Singhal
Mayank Singhal
Naresh Kapoor
Designation
Chairman & Managing Director
Managing Director & CEO
Company Secretary
Exhibit 5: Directors
Name
Anurag Surana
Narayan K Seshadri
Ramani Narula
Name
D Venkatrao S Sohoni
Pravin K Laheri
Rajnish Sarna
Source: Capitaline
Exhibit 6: Auditors
Name
Grant Thornton India LLP
K G Goyal & Co
R S Bhatia
S S Kothari Mehta & Co
Type
Internal
Cost Auditor
Secretarial Audit
Statutory
Source: Capitaline
Exhibit 7: MOSL forecast v/s consensus
EPS
(INR)
FY16
FY17
FY18
MOSL
forecast
21.0
26.9
34.3
Consensus
forecast
21.4
27.6
33.7
Variation
(%)
-2.1
-2.5
1.7
Source: Bloomberg
16 February 2016
10

PI Industries
NOTES
16 February 2016
11

Disclosures
This document has been prepared by Motilal Oswal Securities Limited (hereinafter referred to as Most) to provide information about the company(ies) and/sector(s), if any, covered in the report and may be distributed by it and/or its
PI Industries
affiliated company(ies). This report is for personal information of the selected recipient/s and does not construe to be any investment, legal or taxation advice to you. This research report does not constitute an offer, invitation or
inducement to invest in securities or other investments and Motilal Oswal Securities Limited (hereinafter referred as MOSt) is not soliciting any action based upon it. This report is not for public distribution and has been furnished to
you solely for your general information and should not be reproduced or redistributed to any other person in any form. This report does not constitute a personal recommendation or take into account the particular investment
objectives, financial situations, or needs of individual clients. Before acting on any advice or recommendation in this material, investors should consider whether it is suitable for their particular circumstances and, if necessary, seek
professional advice. The price and value of the investments referred to in this material and the income from them may go down as well as up, and investors may realize losses on any investments. Past performance is not a guide for
future performance, future returns are not guaranteed and a loss of original capital may occur.
MOSt and its affiliates are a full-service, integrated investment banking, investment management, brokerage and financing group. We and our affiliates have investment banking and other business relationships with a some
companies covered by our Research Department. Our research professionals may provide input into our investment banking and other business selection processes. Investors should assume that MOSt and/or its affiliates are
seeking or will seek investment banking or other business from the company or companies that are the subject of this material and that the research professionals who were involved in preparing this material may educate investors
on investments in such business. The research professionals responsible for the preparation of this document may interact with trading desk personnel, sales personnel and other parties for the purpose of gathering, applying and
interpreting information. Our research professionals are paid on the profitability of MOSt which may include earnings from investment banking and other business.
MOSt generally prohibits its analysts, persons reporting to analysts, and members of their households from maintaining a financial interest in the securities or derivatives of any companies that the analysts cover. Additionally, MOSt
generally prohibits its analysts and persons reporting to analysts from serving as an officer, director, or advisory board member of any companies that the analysts cover. Our salespeople, traders, and other professionals or affiliates
may provide oral or written market commentary or trading strategies to our clients that reflect opinions that are contrary to the opinions expressed herein, and our proprietary trading and investing businesses may make investment
decisions that are inconsistent with the recommendations expressed herein. In reviewing these materials, you should be aware that any or all of the foregoing among other things, may give rise to real or potential conflicts of interest.
MOSt and its affiliated company(ies), their directors and employees and their relatives may; (a) from time to time, have a long or short position in, act as principal in, and buy or sell the securities or derivatives thereof of companies
mentioned herein. (b) be engaged in any other transaction involving such securities and earn brokerage or other compensation or act as a market maker in the financial instruments of the company(ies) discussed herein or act as an
advisor or lender/borrower to such company(ies) or may have any other potential conflict of interests with respect to any recommendation and other related information and opinions.; however the same shall have no bearing
whatsoever on the specific recommendations made by the analyst(s), as the recommendations made by the analyst(s) are completely independent of the views of the affiliates of MOSt even though there might exist an inherent
conflict of interest in some of the stocks mentioned in the research report
Reports based on technical and derivative analysis center on studying charts company's price movement, outstanding positions and trading volume, as opposed to focusing on a company's fundamentals and, as such, may not match
with a report on a company's fundamental analysis. In addition MOST has different business segments / Divisions with independent research separated by Chinese walls catering to different set of customers having various
objectives, risk profiles, investment horizon, etc, and therefore may at times have different contrary views on stocks sectors and markets.
Unauthorized disclosure, use, dissemination or copying (either whole or partial) of this information, is prohibited. The person accessing this information specifically agrees to exempt MOSt or any of its affiliates or employees from, any
and all responsibility/liability arising from such misuse and agrees not to hold MOSt or any of its affiliates or employees responsible for any such misuse and further agrees to hold MOSt or any of its affiliates or employees free and
harmless from all losses, costs, damages, expenses that may be suffered by the person accessing this information due to any errors and delays. The information contained herein is based on publicly available data or other sources
believed to be reliable. Any statements contained in this report attributed to a third party represent MOSt’s interpretation of the data, information and/or opinions provided by that third party either publicly or through a subscription
service, and such use and interpretation have not been reviewed by the third party. This Report is not intended to be a complete statement or summary of the securities, markets or developments referred to in the document. While we
would endeavor to update the information herein on reasonable basis, MOSt and/or its affiliates are under no obligation to update the information. Also there may be regulatory, compliance, or other reasons that may prevent MOSt
and/or its affiliates from doing so. MOSt or any of its affiliates or employees shall not be in any way responsible and liable for any loss or damage that may arise to any person from any inadvertent error in the information contained in
this report. MOSt or any of its affiliates or employees do not provide, at any time, any express or implied warranty of any kind, regarding any matter pertaining to this report, including without limitation the implied warranties of
merchantability, fitness for a particular purpose, and non-infringement. The recipients of this report should rely on their own investigations.
This report is intended for distribution to institutional investors. Recipients who are not institutional investors should seek advice of their independent financial advisor prior to taking any investment decision based on this report or for
any necessary explanation of its contents.
Most and it’s associates may have managed or co-managed public offering of securities, may have received compensation for investment banking or merchant banking or brokerage services, may have received any compensation for
products or services other than investment banking or merchant banking or brokerage services from the subject company in the past 12 months.
Most and it’s associates have not received any compensation or other benefits from the subject company or third party in connection with the research report.
Subject Company may have been a client of Most or its associates during twelve months preceding the date of distribution of the research report
MOSt and/or its affiliates and/or employees may have interests/positions, financial or otherwise of over 1 % at the end of the month immediately preceding the date of publication of the research in the securities mentioned in this
report. To enhance transparency, MOSt has incorporated a Disclosure of Interest Statement in this document. This should, however, not be treated as endorsement of the views expressed in the report.
Motilal Oswal Securities Limited is registered as a Research Analyst under SEBI (Research Analyst) Regulations, 2014. SEBI Reg. No. INH000000412
There are no material disciplinary action that been taken by any regulatory authority impacting equity research analysis activities
Analyst Certification
The views expressed in this research report accurately reflect the personal views of the analyst(s) about the subject securities or issues, and no part of the compensation of the research analyst(s) was, is, or will be directly or
indirectly related to the specific recommendations and views expressed by research analyst(s) in this report. The research analysts, strategists, or research associates principally responsible for preparation of MOSt research receive
compensation based upon various factors, including quality of research, investor client feedback, stock picking, competitive factors and firm revenues
Disclosure of Interest Statement
Analyst ownership of the stock
Served as an officer, director or employee
PI INDUSTRIES LTD
No
No
A graph of daily closing prices of securities is available at www.nseindia.com and http://economictimes.indiatimes.com/markets/stocks/stock-quotes
Regional Disclosures (outside India)
For U.S.
This report is not directed or intended for distribution to or use by any person or entity resident in a state, country or any jurisdiction, where such distribution, publication, availability or use would be contrary to law, regulation or which
would subject MOSt & its group companies to registration or licensing requirements within such jurisdictions.
Motilal Oswal Securities Limited (MOSL) is not a registered broker - dealer under the U.S. Securities Exchange Act of 1934, as amended (the"1934 act") and under applicable state laws in the United States. In addition MOSL is not a
registered investment adviser under the U.S. Investment Advisers Act of 1940, as amended (the "Advisers Act" and together with the 1934 Act, the "Acts), and under applicable state laws in the United States. Accordingly, in the
absence of specific exemption under the Acts, any brokerage and investment services provided by MOSL, including the products and services described herein are not available to or intended for U.S. persons.
This report is intended for distribution only to "Major Institutional Investors" as defined by Rule 15a-6(b)(4) of the Exchange Act and interpretations thereof by SEC (henceforth referred to as "major institutional investors"). This
document must not be acted on or relied on by persons who are not major institutional investors. Any investment or investment activity to which this document relates is only available to major institutional investors and will be
engaged in only with major institutional investors. In reliance on the exemption from registration provided by Rule 15a-6 of the U.S. Securities Exchange Act of 1934, as amended (the "Exchange Act") and interpretations thereof by
the U.S. Securities and Exchange Commission ("SEC") in order to conduct business with Institutional Investors based in the U.S., MOSL has entered into a chaperoning agreement with a U.S. registered broker-dealer, Motilal Oswal
Securities International Private Limited. ("MOSIPL"). Any business interaction pursuant to this report will have to be executed within the provisions of this chaperoning agreement.
The Research Analysts contributing to the report may not be registered /qualified as research analyst with FINRA. Such research analyst may not be associated persons of the U.S. registered broker-dealer, MOSIPL, and therefore,
may not be subject to NASD rule 2711 and NYSE Rule 472 restrictions on communication with a subject company, public appearances and trading securities held by a research analyst account.
This report is distributed in Hong Kong by Motilal Oswal capital Markets (Hong Kong) Private Limited, a licensed corporation (CE AYY-301) licensed and regulated by the Hong Kong Securities and Futures Commission (SFC)
pursuant to the Securities and Futures Ordinance (Chapter 571 of the Laws of Hong Kong) “SFO”. As per SEBI (Research Analyst Regulations) 2014 Motilal Oswal Securities (SEBI Reg No. INH000000412) has an agreement with
Motilal Oswal capital Markets (Hong Kong) Private Limited for distribution of research report in Kong Kong. This report is intended for distribution only to “Professional Investors” as defined in Part I of Schedule 1 to SFO. Any
investment or investment activity to which this document relates is only available to professional investor and will be engaged only with professional investors.”
Nothing here is an offer or solicitation of these securities, products and services in any jurisdiction where their offer or sale is not qualified or exempt from registration. The Indian Analyst(s) who compile this report is/are not located in
Hong Kong & are not conducting Research Analysis in Hong Kong.
For Hong Kong:
For Singapore
Motilal Oswal Capital Markets Singapore Pte Limited is acting as an exempt financial advisor under section 23(1)(f) of the Financial Advisers Act(FAA) read with regulation 17(1)(d) of the Financial Advisors Regulations and is a
subsidiary of Motilal Oswal Securities Limited in India. This research is distributed in Singapore by Motilal Oswal Capital Markets Singapore Pte Limited and it is only directed in Singapore to accredited investors, as defined in the
Financial Advisers Regulations and the Securities and Futures Act (Chapter 289), as amended from time to time.
In respect of any matter arising from or in connection with the research you could contact the following representatives of Motilal Oswal Capital Markets Singapore Pte Limited:
Kadambari Balachandran
Email : kadambari.balachandran@motilaloswal.com
Contact : (+65) 68189233 / 65249115
Office Address : 21 (Suite 31),16 Collyer Quay,Singapore 04931
16 February 2016
Motilal Oswal Tower, Level 9, Sayani Road, Prabhadevi, Mumbai 400 025
Phone: +91 22 3982 5500 E-mail: reports@motilaloswal.com
Motilal Oswal Securities Ltd
12