24 February 2016
4QCY15 Results Update | Sector: Lubricants
BSE SENSEX
23,089
Bloomberg
Equity Shares (m)
M.Cap. (INR b) / (USD b)
52-Week Range (INR)
1, 6, 12 Rel. Per (%)
Avg Val (INR m)
Free float (%)
S&P CNX
7,019
CSTRL IN
494.6
201/2.9
518 / 370
3/3/6
128
29.0
Castrol India
CMP: INR407
TP: INR474 (+16%)
Neutral
EBITDA miss due to lower volumes and higher other expenses; await
volume growth revival
Financials & Valuation (INR Billion)
Y/E Dec
Sales
EBITDA
Adj. PAT
Adj. EPS (INR)
EPS Gr. (%)
BV/Sh.(INR)
RoE (%)
RoCE (%)
P/E (x)
P/BV (x)
Estimate change
TP change
Rating change
2015
32.9
8.8
6.0
12.0
24.5
12.0
76.6
107.8
33.9
34.0
2016E
34.3
9.7
6.7
13.5
12.5
13.9
109.2
154.7
30.2
29.4
4-7%
7%
2017E
36.2
10.6
7.3
14.8
9.2
15.8
104.7
144.3
27.6
25.8
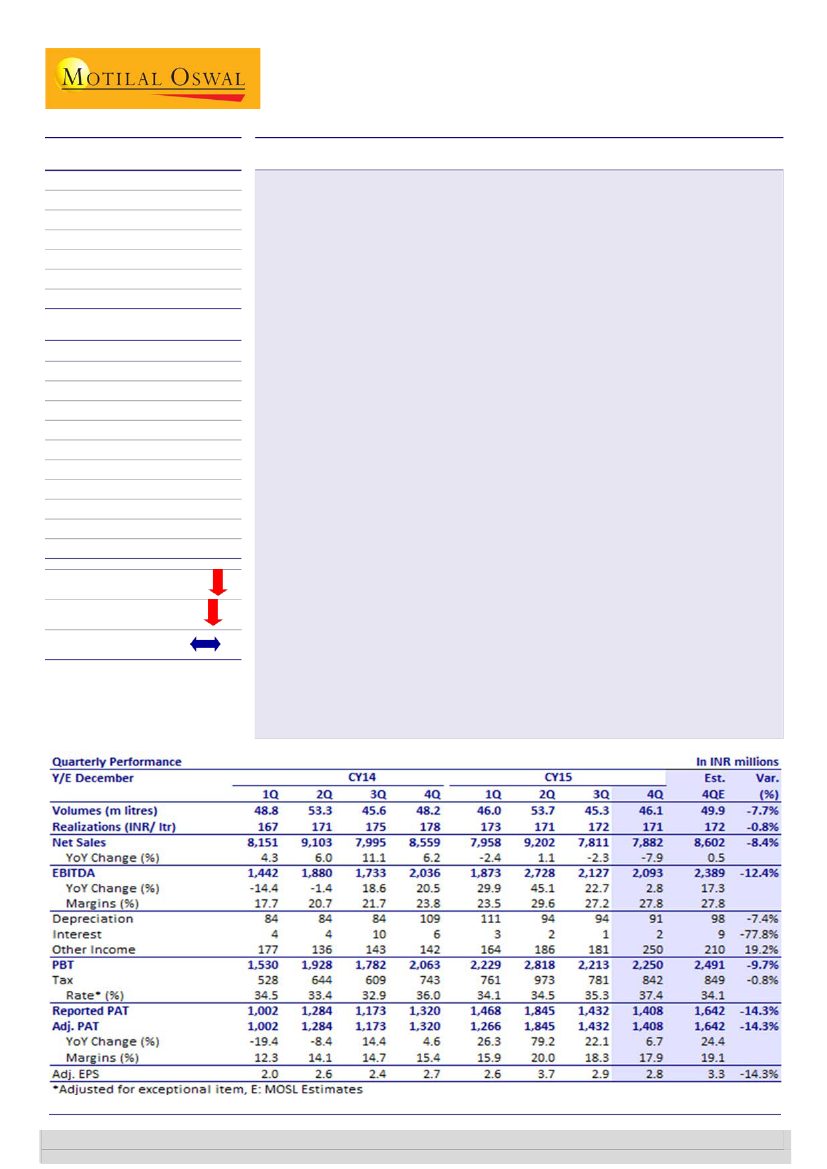
Castrol India’s 4QCY15 EBITDA of INR2.1b (+3% YoY, -2% QoQ) was below our
est. of INR2.4b led by (a) lower–than-expected volumes; (b) higher other
operating expenses due to INR100m of CSR expenses. Reported PAT was below
expectations at INR1.4b (+7% YoY, -2% QoQ)—led by higher than expected tax
rate of 37.4% (est. of 34%).
Revenue stood at INR7.9b (est. of INR8.6b; -7.9% YoY, -0.9% QoQ) impacted by
(a) lower volumes and (b) lower realizations
Realization stood at INR171/ltr (-4% YoY, flat QoQ) while sales volume stood at
46.1m ltr (-4% YoY, +2% QoQ). QoQ volume increase was primarily due to
seasonality. Automotive volumes increased 2% QoQ. While overall automotive
market has declined, personal mobility market volumes have increased. Poor
monsoons have impacted rural demand and in particular in agriculture segment.
Gross margin INR90/lt (+15% YoY, +2% QoQ); the QoQ increase was due to lower
RM costs at INR80.8/ltr (-18% YoY, -4% QoQ).
EBITDA margin 26.6% (v/s 23.8% in 4QCY14 and 27.2% in 3QCY15) —EBITDA
margin was lower QoQ despite higher gross margins due to CSR expenses of
INR100m. Adj. EBITDA margin stands at 27.8%.
Castrol declared a final dividend of INR5/share (full year stands at INR9/share).
Outlook:
Lubricant business volume recovery continues to be delayed led by
subdued economic activity. Industrial segment will continue to see a drag and is
expected to show uptick with the likely economic pick-up toward end CY16.
INR/USD volatility is a concern. Expect volume uptick in 1QCY16 due to increased
discounts being offered by the company.
Valuation and view:
We reduce our earnings CY16/CY17 EPS by 7%/4% due to
delay in the volume uptick versus our earlier expectations. Earlier than expected
economic uptick is an upside risk to our estimates. Our fair value stands at
INR474 at 35x CY16E EPS. CSTRL trades at 30.2x/27.6 CY16E/CY17E EPS of
INR13.5/14.8.
Neutral.
Investors are advised to refer through important disclosures made at the last page of the Research Report.
Motilal Oswal research is available on www.motilaloswal.com/Institutional-Equities, Bloomberg, Thomson Reuters, Factset and S&P Capital.
Harshad Borawake
(HarshadBorawake@MotilalOswal.com); +91 22 3982 5432
Rajat Agarwal
(Rajat.Agarwal@MotilalOswal.com); +91 22 3982 5558

Castrol India
Exhibit 1: Operational performance: QoQ volumes declined due to seasonality while realizations were almost flat
INR/ltr
Volumes (m litres)
Automotive
Non-Automotive
CY12
CY13
CY14
CY15
1Q
2Q
3Q
4Q
1Q
2Q
3Q
4Q
1Q
2Q
3Q
4Q
1Q
2Q
3Q
52.6 56.7 46.1 48.5 50.1 54.1 44.8 47.8 48.8 53.3 45.6 48.2 46.0 53.7 45.3
45.1 50.4 39.3 41.9 43.8 47.3 37.5 40.7 42.1 46.1 38.3 40.6 40.2 46.9 38.2
7.5 6.3 6.8 6.6 6.3 6.8 7.3 7.1 6.7
7.2 7.3 7.6 5.8
6.8 7.2
4QCY15
(%)
4Q YoY QoQ
46.1 -4.4 1.7
38.9 -4.1 2.0
7.2
-5.9 -0.1
Realizations
148.6 150.1 156.3 156.3 156.0 158.7 160.6 168.7 167.0 170.8 175.3 177.6 173.0 171.5 172.3 171.0 -3.7 -0.7
Automotive
149.5 149.1 159.0 159.0 159.1 162.1 166.6 172.8 171.0 174.6 180.3 181.9 176.6 175.1 176.5 175.3 -3.7 -0.7
Non-Automotive 143.1 158.5 138.5 143.5 139.5 140.0 135.2 149.6 145.2 151.4 152.9 158.8 119.7 151.3 154.1 151.6 -4.5 -1.6
Raw material
Gross Margin
EBITDA Margin
87.3 87.7 93.9 89.6 88.4 85.7 91.3 98.9 100.0 97.6 98.8 98.9 87.4
61.3 62.4 62.4 66.7 67.6 73.0 69.3 69.8 67.0 73.2 76.5 78.7 85.6
29.8 29.9 26.3 34.3 33.6 35.2 32.6 35.4 29.6 35.3 38.0 42.2 40.7
82.8 84.2 80.8 -18.3 -4.0
88.7 88.0 90.2 14.6 2.4
50.8 46.9 45.4 7.5 -3.2
Source: Company, MOSL
Exhibit 2: Segmental snapshot: Automotive profitability declines QoQ
In INRm
Revenues
Automotive
Non-Automotive
Total Segment
Revenue
-RHS
EBIT
Automotive
Non-Automotive
Total
1Q
CY12
2Q
3Q
4Q
1Q
CY13
2Q
3Q
4Q
1Q
CY14
2Q
3Q
4Q
1Q
CY15
2Q
3Q
4QCY15 (%)
4Q YoY QoQ
1.3
-1.7
0.8
0.5
8.6
1.4
6,744 7,515 6,248 6,662 6,968 7,668 6,247 7,033 7,197 8,047 6,907 7,386 7,098 8,215 6,740 6,825 -7.6
1,073 998 947 947 879 952 987 1,062 973 1,090 1,116 1,207 694 1,021 1,103 1,084 -10.2
7,817 8,513 7,195 7,609 7,847 8,620 7,234 8,095 8,170 9,137 8,023 8,593 7,792 9,236 7,843 7,909 -8.0
1,461 1,499 1,036 1,562 1,563 1,914 1,297 1,578 1,254 1,628 1,538 1,754 1,950 2,458 1,877 1,887
243 186 149 108 168 216 190 215 145 186 195 250 173 256 233 253
1,704 1,685 1,185 1,670 1,731 2,130 1,487 1,793 1,399 1,814 1,733 2,004 2,123 2,714 2,110 2,140
16.6
15.7
16.5
23.4
11.4
21.9
22.4 25.0
19.1 22.7
22.1 24.7
20.8
19.3
20.6
22.4
20.2
22.1
17.4
14.9
17.1
20.2
17.1
19.9
22.3
17.5
21.6
23.7
20.7
23.3
27.5
24.9
27.2
29.9
25.1
29.4
27.8
21.1
26.9
27.6
23.3
27.1
7.6
1.2
6.8
Segmental EBIT Margin (%)
Automotive
21.7 19.9
Non-Automotive
22.6 18.6
Total
21.8 19.8
Capital Employed
Automotive
2,595 2,122
Non-Automotive
1,164 1,021
Unallocated
3,513 3,325
Total Capital
Employed
7,272 6,468
2,046 1,231 2,361 1,631 1,949 2,039 2,504 1,848 2,035 1,405 2,755 1,446 1,011 269 -80.9 -73.4
1,042 878 994 824 863 990 1,028 1,052 1,120 1,132 1,002 946 1,091 1,091 -3.6 0.0
4,238 4,382 4,380 4,778 5,465 4,485 2,091 1,942 2,866 2,431 2,678 3,500 5,222 4,396 80.8 -15.8
7,326 6,491 7,735 7,233 8,277 7,514 5,623 4,842 6,021 4,968 6,435 5,892 7,324 5,756 15.9 -21.4
Source: Company, MOSL
24 February 2016
2

Castrol India
Exhibit 3: Castrol’s volumes have been stagnant for several years led by higher drain intervals and competition (m ltr)
62
51
50
64
51
46 45
Volumes (m litres)
56
55
51 54
60
50
54 56 54
46
52 53
57
50
46 49
54
49
45 48
53
46 48 46
54
45 46
56 54
1Q 2Q 3Q 4Q 1Q 2Q 3Q 4Q 1Q 2Q 3Q 4Q 1Q 2Q 3Q 4Q 1Q 2Q 3Q 4Q 1Q 2Q 3Q 4Q 1Q 2Q 3Q 4Q 1Q 2Q 3Q 4Q 1Q 2Q 3Q 4Q
CY07
CY08
CY09
CY10
CY11
CY12
CY13
CY14
CY15
Source: Company, MOSL
Exhibit 4: However, company has been able to maintain profitability through consistent price hikes
Realizations (INR/ltr)
200
150
100
50
0
42 43 41 39
32 36 39 37
CY07
CY08
86 89 88 90
73 69 70 67 73 77 79
64 58 58 61 63 60 62 63 65 60 59 61 62 62 67 68
51
Raw material (INR/ltr)
Gross Margin (INR/ltr)
1Q 2Q 3Q 4Q 1Q 2Q 3Q 4Q 1Q 2Q 3Q 4Q 1Q 2Q 3Q 4Q 1Q 2Q 3Q 4Q 1Q 2Q 3Q 4Q 1Q 2Q 3Q 4Q 1Q 2Q 3Q 4Q 1Q 2Q 3Q 4Q
CY09
CY10
CY11
CY12
CY13
CY14
CY15
Source: Company, MOSL
Valuation and view
Lower than expected volume uptick is due to the delay in likely economic
recovery in our view. We expect economic revival will lead to better volume
growth in personal mobility as well as CV and industrial volumes.
Outlook: Lubricant business volume recovery continues to be delayed led by
subdued economic activity. Industrial segment will continue to see a drag and is
expected to show uptick with the likely economic pick-up toward end CY16.
INR/USD volatility is a concern. Expect volume uptick in 1QCY16 due to
increased discounts being offered by the company.
Valuation and view: We reduce our earnings CY16/CY17 EPS by 7%/4% due to
delay in the volume uptick versus our earlier expectations. Earlier than expected
economic uptick is an upside risk to our estimates. Our fair value stands at
INR474 at 35x CY16E EPS. CSTRL trades at 30.2x/27.6 CY16E/CY17E EPS of
INR13.5/14.8. Neutral.
24 February 2016
3

Castrol India
Story in charts
Exhibit 5: Castrol’s revenue growth declined in recent years
Revenue (INRb)
14 13 16
4
4
5
8
10
12
3 Yr CAGR (%)
10 10
5
32 33
28 31
4
2
3
35 37 41
(0.3)
Exhibit 6: …led by continuous decline in lubricant sales
volume
Volumes (m litres)
2.7 2.2
3 Yr CAGR (%)
0.8
0.3
(0.1) (0.1)
(0.6)
(0.9)
(1.8)
(2.1)
(2.1)
(3.3)
(3.5)
12 12 14 15
CY02
CY04
18 20
CY06
23 24
219 209 212 224 226 226 220 215 205 219 209 204 197 196 191 199
CY08
CY10
CY12
CY14
CY16
CY01
CY04
CY07
CY10
CY13
CY16
Source: Company, MOSL
Exhibit 7: …but capped by increase in realizations
Realisations (INR/ltr)
3 Yr CAGR (%)
17.7
13.6
14.1
12.7
11.9
10.7 9.4
8.0
6.5
4.8
4.0
4.4
2.4
Exhibit 8: Castrol’s PAT grew at 10% CAGR in the last 14
years
EBITDA (INRb)
PAT (INRb)
8.6
9.8
7.2
5.8
2.4 2.0 2.0 2.1 2.2
3.3
4.0
3.9
4.9
6.6 6.2
6.7
7.6
4.9 4.9 4.4
6.0
5.1 5.5
6.8
53 56 57 60 65 80 89 105 117 128 143 153 161 173 172 173
CY01
CY04
CY07
CY10
CY13
CY16
1.5 1.3 1.3 1.4 1.4 2.2 2.6
CY02 CY04 CY06 CY08
CY10
CY12
CY14
CY16
Source: Company, MOSL
Exhibit 9: Though lower than previous highs return ratio’s
continue to remain healthy
RoE (%)
RoCE (%)
155
94 92
71 70
108
109
77
144
105
Exhibit 10: Castrol’s raw material (base oil) shows strong
correlation to crude oil prices as expected
Brent (INR/ltr)
64
Raw material (INR/ltr)
93
84 86 85
78
5
3
4
6
6
6
3
82
60 55 49
42
50 50
72
52
134
113
109
79
94
84
35 37
2
2
52 50
3
3
62
4
55
58
40 36 39 36
CY04
CY06
CY02
CY08
CY10
CY12
CY14
CY16
Source: Company, MOSL
24 February 2016
4

Castrol India
Financials and valuations
Income Statement
Y/E December
Net Sales
Change (%)
Raw Material
Gross Margin
Employee Cost
Selling Admin. & Other Exp.
Total Expenditure
EBITDA
Change (%)
% of Net Sales
Depreciation
EBIT
Interest & Finance Charges
Other Income
Non-recurring Items/ Inc.
PBT
Tax
Effective Rate (%)
Reported PAT
Adjusted PAT
Change (%)
2010
28,020
17.2
13,847
14,173
993
5,931
20,770
7,249
26.0
25.9
243
7,006
24
395
1,134
7,377
2,474
33.5
4,903
4,914
27.6
2011
29,818
6.4
16,945
12,873
1,078
5,230
23,253
6,565
-9.4
22.0
251
6,314
19
846
0
7,140
2,334
32.7
4,807
4,850
-1.3
2012
31,209
4.7
16,894
14,314
1,284
6,859
25,038
6,171
-6.0
19.8
266
5,905
18
722
0
6,608
2,189
33.1
4,419
4,474
-7.7
2013
31,661
1.4
16,777
14,884
1,460
6,683
24,920
6,741
9.2
21.3
305
6,436
17
971
228
7,618
2,532
33.2
5,086
4,932
10.2
2014
33,808
6.8
18,233
15,575
1,616
6,868
26,717
7,091
5.2
21.0
361
6,730
24
598
7,303
2,524
34.6
4,779
4,779
-3.1
2015
32,853
-2.8
14,917
17,936
1,766
7,349
24,032
8,821
24.4
26.8
390
8,431
8
781
306
9,510
3,357
35.3
6,153
5,951
24.5
2016E
34,338
4.5
16,089
18,249
1,889
6,708
24,686
9,652
9.4
28.1
423
9,229
8
924
10,145
3,449
34.0
6,696
6,696
12.5
(INR Million)
2017E
36,235
5.5
17,345
18,890
1,993
6,336
25,673
10,562
9.4
29.1
460
10,102
8
987
11,080
3,767
34.0
7,313
7,313
9.2
Balance Sheet
Y/E December
Sources of Funds
Share Capital
Reserves
Net Worth
Capital Employed
Gross Fixed Assets
Less: Depreciation
Net Fixed Assets
Capital WIP
Investments
2010
2,473
3,062
5,535
5,535
2,955
1,752
1,203
166
0
2011
2,473
3,569
6,042
6,042
3,066
1,941
1,125
310
0
2012
4,946
1,547
6,492
6,492
3,287
2,026
1,261
310
0
12,574
3,158
2,196
5,746
1,474
8,303
4,366
2,668
4,271
651
6,493
2013
4,946
2,568
7,514
7,514
4,084
2,331
1,753
0
0
13,867
3,740
2,372
5,942
1,813
8,636
4,728
2,590
5,231
530
7,514
2014
2,473
2,495
4,968
4,968
3,762
2,041
1,721
157
0
12,423
3,655
2,715
4,315
1,739
9,950
5,399
3,068
2,473
618
4,968
2015
2,473
3,458
5,931
5,931
4,152
2,431
1,721
200
0
13,463
3,023
2,638
6,112
1,690
10,071
4,417
4,096
3,392
618
5,931
2016E
2,473
4,387
6,860
6,860
4,587
2,854
1,733
200
0
14,895
3,164
2,758
7,265
1,708
10,586
4,680
4,270
4,309
618
6,860
(INR Million)
2017E
2,473
5,357
7,830
7,830
5,047
3,314
1,733
0
0
16,890
3,406
2,910
8,786
1,787
11,410
5,023
4,670
5,479
618
7,830
Curr. Assets
11,628
12,035
Inventory
2,442
3,009
Sundry Debtors
1,784
2,190
Cash & Bank Balances
6,193
5,490
Loans & Adv.& Other Current Assets
1,209
1,347
Current Liab. & Prov.
7,833
7,991
Sundry Creditors
4,949
5,140
Provisions
2,884
2,852
Net Current Assets
3,795
4,044
Deferred Tax Liability
371
562
Application of Funds
5,535
6,042
E: MOSL Estimates; * Model INR5/sh payout in 2014 led by equity redn
24 February 2016
5

Castrol India
Financials and valuations
Ratios
Y/E December
Basic (INR)
Adj. EPS
Adj Cash EPS
Book Value per Share
DPS
Payout (Incl. Div. Tax) %
Valuation (x)
P/E
Cash P/E
EV/EBITDA
EV/Sales
Price to Book Value
Dividend Yield (%)
Profitability Ratios (%)
RoE
RoCE
Turnover Ratios
Debtors (Days)
Inventory (Days)
Creditors (Days)
Working Capital (Days)
Asset Turnover (x)
Gross Fixed Asset Turnover (x)
Leverage Ratio
Debt/Equity (x)
2010
9.9
10.4
11.2
15.0
88.2
2011
9.8
10.3
12.2
7.5
89.7
41.5
39.5
29.9
6.6
33.3
1.8
79.4
112.6
24
60
129
-44
5.1
9.5
0.0
93.7
133.6
23
58
109
-28
4.9
9.7
0.0
83.8
109.1
26
61
93
-6
4.8
9.5
0.0
71.4
94.2
25
63
101
-13
4.2
7.8
0.0
2012
9.0
9.6
13.1
7.5
96.7
2013
10.0
10.6
15.2
7.0
79.4
2014
9.7
10.4
10.0
7.5
90.5
42.2
39.2
27.8
5.8
40.6
1.8
70.4
91.9
27
75
107
-4
6.8
9.0
0.0
2015
12.0
12.8
12.0
9.0
84.3
33.9
31.8
22.1
5.9
34.0
2.2
76.6
107.8
29
68
107
-10
5.5
7.9
0.0
(INR Million)
2016E
13.5
14.4
13.9
10.0
86.1
30.2
28.4
20.2
5.7
29.4
2.4
109.2
154.7
29
68
105
-8
5.0
7.5
0.0
2017E
14.8
15.7
15.8
11.0
86.7
27.6
26.0
18.3
5.3
25.8
2.7
104.7
144.3
29
66
104
-9
4.6
7.2
0.0
Cash Flow Statement
Y/E MARCH
PBT before E.O. Items
Add : Depreciation
Add: Interest
Less : Direct taxes paid
Inc/Dec in WC
CF from operations
CF from Oper. incl. EO Items
(Inc)/Dec in FA
Free Cash Flow
(Pur)/Sale of Investments
CF from investments
Inc/Dec in Networth
Less: Dividend Paid
CF from Fin. Activity
Inc/Dec of Cash
Add: Beginning Balance
Closing Balance
E: MOSL Estimates
2010
7,377
243
24
2,474
364
5,535
5,535
(238)
5,297
5
(232)
7
4,325
(4,367)
935
5,258
6,193
2011
7,140
251
19
2,334
(952)
4,125
4,125
(318)
3,808
0
(318)
11
4,311
(4,510)
(703)
6,193
5,490
2012
6,608
266
18
2,189
29
4,733
4,733
(402)
4,331
0
(402)
356
4,325
(4,075)
256
5,490
5,746
2013
7,390
305
17
2,532
(764)
4,416
4,416
(487)
3,929
0
(487)
200
4,037
(3,732)
196
5,746
5,942
2014
7,303
361
24
2,524
1,131
6,296
6,296
(486)
5,810
0
(486)
-3,001
4,325
(7,438)
-1,628
5,942
4,314
2015
9,510
390
8
3,357
878
7,429
7,429
(433)
6,996
0
(433)
0
5,190
(5,198)
1,798
4,315
6,112
(INR Million)
2016E
10,145
423
8
3,449
236
7,363
7,363
(435)
6,928
0
(435)
0
5,767
(5,775)
1,153
6,112
7,265
2017E
11,080
460
8
3,767
351
8,132
8,132
(260)
7,872
0
(260)
0
6,343
(6,351)
1,521
7,265
8,786
24 February 2016
6

Castrol India
Corporate profile: Castrol India
Company description
Castrol India (CSTRL), a 71% subsidiary of BP, is a
leading lubricants player in India, with ~20%
market share of the domestic automotive
lubricants industry. It manufactures and markets a
range of automotive and industrial lubricants. It
markets its automotive lubricants under two
brands - Castrol and BP. The company enjoys
leadership in most of the segments it operates in,
including tractor oils, car engine oils, two-wheeler
4-stroke oils, and multi-grade diesel engine oils.
Exhibit 11: Sensex rebased
Exhibit 12: Shareholding pattern (%)
Dec-15
Promoter
DII
FII
Others
71.0
7.6
6.3
15.1
Sep-15
71.0
7.3
6.5
15.1
Dec-14
71.0
6.9
7.4
14.7
Exhibit 13: Top holders
Holder Name
Life Insurance Corporation Of India
Aberdeen Global Indian Equity (Mauritius) Ltd
% Holding
4.5
1.3
Note: FII Includes depository receipts
Exhibit 14: Top management
Name
S M Datta
Ravi Kirpalani
Designation
Chairman
Managing Director
Exhibit 15: Directors
Name
S M Datta*
Ravi Kirpalani
Uday Khanna*
R Gopalakrishnan*
Rashmi Joshi
*Independent
Name
Ralph Hewins
Peter Wiedner
Sashi Mukundan
Jayanta Chatterjee
Exhibit 16: Auditors
Name
S R Batliboi & Co LLP
Kishore Bhatia & Co
Type
Statutory
Cost Auditor
Exhibit 17: MOSL forecast v/s consensus
EPS
(INR)
CY16
CY17
MOSL
forecast
13.5
14.8
Consensus
forecast
13.9
15.4
Variation
(%)
-2.8
-4.0
24 February 2016
7

This document has been prepared by Motilal Oswal Securities Limited (hereinafter referred to as Most) to provide information about the company(ies) and/sector(s), if any, covered in the report and may be distributed
India
Castrol
by it and/or its
affiliated company(ies). This report is for personal information of the selected recipient/s and does not construe to be any investment, legal or taxation advice to you. This research report does not constitute an offer, invitation or
inducement to invest in securities or other investments and Motilal Oswal Securities Limited (hereinafter referred as MOSt) is not soliciting any action based upon it. This report is not for public distribution and has been furnished to
you solely for your general information and should not be reproduced or redistributed to any other person in any form. This report does not constitute a personal recommendation or take into account the particular investment
objectives, financial situations, or needs of individual clients. Before acting on any advice or recommendation in this material, investors should consider whether it is suitable for their particular circumstances and, if necessary, seek
professional advice. The price and value of the investments referred to in this material and the income from them may go down as well as up, and investors may realize losses on any investments. Past performance is not a guide for
future performance, future returns are not guaranteed and a loss of original capital may occur.
MOSt and its affiliates are a full-service, integrated investment banking, investment management, brokerage and financing group. We and our affiliates have investment banking and other business relationships with a some
companies covered by our Research Department. Our research professionals may provide input into our investment banking and other business selection processes. Investors should assume that MOSt and/or its affiliates are
seeking or will seek investment banking or other business from the company or companies that are the subject of this material and that the research professionals who were involved in preparing this material may educate investors
on investments in such business. The research professionals responsible for the preparation of this document may interact with trading desk personnel, sales personnel and other parties for the purpose of gathering, applying and
interpreting information. Our research professionals are paid on the profitability of MOSt which may include earnings from investment banking and other business.
MOSt generally prohibits its analysts, persons reporting to analysts, and members of their households from maintaining a financial interest in the securities or derivatives of any companies that the analysts cover. Additionally, MOSt
generally prohibits its analysts and persons reporting to analysts from serving as an officer, director, or advisory board member of any companies that the analysts cover. Our salespeople, traders, and other professionals or affiliates
may provide oral or written market commentary or trading strategies to our clients that reflect opinions that are contrary to the opinions expressed herein, and our proprietary trading and investing businesses may make investment
decisions that are inconsistent with the recommendations expressed herein. In reviewing these materials, you should be aware that any or all of the foregoing among other things, may give rise to real or potential conflicts of interest.
MOSt and its affiliated company(ies), their directors and employees and their relatives may; (a) from time to time, have a long or short position in, act as principal in, and buy or sell the securities or derivatives thereof of companies
mentioned herein. (b) be engaged in any other transaction involving such securities and earn brokerage or other compensation or act as a market maker in the financial instruments of the company(ies) discussed herein or act as an
advisor or lender/borrower to such company(ies) or may have any other potential conflict of interests with respect to any recommendation and other related information and opinions.; however the same shall have no bearing
whatsoever on the specific recommendations made by the analyst(s), as the recommendations made by the analyst(s) are completely independent of the views of the affiliates of MOSt even though there might exist an inherent
conflict of interest in some of the stocks mentioned in the research report
Reports based on technical and derivative analysis center on studying charts company's price movement, outstanding positions and trading volume, as opposed to focusing on a company's fundamentals and, as such, may not match
with a report on a company's fundamental analysis. In addition MOST has different business segments / Divisions with independent research separated by Chinese walls catering to different set of customers having various
objectives, risk profiles, investment horizon, etc, and therefore may at times have different contrary views on stocks sectors and markets.
Unauthorized disclosure, use, dissemination or copying (either whole or partial) of this information, is prohibited. The person accessing this information specifically agrees to exempt MOSt or any of its affiliates or employees from, any
and all responsibility/liability arising from such misuse and agrees not to hold MOSt or any of its affiliates or employees responsible for any such misuse and further agrees to hold MOSt or any of its affiliates or employees free and
harmless from all losses, costs, damages, expenses that may be suffered by the person accessing this information due to any errors and delays. The information contained herein is based on publicly available data or other sources
believed to be reliable. Any statements contained in this report attributed to a third party represent MOSt’s interpretation of the data, information and/or opinions provided by that third party either publicly or through a subscription
service, and such use and interpretation have not been reviewed by the third party. This Report is not intended to be a complete statement or summary of the securities, markets or developments referred to in the document. While we
would endeavor to update the information herein on reasonable basis, MOSt and/or its affiliates are under no obligation to update the information. Also there may be regulatory, compliance, or other reasons that may prevent MOSt
and/or its affiliates from doing so. MOSt or any of its affiliates or employees shall not be in any way responsible and liable for any loss or damage that may arise to any person from any inadvertent error in the information contained in
this report. MOSt or any of its affiliates or employees do not provide, at any time, any express or implied warranty of any kind, regarding any matter pertaining to this report, including without limitation the implied warranties of
merchantability, fitness for a particular purpose, and non-infringement. The recipients of this report should rely on their own investigations.
This report is intended for distribution to institutional investors. Recipients who are not institutional investors should seek advice of their independent financial advisor prior to taking any investment decision based on this report or for
any necessary explanation of its contents.
Most and it’s associates may have managed or co-managed public offering of securities, may have received compensation for investment banking or merchant banking or brokerage services, may have received any compensation for
products or services other than investment banking or merchant banking or brokerage services from the subject company in the past 12 months.
Most and it’s associates have not received any compensation or other benefits from the subject company or third party in connection with the research report.
Subject Company may have been a client of Most or its associates during twelve months preceding the date of distribution of the research report
MOSt and/or its affiliates and/or employees may have interests/positions, financial or otherwise of over 1 % at the end of the month immediately preceding the date of publication of the research in the securities mentioned in this
report. To enhance transparency, MOSt has incorporated a Disclosure of Interest Statement in this document. This should, however, not be treated as endorsement of the views expressed in the report.
Motilal Oswal Securities Limited is registered as a Research Analyst under SEBI (Research Analyst) Regulations, 2014. SEBI Reg. No. INH000000412
There are no material disciplinary action that been taken by any regulatory authority impacting equity research analysis activities
The views expressed in this research report accurately reflect the personal views of the analyst(s) about the subject securities or issues, and no part of the compensation of the research analyst(s) was, is, or will be directly or
indirectly related to the specific recommendations and views expressed by research analyst(s) in this report. The research analysts, strategists, or research associates principally responsible for preparation of MOSt research receive
compensation based upon various factors, including quality of research, investor client feedback, stock picking, competitive factors and firm revenues
Disclosures
Analyst Certification
Disclosure of Interest Statement
Analyst ownership of the stock
Served as an officer, director or employee
CASTROL INDIA
No
No
A graph of daily closing prices of securities is available at www.nseindia.com and http://economictimes.indiatimes.com/markets/stocks/stock-quotes
Regional Disclosures (outside India)
For U.S.
This report is not directed or intended for distribution to or use by any person or entity resident in a state, country or any jurisdiction, where such distribution, publication, availability or use would be contrary to law, regulation or which
would subject MOSt & its group companies to registration or licensing requirements within such jurisdictions.
Motilal Oswal Securities Limited (MOSL) is not a registered broker - dealer under the U.S. Securities Exchange Act of 1934, as amended (the"1934 act") and under applicable state laws in the United States. In addition MOSL is not a
registered investment adviser under the U.S. Investment Advisers Act of 1940, as amended (the "Advisers Act" and together with the 1934 Act, the "Acts), and under applicable state laws in the United States. Accordingly, in the
absence of specific exemption under the Acts, any brokerage and investment services provided by MOSL, including the products and services described herein are not available to or intended for U.S. persons.
This report is intended for distribution only to "Major Institutional Investors" as defined by Rule 15a-6(b)(4) of the Exchange Act and interpretations thereof by SEC (henceforth referred to as "major institutional investors"). This
document must not be acted on or relied on by persons who are not major institutional investors. Any investment or investment activity to which this document relates is only available to major institutional investors and will be
engaged in only with major institutional investors. In reliance on the exemption from registration provided by Rule 15a-6 of the U.S. Securities Exchange Act of 1934, as amended (the "Exchange Act") and interpretations thereof by
the U.S. Securities and Exchange Commission ("SEC") in order to conduct business with Institutional Investors based in the U.S., MOSL has entered into a chaperoning agreement with a U.S. registered broker-dealer, Motilal Oswal
Securities International Private Limited. ("MOSIPL"). Any business interaction pursuant to this report will have to be executed within the provisions of this chaperoning agreement.
The Research Analysts contributing to the report may not be registered /qualified as research analyst with FINRA. Such research analyst may not be associated persons of the U.S. registered broker-dealer, MOSIPL, and therefore,
may not be subject to NASD rule 2711 and NYSE Rule 472 restrictions on communication with a subject company, public appearances and trading securities held by a research analyst account.
This report is distributed in Hong Kong by Motilal Oswal capital Markets (Hong Kong) Private Limited, a licensed corporation (CE AYY-301) licensed and regulated by the Hong Kong Securities and Futures Commission (SFC)
pursuant to the Securities and Futures Ordinance (Chapter 571 of the Laws of Hong Kong) “SFO”. As per SEBI (Research Analyst Regulations) 2014 Motilal Oswal Securities (SEBI Reg No. INH000000412) has an agreement with
Motilal Oswal capital Markets (Hong Kong) Private Limited for distribution of research report in Kong Kong. This report is intended for distribution only to “Professional Investors” as defined in Part I of Schedule 1 to SFO. Any
investment or investment activity to which this document relates is only available to professional investor and will be engaged only with professional investors.”
Nothing here is an offer or solicitation of these securities, products and services in any jurisdiction where their offer or sale is not qualified or exempt from registration. The Indian Analyst(s) who compile this report is/are not located in
Hong Kong & are not conducting Research Analysis in Hong Kong.
Motilal Oswal Capital Markets Singapore Pte Limited is acting as an exempt financial advisor under section 23(1)(f) of the Financial Advisers Act(FAA) read with regulation 17(1)(d) of the Financial Advisors Regulations and is a
subsidiary of Motilal Oswal Securities Limited in India. This research is distributed in Singapore by Motilal Oswal Capital Markets Singapore Pte Limited and it is only directed in Singapore to accredited investors, as defined in the
Financial Advisers Regulations and the Securities and Futures Act (Chapter 289), as amended from time to time.
In respect of any matter arising from or in connection with the research you could contact the following representatives of Motilal Oswal Capital Markets Singapore Pte Limited:
Kadambari Balachandran
Email : kadambari.balachandran@motilaloswal.com
Contact : (+65) 68189233 / 65249115
Office Address : 21 (Suite 31),16 Collyer Quay,Singapore 04931
For Hong Kong:
For Singapore
24 February 2016
Motilal Oswal Tower, Level 9, Sayani Road, Prabhadevi, Mumbai 400 025
Phone: +91 22 3982 5500 E-mail: reports@motilaloswal.com
Motilal Oswal Securities Ltd
8