4 March 2016
Update
| Sector:
Oil & Gas
HPCL
Buy
BSE SENSEX
24,646
S&P CNX
7,485
CMP: INR749
TP: INR1,299(+73%)
Plans 65% refinery expansion; Begins dynamic pricing
Marketing margins expand; earnings visibility high; valuations attractive with 4-
5% dividend yield
Stock Info
Bloomberg
Equity Shares (m)
52-Week Range (INR)
1, 6, 12 Rel. Per (%)
M.Cap. (INR b)
M.Cap. (USD b)
12M Avg Val (INR M)
Free float (%)
HPCL IN
338.6
991 / 557
-9/-4/31
247.4
3.7
1184
48.9
Brownfield expansion to up refinery capacity by ~65%; expect stable GRM
We attended the HPCL analyst meet. Following are the key takeaways:
Financials Snapshot (INR b)
Y/E Mar
2016E 2017E 2018E
Sales
1,868 1,762 2,114
EBITDA
70.2
77.9 86.4
Adj. PAT
32.6
37.8 42.3
Adj. EPS (INR)
96.3 111.4 124.7
EPS Gr. (%)
19.4
15.7 12.0
BV/Sh.(INR)
535
607
688
RoE (%)
19.1
19.5 19.3
RoCE (%)
14.2
14.8 15.1
P/E (x)
7.8
6.7
6.0
P/BV (x)
1.4
1.2
1.1
Shareholding pattern (%)
As On
Promoter
DII
FII
Others
Dec-15 Sep-15 Dec-14
51.1
14.8
19.4
14.6
51.1
14.7
19.8
14.4
51.1
16.7
18.8
13.4
HPCL plans to spend INR450b in the next five years which include INR212b for
refineries, INR100b for marketing and rest for JV projects (Bhatinda and LNG).
Refinery capex of INR232b includes INR45b for Euro VI upgradation and
brownfield expansions (a) at Vizag from 8.3 to 15mmt (~INR170b) along with
upgradation, (b) at Mumbai from 6.5 to 9.5mmt (INR42b) and (c) JV Bhatinda
refinery from 9 to 11.25mt (INR22b)
Expects expansion at (a) Vizag to complete by April 2020 and expand GRM by
USD4-5/bbl, (b) Mumbai to complete in three years and (c) Bhatinda by Feb-17.
Expects GRM to remain stable in the medium term (9MFY16 GRM: USD6.4/bbl)
helped by higher distillate yields.
Bhatinda refinery (HPCL stake 49%) is expected to post profits in FY16 with
9MFY16 profits at ~INR10b (v/s INR16b loss in FY15) and GRM at ~USD12/bbl.
Management highlighted that since de-regulation, auto fuels marketing
margins have been 10-15% above normal levels. We note that the
Petrol/Diesel marketing margins are at ~INR2.1/ltr in 4QTDFY16 (vs normative
level of INR1.4/ltr). We model margins at INR1.9/2.2/ltr in FY17/FY18.
Auto fuel volume growth remains strong with YTDFY16 growth of 14.3% in
Petrol and 6.3% in diesel.
HPCL has begun dynamic pricing (based on location, demand, competition) in
some test markets to be future ready to roll outs the same on pan-India basis.
Dynamic/differential pricing will help company to sweat the marketing assets
better and improve profitability further.
While refining will continue to be cyclical, marketing (including pipelines) gives
earnings stability and lubes business also contributes meaningfully (10-20%).
Of the three OMCs, HPCL’s earnings are more sensitive to a change in the
marketing margin—given its higher ratio of marketing-to-refining volume.
Hence, it would be the largest beneficiary of higher auto fuel margins.
HPCL trades at 6.7x/6.0x FY17E/FY18E EPS of INR111/INR125 and 1.2/1.0.x
FY17E/FY18E BV. We value HPCL at 5.5x for refining and 8x for marketing to
arrive at a fair value of INR1,299 implying a 73% upside. Dividend yield is very
attractive at ~5%. Maintain Buy.
Bhatinda refinery to turn profitable in FY16
Marketing margins 10-15% above regulated regime; volume growth strong
Already started dynamic pricing; Marketing, lubes gives earnings stability
FII Includes depository receipts
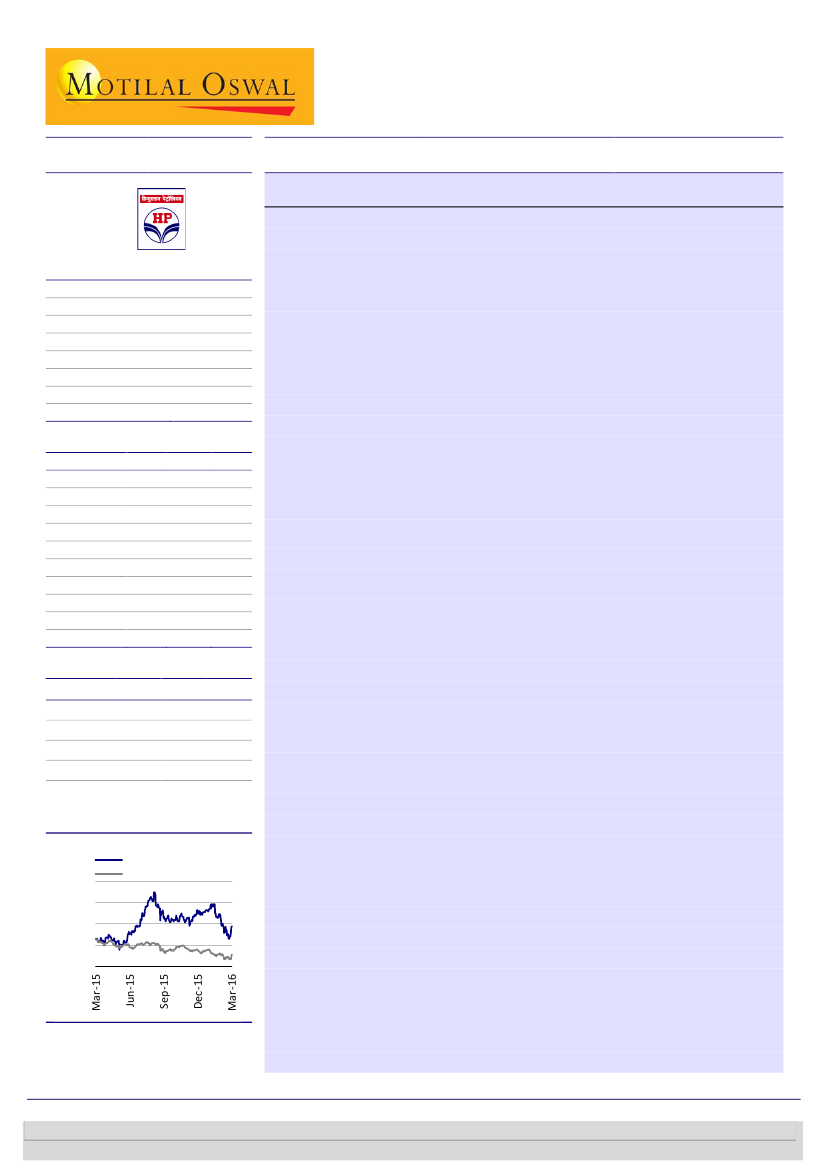
Stock Performance (1-year)
1,050
900
750
600
450
HPCL
Sensex - Rebased
Valuation and view
Harshad Borawake
(HarshadBorawake@MotilalOswal.com); +91 22 3982 5432
Rajat Agarwal
(Rajat.Agarwal@MotilalOswal.com); +91 22 3982 5558
Investors are advised to refer through important disclosures made at the last page of the Research Report.
Motilal Oswal research is available on www.motilaloswal.com/Institutional-Equities, Bloomberg, Thomson Reuters, Factset and S&P

HPCL
Exhibit 1: Profitability improvement measures by HPCL
Recent addition of
secondary processing units
and improvement in crude
mix have added USD1.2/bbl
to Mumbai refinery GRM
and single point mooring
system has added
USD0.5/bbl to Vizag GRM.
Initiative
Optimized MS block operations
LOUP project at Mumbai refinery
Robust LP model
FCC with Cat Cooler at Mumbai refinery
Encon measures
CDU II Revamp at Mumbai refinery
Flare gas recovery systems
Impact Area
Increased MS production in lieu of Naphtha
Increased production of valued added lubricants
Optimizing Crude selection
Conversion of Low value Fuel Oil to value added products
Reduced fuel consumption
Increased crude processing
Reduced hydrocarbon losses
Source: Company, MOSL
Exhibit 2: High volume highway location contributes to 51% of HPCL’s retail outlet
locations
HPCL’s branded fuel station
(Club HP) count has reached
2,300, while branded fuels
(Power) are sold through
1,500 outlets.
While Allied Retail Business
(non-fuel) is carried out at
over 3,000 outlets (>20%)
with 1,650+ ATMs
Source: Company, MOSL
Exhibit 3: Well prepared for private competition with Loyalty programs and fleet
management solutions for auto fuel customers – Already automated 2,561 outlets
Source: Company, MOSL
4 March 2016
2

HPCL
Exhibit 4: Diversified lube distribution – only 10%
dependence on its retail outlets
Exhibit 5: Highly profitable automobile segment contributes
to 32% of lube sales
Source: Company, MOSL
Exhibit 6: Brent prices declined to their montly lowest Feb-04.
WTI
150
120
90
60
30
0
Brent (USD/bbl)
Source: Bloomberg, MOSL
Exhibit 7: HPCL GRM trend – 3QFY16 GRM was equivalent to benchmark Singapore GRM; GRM supported by benign crude
prices
(In USD/bbl)
9.1
6.7
4.4
6.3
1.9 3.7
HPCL GRM
8.7
6.6
5.4
3.8
2.4
4.3
6.2
5.8
4.7
2.0
4.8
6.3
7.5
Singapore GRM
8.6
8.0
8.6
6.3
8.0
7.9
2.7
(1.0)
2.6
2.1
(2.1)
Source: Company, MOSL
4 March 2016
3

HPCL
Exhibit 8: Industry level gross under recoveries have come down sharply; LPG shifted to DBTL (INRb)
Gross under recoveries
HPCL + BPCL + IOCL (INRb)
436
406
70
66
299
-
1Q
325
215
63
60
92
-
2Q
65
73
187
-
3Q
87
78
241
-
4Q
Petrol
478
115
73
290
-
1Q
378
70
71
236
-
2Q
393
110
77
207
-
3Q
362
105
75
182
-
4Q
254
85
64
105
-
1Q
354
93
75
186
-
2Q
398
127
85
185
-
3Q
393
159
82
152
-
4Q
287
121
75
90
-
1Q
224
125
73
26
-
2Q
159
103
64
-
(7)
3Q
53
17
36
-
4Q
39
-
39
-
1Q
31
-
31
-
2Q
FY16
Source: PPAC, Industry, MoPNG
26
-
26
-
3Q
Diesel
PDS Kerosene
Domestic LPG
Total
FY12
FY13
FY14
FY15
Exhibit 9: Petrol and Diesel are expected to grow at 8.4%/6.9% CAGR till FY22
MS
HSD
86.8
92.1
97.9
104.1
110.8
64.8
15.0
15.7
69.1
17.1
68.4
19.1
69.4
20.8
76.9
81.6
22.6
24.5
26.6
28.8
31.1
33.7
Source: PPAC, MOSL
Other key takeaways
Last five year refinery capex stood at INR62b at Mumbai and INR61b at Vizag
refinery.
Single point mooring has enabled HPCL to bring in VLCC’s at Vizag and it can
bring in Suez Max ships at Mumbai.
It has upgraded its lubes production capacity to produce better grade Group III
base oils.
India petroleum production growth remains robust with last five year CAGR of
3.7%, while HPCL’s marketing volumes grew at 4.9%.
Recent quarter GRM were boosted by better realizations on Bitumen (YTDFY16
domestic bitumen consumption grew at 14% YoY).
Indian lubricant market size is estimated at 2,800 TMT (FY15 estimate) which
includes 42% automotive, 23% transformer oil /white oils, 23% industrial oils,
4% greases and 8% process Oils. HPCL markets 478TMT (including base oil).
HPCL has 10,436 employees and average age for management cadre is 41 years
and non-management cadre is 50 years.
FY15 capex was at INR48.5b and next five year planned capex stands at
INR450b. This includes INR210b for refining, INR90b for marketing, INR10b for
renewables and INR140b for Joint ventures (refining, gas including LNG and
E&P).
HPCL’s standalone debt stands at INR199b (vs INR203b in March-15).
4 March 2016
4

HPCL
Valuation and view
Widening Moat:
OMCs’ economic moat is widening, led by (1) scope for
meaningful increase in marketing margins and profitability, (2) slower ramp-up
by private marketers, (3) high volume growth, aided by expected GDP boost,
and (4) improving balance sheet with increasing cash flow.
OMCs profit normalization was delayed for a decade:
OMC’s deregulation and
in turn their profit normalization had been derailed for a decade after an earlier
brief de-regulation period in 2004-06. However, this time around we believe
government will stay put with its deregulation decision given the hard lessons of
financial stress of last decade. Increased excise duties offer some flexibility to
moderate prices in event of spike in oil prices, but huge and growing India
consumption volumes will make it practically impossible to again revisit the
price control model.
Marketing division to drive profitability:
Post de-regulation, we expect
marketing division profitability to grow rapidly, hence should also command a
higher valuation. An INR0.5/ltr increase in petrol and diesel marketing margins
increases HPCL’s FY18E EPS by 25%. We model gross per liter diesel margin of
INR1.6/1.9/2.2 in FY16/FY17/FY18.
Pure play marketing companies trade at higher valuations:
Pure play petroleum marketing companies - US based CST Brands (CST US;
M Cap: USD2.4b) and New Zealand based Z Energy (ZEL NZ; M Cap:
USD1.5b) trade (1 year forward basis) at 10x EV/EBITDA.
These valuations (in-line with the underlying business dynamics) are more
similar to consumer business than refining or oil & gas.
Of the three OMCs, HPCL's earnings are more sensitive to a change in the
marketing margin-given its higher ratio of marketing-to-refining volume. Hence,
it would be the largest beneficiary of higher auto fuel margins.
HPCL trades at 6.7x/6.0x FY17E/FY18E EPS of INR111/INR125 and 1.2/1.0.x
FY17E/FY18E BV. We value HPCL at 5.5x for refining and 8x for marketing to
arrive at a fair value of INR1,299 implying a 73% upside. Dividend yield is very
attractive at ~5%. HPCL had a payout of 35% of standalone profits last year and
the same is likely to continue.
Maintain Buy.
4 March 2016
5

HPCL
Exhibit 10: HPCL – Key Assumptions
Exchange Rate (INR/USD)
Brent Crude (USD/bbl)
Market Sales (MMT)
YoY (%)
GRM (USD/bbl)
HPCL Blended GRM
Reuters Singapore GRM
Prem/(disc)
Refining capacity utilization (%)
Refinery throughput (mmt)
Total Refinery throughput (MMT)
Under recoveries Sharing (INRb)
Gross under recoveries
Net sharing
Net sharing (%)
FY09
45.8
84.8
25.4
3.8%
5.17
5.75
(0.58)
118%
16.5
213
(0.0)
0%
FY10
47.5
69.6
26.3
3.5%
2.97
3.55
(0.58)
116%
16.3
100
12.3
12%
FY11
45.7
86.5
27.0
2.9%
4.47
5.18
(0.70)
106%
15.8
171
15.1
9%
FY12
47.9
114.5
29.5
9.1%
5.20
8.17
(2.96)
99%
16.1
304
0.1
0%
FY13
54.5
110.6
30.3
2.8%
2.08
7.70
(5.62)
98%
15.8
362
2.3
1%
FY14
60.6
107.8
31.0
2.1%
3.43
5.62
(2.19)
95%
15.4
325
4.8
1%
FY15
61.1
86.0
32.0
3.2%
2.84
6.36
(3.52)
101%
16.4
164
5.0
3%
FY16E
65.4
50.0
33.7
5.5%
6.17
7.44
(1.28)
106%
17.1
24
-
0%
FY17E
67.0
50.0
35.1
4.0%
5.22
7.30
(2.08)
101%
16.3
24
-
0%
FY18E
69.0
60.0
36.5
4.0%
5.25
7.30
(2.05)
101%
16.3
30
-
0%
Source: Company, MOSL
Exhibit 11: HPCL is currently trading at 33% discount to its
last 10 years PE
PE (x)
27
22
17
12
7
2
9.3
Peak(x)
Avg(x)
24.6
Min(x)
Exhibit 12: BPCL is currently trading at 26% discount to its
last 10 years PE
PE (x)
27
19
11
11.5
4.6
8.2
Peak(x)
Avg(x)
Min(x)
28.3
2.6
6.2
3
Source: Bloomberg, MOSL
Exhibit 13: IOC is currently trading at 41% discount to its last
10 years PE
30
25
20
15
10
5
0
4.4
6.2
10.4
PE (x)
Peak(x)
Avg(x)
Min(x)
24.3
Exhibit 14: OMCs are currently trading at 28% discount to
their last 10 years PE
27
19
11
3
9.7
7.0
Source: Bloomberg, MOSL
Source: Company, MOSL
4 March 2016
6

HPCL
Story in charts
Exhibit 15: HPCL’s GRMs have underperformed Singapore
GRM (USD/bbl)
Prem/(Disc) to Singapore
Singapore GRM
7.7
8.2
3.6
3.0
(0.6)
5.2
4.5
(0.7)
5.2
2.1
(3.0)
FY12
(5.6)
FY13
FY14
3.4
(2.2)
5.6
HPCL Blended GRM
6.4
7.4
6.2
2.8
(3.5)
(1.3)
7.3
5.2
(2.1)
7.3
5.3
(2.1)
26
27
29
Exhibit 16: While refining capacity has been largely flat,
marketing sales have shown steady increase
Marketing Sales (mmt)
31
Refinery Throughput (mmt)
36
35
34
32
30
17
FY10
16
16
FY12
16
16
FY14
15
16
17
16
FY10
FY11
FY15 FY16E FY17E FY18E
Source: Company, MOSL
FY16E
FY18E
Source: Company, MOSL
Exhibit 17: HPCL FY14 EBITDA and PAT boosted by product
inventory gains and lower interest cost
EBITDA (INRb)
PAT (INRb)
70
52
25
13
FY10
33
34
39
9
15
9
FY12
17
FY14
27
54
33
38
78
86
Exhibit 18: Expect D/E ratio to decline with increasing
profitability (x)
D/E Ratio
1.8
2.0
2.3
2.4
2.1
42
1.1
1.0
0.9
0.8
FY16E
FY18E
FY10
FY12
FY14
FY16E
FY18E
Source: Company, MOSL
Exhibit 19: Diesel deregulation to reduce working capital
leading to lower interest costs
Total Debt (INRb)
17
9
18
15
7
298
FY12
325
FY13
319
FY14
171
Interest Cost (INRb)
Exhibit 20: HPCL: 1 Year Forward P/E Chart
PE (x)
27
22
17
12
9.3
2.6
6.2
7
2
Peak(x)
Avg(x)
24.6
Min(x)
9
6
188
6
188
6
188
213
FY10
250
FY11
FY15 FY16E FY17E FY18E
Source: Company, MOSL
4 March 2016
7

HPCL
Financials and Valuations
Income Statement
Y/E Mar
Net Sales
Change (%)
EBITDA
EBITDA Margin (%)
Depreciation
EBIT
Interest
Other Income
Extraordinary items
PBT
Tax
Tax Rate (%)
Min. Int. & Assoc. Share
Reported PAT
Adjusted PAT
Change (%)
2011
1,309,342
19.9
33,088
2.5
14,070
19,018
8,840
13,435
-152
23,461
8,071
34.4
0
15,390
15,390
18.3
2012
1,781,392
36.1
34,082
1.9
17,129
16,953
16,977
12,222
-5
12,192
3,077
25.2
0
9,115
9,115
-40.8
2013
2,065,293
15.9
39,424
1.9
19,315
20,109
18,377
12,300
714
14,746
5,699
38.6
0
9,047
9,047
-0.7
2014
2,231,454
8.0
52,081
2.3
21,884
30,197
15,046
11,004
0
26,155
8,817
33.7
0
17,338
17,338
91.6
2015
2,063,804
-7.5
54,176
2.6
19,712
34,465
7,066
14,142
0
41,541
14,209
34.2
0
27,333
27,333
57.6
2016E
1,867,924
-9.5
70,178
3.8
26,824
43,354
6,086
12,190
0
49,457
16,815
34.0
0
32,642
32,642
19.4
2017E
1,761,850
-5.7
77,856
4.4
28,125
49,731
5,828
13,316
0
57,219
19,454
34.0
0
37,764
37,764
15.7
(INR Million)
2018E
2,113,622
20.0
86,448
4.1
30,725
55,724
5,640
13,225
0
63,308
21,029
33.2
0
42,279
42,279
12.0
Balance Sheet
Y/E Mar
Share Capital
Reserves
Net Worth
Loans
Deferred Tax
Capital Employed
Gross Fixed Assets
Less: Depreciation
Net Fixed Assets
Capital WIP
Investments
Curr. Assets, L & Adv.
Inventory
Debtors
Cash & Bank Balance
Loans & Advances
Other Current Assets
Current Liab. & Prov.
Liabilities
Provisions
Net Current Assets
Application of Funds
2011
3,390
122,068
125,458
250,212
31,956
407,626
296,484
110,039
186,445
37,987
113,350
265,910
166,223
26,544
800
71,358
985
196,066
178,018
18,048
69,844
407,626
2012
3,390
127,835
131,225
298,312
30,853
460,390
334,590
126,094
208,496
44,445
103,705
354,427
194,545
35,652
2,264
116,484
5,483
250,683
230,847
19,836
103,744
460,390
2013
3,390
133,874
137,264
324,583
35,984
497,830
370,062
144,575
225,487
51,729
106,269
378,962
164,387
49,350
1,471
160,008
3,745
264,617
241,622
22,995
114,345
497,830
2014
3,390
146,732
150,122
319,301
39,084
508,506
424,668
165,545
259,122
45,856
108,598
362,204
187,754
54,660
347
114,693
4,750
267,275
243,978
23,296
94,930
508,506
2015
3,390
156,831
160,221
170,556
41,036
371,813
481,749
191,121
290,628
34,744
112,415
237,719
129,723
36,031
171
67,364
4,432
303,693
273,903
29,790
-65,974
371,813
2016E
3,390
177,853
181,244
188,000
41,036
410,280
530,493
217,946
312,548
30,000
112,415
254,721
133,502
33,469
23,255
60,064
4,432
299,404
268,125
31,279
-44,683
410,280
(INR Million)
2017E
3,390
202,375
205,765
188,000
46,759
440,524
594,493
246,070
348,423
8,000
112,415
265,344
131,100
31,568
38,180
60,064
4,432
293,659
260,815
32,844
-28,315
440,523
2018E
3,390
229,825
233,215
188,000
53,090
474,305
634,493
276,795
357,699
8,000
112,415
307,393
156,576
37,871
48,450
60,064
4,432
311,202
276,716
34,487
-3,809
474,304
4 March 2016
8

HPCL
Financials and Valuations
Ratios
Y/E Mar
Basic (INR)
EPS
Cash EPS
Book Value
DPS
Payout (incl. Div. Tax.)
Valuation(x)
P/E
Cash P/E
EV / EBITDA
EV / Sales
Price / Book Value
Dividend Yield (%)
Profitability Ratios (%)
RoE
RoCE
Turnover Ratios (%)
Asset Turnover (x)
Debtors (No. of Days)
Inventory (No. of Days)
Creditors (No. of Days)
Leverage Ratios (%)
Net Debt/Equity (x)
2.0
2011
33,088
10,913
-25,876
-5,645
-2,456
10,024
-46,101
-36,077
5,371
12,330
-28,400
0
30,408
-8,933
-4,731
16,744
-1,631
2,431
800
2.3
2012
34,082
16,632
-27,301
-2,715
-5,407
15,291
-41,359
-26,068
6,378
3,579
-31,401
0
37,919
-14,836
-5,509
17,574
1,464
800
2,264
2.4
2013
39,424
14,859
-30,945
-1,072
-10,771
11,496
-36,807
-25,312
-2,404
15,383
-23,828
0
37,072
-22,187
-3,344
11,540
-793
2,264
1,471
2.1
2014
52,081
9,322
21,121
-3,668
-1,556
77,301
-41,358
35,943
-1,297
10,289
-32,365
0
-25,648
-17,045
-3,367
-46,060
-1,124
1,471
347
1.1
2015
54,176
14,142
124,486
-7,622
-6,772
178,411
-41,762
136,649
4,161
-3,396
-40,997
0
-123,807
-7,647
-6,136
-137,590
-176
347
171
0.9
2016E
70,178
12,190
1,794
-16,815
-6,289
61,057
-44,000
17,057
0
6,210
-37,790
0
17,444
-6,086
-11,621
-264
23,003
171
23,174
0.7
2017E
77,856
13,316
-1,444
-13,733
-7,763
68,232
-42,000
26,232
0
7,763
-34,237
0
0
-5,828
-13,247
-19,075
14,920
23,174
38,094
0.6
2018E
86,448
13,225
-14,236
-14,699
-8,617
62,121
-40,000
22,121
0
8,617
-31,383
0
0
-5,640
-14,834
-20,474
10,264
38,094
48,358
4.8
7
0
0
5.6
6
0
0
5.9
8
0
0
5.6
9
0
0
4.6
8
0
0
3.7
7
0
0
3.1
7
0
0
3.4
6
0
0
12.8
8.6
7.1
6.7
6.7
6.8
12.1
8.2
17.6
11.0
19.1
14.2
19.5
14.8
19.3
15.1
27.8
9.7
14.0
0.3
1.9
1.1
28.1
9.0
12.9
0.2
1.8
1.1
14.6
6.5
9.7
0.2
1.7
2.1
9.3
5.4
6.5
0.2
1.6
3.3
7.8
4.3
4.9
0.2
1.4
3.9
6.7
3.9
4.3
0.2
1.2
4.5
6.0
3.5
3.9
0.2
1.1
5.0
45.4
86.9
370.1
14.0
36.1
26.9
77.4
387.1
8.5
37.0
26.7
83.7
404.9
8.5
37.3
51.1
115.7
442.8
15.5
35.5
80.6
138.8
472.6
24.5
35.6
96.3
175.4
534.6
29.3
35.6
111.4
194.4
607.0
33.4
35.1
124.7
215.4
687.9
37.4
35.1
2011
2012
2013
2014
2015
2016E
2017E
2018E
Cash Flow Statement
Y/E Mar
Adjusted EBITDA
Non cash opr. exp (inc)
(Inc)/Dec in Wkg. Cap.
Tax Paid
Other operating activities
CF from Op. Activity
(Inc)/Dec in FA & CWIP
Free cash flows
(Pur)/Sale of Invt
Others
CF from Inv. Activity
Inc/(Dec) in Net Worth
Inc / (Dec) in Debt
Interest Paid
Divd Paid (incl Tax) & Others
CF from Fin. Activity
Inc/(Dec) in Cash
Add: Opening Balance
Closing Balance
(INR Million)
4 March 2016
9

This document has been prepared by Motilal Oswal Securities Limited (hereinafter referred to as Most) to provide information about the company(ies) and/sector(s), if any, covered in the report and may be distributed by it and/or its
HPCL
affiliated company(ies). This report is for personal information of the selected recipient/s and does not construe to be any investment, legal or taxation advice to you. This research report does not constitute an offer, invitation or
inducement to invest in securities or other investments and Motilal Oswal Securities Limited (hereinafter referred as MOSt) is not soliciting any action based upon it. This report is not for public distribution and has been furnished to
you solely for your general information and should not be reproduced or redistributed to any other person in any form. This report does not constitute a personal recommendation or take into account the particular investment
objectives, financial situations, or needs of individual clients. Before acting on any advice or recommendation in this material, investors should consider whether it is suitable for their particular circumstances and, if necessary, seek
professional advice. The price and value of the investments referred to in this material and the income from them may go down as well as up, and investors may realize losses on any investments. Past performance is not a guide for
future performance, future returns are not guaranteed and a loss of original capital may occur.
MOSt and its affiliates are a full-service, integrated investment banking, investment management, brokerage and financing group. We and our affiliates have investment banking and other business relationships with a some
companies covered by our Research Department. Our research professionals may provide input into our investment banking and other business selection processes. Investors should assume that MOSt and/or its affiliates are
seeking or will seek investment banking or other business from the company or companies that are the subject of this material and that the research professionals who were involved in preparing this material may educate investors
on investments in such business . The research professionals responsible for the preparation of this document may interact with trading desk personnel, sales personnel and other parties for the purpose of gathering, applying and
interpreting information. Our research professionals are paid on twin parameters of performance & profitability of MOSt.
MOSt generally prohibits its analysts, persons reporting to analysts, and members of their households from maintaining a financial interest in the securities or derivatives of any companies that the analysts cover. Additionally, MOSt
generally prohibits its analysts and persons reporting to analysts from serving as an officer, director, or advisory board member of any companies that the analysts cover. Our salespeople, traders, and other professionals or affiliates
may provide oral or written market commentary or trading strategies to our clients that reflect opinions that are contrary to the opinions expressed herein, and our proprietary trading and investing businesses may make investment
decisions that are inconsistent with the recommendations expressed herein. In reviewing these materials, you should be aware that any or all of the foregoing among other things, may give rise to real or potential conflicts of interest.
MOSt and its affiliated company(ies), their directors and employees and their relatives may; (a) from time to time, have a long or short position in, act as principal in, and buy or sell the securities or derivatives thereof of companies
mentioned herein. (b) be engaged in any other transaction involving such securities and earn brokerage or other compensation or act as a market maker in the financial instruments of the company(ies) discussed herein or act as an
advisor or lender/borrower to such company(ies) or may have any other potential conflict of interests with respect to any recommendation and other related information and opinions.; however the same shall have no bearing
whatsoever on the specific recommendations made by the analyst(s), as the recommendations made by the analyst(s) are completely independent of the views of the affiliates of MOSt even though there might exist an inherent
conflict of interest in some of the stocks mentioned in the research report .Reports based on technical and derivative analysis center on studying charts company's price movement, outstanding positions and trading volume, as
opposed to focusing on a company's fundamentals and, as such, may not match with a report on a company's fundamental analysis. In addition MOST has different business segments / Divisions with independent research
separated by Chinese walls catering to different set of customers having various objectives, risk profiles, investment horizon, etc, and therefore may at times have different contrary views on stocks sectors and markets.
Unauthorized disclosure, use, dissemination or copying (either whole or partial) of this information, is prohibited. The person accessing this information specifically agrees to exempt MOSt or any of its affiliates or employees from,
any and all responsibility/liability arising from such misuse and agrees not to hold MOSt or any of its affiliates or employees responsible for any such misuse and further agrees to hold MOSt or any of its affiliates or employees free
and harmless from all losses, costs, damages, expenses that may be suffered by the person accessing this information due to any errors and delays. The information contained herein is based on publicly available data or other
sources believed to be reliable. Any statements contained in this report attributed to a third party represent MOSt’s interpretation of the data, information and/or opinions provided by that third party either publicly or through a
subscription service, and such use and interpretation have not been reviewed by the third party. This Report is not intended to be a complete statement or summary of the securities, markets or developments referred to in the
document. While we would endeavor to update the information herein on reasonable basis, MOSt and/or its affiliates are under no obligation to update the information. Also there may be regulatory, compliance, or other reasons that
may prevent MOSt and/or its affiliates from doing so. MOSt or any of its affiliates or employees shall not be in any way responsible and liable for any loss or damage that may arise to any person from any inadvertent error in the
information contained in this report. MOSt or any of its affiliates or employees do not provide, at any time, any express or implied warranty of any kind, regarding any matter pertaining to this report, including without limitation the
implied warranties of merchantability, fitness for a particular purpose, and non-infringement. The recipients of this report should rely on their own investigations.
This report is intended for distribution to institutional investors. Recipients who are not institutional investors should seek advice of their independent financial advisor prior to taking any investment decision based on this report or for
any necessary explanation of its contents.
Most and it’s associates may have managed or co-managed public offering of securities, may have received compensation for investment banking or merchant banking or brokerage services, may have received any compensation
for products or services other than investment banking or merchant banking or brokerage services from the subject company in the past 12 months.
Most and it’s associates have not received any compensation or other benefits from the subject company or third party in connection with the research report.
Subject Company may have been a client of Most or its associates during twelve months preceding the date of distribution of the research report
MOSt and/or its affiliates and/or employees may have interests/positions, financial or otherwise of over 1 % at the end of the month immediately preceding the date of publication of the research in the securities mentioned in this
report. To enhance transparency, MOSt has incorporated a Disclosure of Interest Statement in this document. This should, however, not be treated as endorsement of the views expressed in the report.
Motilal Oswal Securities Limited is registered as a Research Analyst under SEBI (Research Analyst) Regulations, 2014. SEBI Reg. No. INH000000412
There are no material disciplinary action that been taken by any regulatory authority impacting equity research analysis activities
Disclosures
Analyst Certification
The views expressed in this research report accurately reflect the personal views of the analyst(s) about the subject securities or issues, and no part of the compensation of the research analyst(s) was, is, or will be directly or
indirectly related to the specific recommendations and views expressed by research analyst(s) in this report. The research analysts, strategists, or research associates principally responsible for preparation of MOSt research receive
compensation based upon various factors, including quality of research, investor client feedback, stock picking, competitive factors and firm revenues
Disclosure of Interest Statement
Analyst ownership of the stock
Served as an officer, director or employee
HPCL
No
No
A graph of daily closing prices of securities is available at www.nseindia.com and http://economictimes.indiatimes.com/markets/stocks/stock-quotes
Regional Disclosures (outside India)
For U.S.
This report is not directed or intended for distribution to or use by any person or entity resident in a state, country or any jurisdiction, where such distribution, publication, availability or use would be contrary to law, regulation or which
would subject MOSt & its group companies to registration or licensing requirements within such jurisdictions.
Motilal Oswal Securities Limited (MOSL) is not a registered broker - dealer under the U.S. Securities Exchange Act of 1934, as amended (the"1934 act") and under applicable state laws in the United States. In addition MOSL is not a
registered investment adviser under the U.S. Investment Advisers Act of 1940, as amended (the "Advisers Act" and together with the 1934 Act, the "Acts), and under applicable state laws in the United States. Accordingly, in the
absence of specific exemption under the Acts, any brokerage and investment services provided by MOSL, including the products and services described herein are not available to or intended for U.S. persons.
This report is intended for distribution only to "Major Institutional Investors" as defined by Rule 15a-6(b)(4) of the Exchange Act and interpretations thereof by SEC (henceforth referred to as "major institutional investors"). This
document must not be acted on or relied on by persons who are not major institutional investors. Any investment or investment activity to which this document relates is only available to major institutional investors and will be
engaged in only with major institutional investors. In reliance on the exemption from registration provided by Rule 15a-6 of the U.S. Securities Exchange Act of 1934, as amended (the "Exchange Act") and interpretations thereof by
the U.S. Securities and Exchange Commission ("SEC") in order to conduct business with Institutional Investors based in the U.S., MOSL has entered into a chaperoning agreement with a U.S. registered broker-dealer, Motilal Oswal
Securities International Private Limited. ("MOSIPL"). Any business interaction pursuant to this report will have to be executed within the provisions of this chaperoning agreement.
The Research Analysts contributing to the report may not be registered /qualified as research analyst with FINRA. Such research analyst may not be associated persons of the U.S. registered broker-dealer, MOSIPL, and therefore,
may not be subject to NASD rule 2711 and NYSE Rule 472 restrictions on communication with a subject company, public appearances and trading securities held by a research analyst account.
For Hong Kong:
This report is distributed in Hong Kong by Motilal Oswal capital Markets (Hong Kong) Private Limited, a licensed corporation (CE AYY-301) licensed and regulated by the Hong Kong Securities and Futures Commission (SFC)
pursuant to the Securities and Futures Ordinance (Chapter 571 of the Laws of Hong Kong) “SFO”. As per SEBI (Research Analyst Regulations) 2014 Motilal Oswal Securities (SEBI Reg No. INH000000412) has an agreement with
Motilal Oswal capital Markets (Hong Kong) Private Limited for distribution of research report in Kong Kong. This report is intended for distribution only to “Professional Investors” as defined in Part I of Schedule 1 to SFO. Any
investment or investment activity to which this document relates is only available to professional investor and will be engaged only with professional investors.” Nothing here is an offer or solicitation of these securities, products and
services in any jurisdiction where their offer or sale is not qualified or exempt from registration. The Indian Analyst(s) who compile this report is/are not located in Hong Kong & are not conducting Research Analysis in Hong Kong.
For Singapore
Motilal Oswal Capital Markets Singapore Pte Limited is acting as an exempt financial advisor under section 23(1)(f) of the Financial Advisers Act(FAA) read with regulation 17(1)(d) of the Financial Advisors Regulations and is a
subsidiary of Motilal Oswal Securities Limited in India. This research is distributed in Singapore by Motilal Oswal Capital Markets Singapore Pte Limited and it is only directed in Singapore to accredited investors, as defined in the
Financial Advisers Regulations and the Securities and Futures Act (Chapter 289), as amended from time to time.
In respect of any matter arising from or in connection with the research you could contact the following representatives of Motilal Oswal Capital Markets Singapore Pte Limited:
Kadambari Balachandran
Email : kadambari.balachandran@motilaloswal.com
Contact : (+65) 68189233 / 65249115
Office Address : 21 (Suite 31),16 Collyer Quay,Singapore 04931
Motilal Oswal Tower, Level 9, Sayani Road, Prabhadevi, Mumbai 400 025
Phone: +91 22 3982 5500 E-mail: reports@motilaloswal.com
Motilal Oswal Securities Ltd
4 March 2016
10