21 March 2016
Update
| Sector:
Consumer
ITC
Buy
BSE SENSEX
25,285
S&P CNX
7,704
CMP: INR330
TP: INR365 (+11%)
Price hikes in KSFT as expected; volume driven strategy at play
Reduced pictorial warnings on the anvil?
Stock Info
Bloomberg
Equity Shares (m)
52-Week Range (INR)
1, 6, 12 Rel. Per (%)
M.Cap. (INR b)
M.Cap. (USD b)
Avg Val ( INR m)
Free float (%)
ITC IN
8,038.3
360/268
2/7/11
2,652.6
39.9
2,658
100.0
Financials Snapshot (INR b)
Y/E Mar
2016E 2017E 2018E
Net Sales
362.7 394.2 435.7
EBITDA
140.8 156.3 173.8
PAT
98.7 111.7 127.2
EPS (INR)
12.3
13.9
15.9
Gr. (%)
2.7
13.1
14.0
BV/Sh (INR)
42.7
47.7
53.4
RoE (%)
30.4
30.8
31.4
RoCE (%)
38.4
38.8
39.3
P/E (x)
24.0
21.2
18.6
P/BV (x)
6.9
6.2
5.5
Shareholding pattern (%)
As On
Promoter
DII
FII
Others
Dec-15 Sep-15 Dec-14
0.0
35.2
21.0
43.8
0.0
35.1
21.0
43.9
0.0
34.8
21.0
44.2
As highlighted in our earlier communication dated 7
th
March, ITC has
implemented ~13% price hikes in King Size Filter segment.
ITC’s focus on Cig volume growth is quite evident as there is no price hike in
RSFT (Regular Size Filters) and <65mm segment as of now as per our
distributor checks. We expect price hikes in RSFT segment in next six
months. However <64mm may not see any hike this year given the
consistent increase in share of illicit Cigarettes to ~18% and price sensitive
nature of the segment.
FY17 Cig volumes could stabilize given the relatively benign excise increase
and a consequent benign Cigarette price hike calendar, in our view.
We like ITC’s Cig. Volume focus and a staggered pricing approach. Cigarette
volume recovery will be an important driver for multiple re-rating in the
near term. Maintain BUY with a TP of INR 365 (23x FY18 EPS). We see upside
risks and a strong possibility of ITC trading at 25x P/E if Cig volumes recover
in next few quarters.
13% price hikes in King Size Cigarettes:
As highlighted in our earlier
communications, ITC has implemented a 13% price hike in King Size Cigarettes
with both Classic and Gold Flake Kings prices revised upwards from INR 218 to
INR 246 for a pack of 20 sticks. In some states with higher Cig. VAT, prices are
revised to INR 250/20 sticks. This price hike amounts to ~3.5% on ITC’s total
Cig portfolio on a weighted average basis.
No price hike in RSFT and DSFT; volume focus strategy:
Our distributor
checks do not suggest any increase in prices in the RSFT (~ 70% of volumes)
and DSFT (~ 15% of volumes) segments at the moment. We expect price hikes
in RSFT in next six months but no price change in DSFT this year. In our view,
ITC is prioritizing Cig volumes in FY17 and thus price hikes in rest of the
segments will be staggered. Secondly, the persistent price hikes of last 3-4
years post the aggressive excise increases have driven the share of illicit
Cigarettes to ~18-20% vs. ~9% eight years back. Therefore a price hike in
64mm at this stage may drive volumes further towards illicit segment (entry
level pricing for 64mm segment stands at INR 3/stick).
FII Includes depository receipts
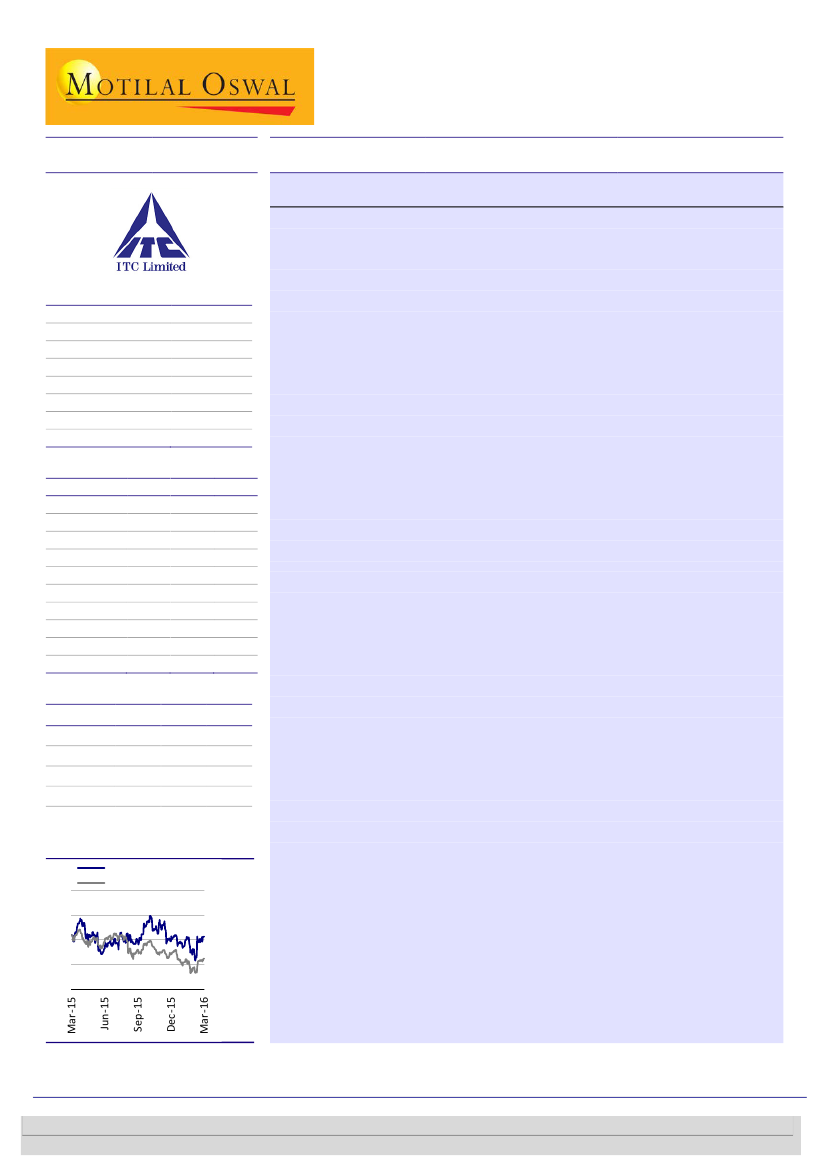
Stock Performance (1-year)
ITC
Sensex - Rebased
400
360
320
280
240
Gautam Duggad
(Gautam.Duggad@MotilalOswal.com); +91 22 3982 5404
Vishal Punmiya
(Vishal.Punmiya@MotilalOswal.com); +91 22 3980 4261
Investors are advised to refer through important disclosures made at the last page of the Research Report.
Motilal Oswal research is available on www.motilaloswal.com/Institutional-Equities, Bloomberg, Thomson Reuters, Factset and S&P Capital.

ITC
Pictorial warnings may not be as drastic as earlier envisaged?
As per media
reports, the government parliamentary panel constituted to look into the issue
of pictorial warnings seems to have suggested the pictorial warnings at 50% of
pack size instead of the earlier recommended 85% (Source:
http://www.dnaindia.com/india/report-parliament-panel-suggests-reducing-size-
of-pictorial-warnings-on-tobacco-products-2188819).
Currently the pictorial
warnings form 40% of pack size). While size of pictorial warnings may not have
material impact given 70% of Cigarette sales in India happen via loose sticks, it
nonetheless signals some sort of rationality in the policymaking in our view.
Staggered pricing could help stabilize Cig volumes; Maintain BUY:
The subtle
change in strategy towards driving volumes vs. prices and a relatively benign
budget can aid the multiple re-rating for ITC, in our view. The recent news flow
around reduction in the size for pictorial warnings from earlier proposed 85% to
50% also suggests some sort of rationality in the policymaking. Maintain
Buy with a TP of INR 365 (23x FY18 EPS, unchanged 15% discount to three year
average P/E). We see upside risks and a strong possibility of ITC trading at 25x
P/E if Cig volumes recover in next few quarters.
Downside risks to our rating:
a) Sharp VAT increase by state governments b)
Incremental non-tax punitive actions by government and c) Acceptance of 40%
GST rate for Cigarette (unlikely in our view).
Valuation Matrix of coverage universe
Company
Consumer
Asian Paints
Britannia
Colgate
Dabur*
Emami*
Neutral
Buy
Neutral
Neutral
Buy
871 12,517
2,693 4,840
836 3,407
248 6,526
941 3,200
1,290 6,585
5,898 3,717
849 27,537
330 39,023
283
768
245 4,739
5,089 7,354
11,405 1,907
595 4,573
95
189
2,526 5,502
1,141 1,121
346
426
340 4,520
27.0
49.8
7.1
15.0
15.1
24.5
20.0
5.0
2.7
26.4
25.8
-21.4
21.0
48.5
-3.0
LP
6.8
32.6
-7.2
15.1
18.9
14.3
16.2
22.6
20.0
15.6
10.9
13.1
-8.7
15.5
22.2
25.0
10.2
31.5
76.9
48.0
35.8
20.9
9.9
14.0
14.1
12.5
16.9
14.4
9.4
14.2
14.0
12.6
12.4
21.1
31.3
15.1
28.9
46.6
41.2
39.7
13.2
46.2
37.5
38.0
35.5
38.2
38.9
35.4
46.2
26.3
31.9
43.9
50.1
53.6
40.0
14.8
87.9
63.1
53.4
39.5
40.2
31.6
33.2
30.5
31.2
32.4
30.6
41.7
23.3
34.9
38.0
41.0
42.9
36.3
11.3
49.7
42.6
39.3
32.7
36.5
27.7
29.1
27.1
26.6
28.3
28.0
36.5
20.4
31.0
33.8
33.8
32.7
31.6
8.7
33.9
30.2
28.2
28.8
31.6
26.1
23.2
28.3
31.7
29.3
25.1
31.9
17.2
26.4
29.4
29.7
33.5
25.0
9.8
40.9
25.4
13.2
29.7
27.0
21.3
20.6
24.1
26.2
24.8
21.3
29.2
15.3
22.2
25.2
24.2
27.2
22.0
8.1
29.6
18.3
11.3
24.3
24.3
18.2
18.5
21.4
22.4
22.4
18.8
25.7
13.6
19.6
22.2
20.2
21.0
19.0
6.7
22.1
13.5
9.3
21.3
35.2
57.8
72.6
33.0
40.6
23.2
30.5
110.3
30.4
19.6
35.5
34.2
46.9
29.8
9.5
48.1
16.1
6.8
21.2
1.1
0.9
1.8
1.0
1.1
0.8
1.1
2.0
2.4
1.4
0.8
1.5
0.8
0.7
1.0
0.0
0.4
0.4
0.8
Reco
Price
MCap
EPS Growth YoY (%)
FY17E
FY18E
FY16E
P/E (x)
FY17E
FY18E
EV/EBITDA (x)
FY16E
FY17E
FY18E
RoE (%) Div. (%)
FY16E
FY16E
(INR) (USD m) FY16E
Godrej Consum Neutral
GSK Consumer Buy
Hind. Unilever
ITC
Jyothy Labs
Marico*
Nestle
Pidilite Inds.
United Spirits
Retail
Jubi. Foodworks Buy
Shopper's Stop Neutral
Titan Company Neutral
Neutral
Buy
Buy
Neutral
Neutral
Buy
Buy
Page Industries Buy
Radico Khaitan Buy
Source: Company, MOSL
21 March 2016
2

ITC
Financials and Valuations
Income Statement
Y/E Mar
Net Sales
Change (%)
EBITDA
EBITDA Margin (%)
Depreciation
EBIT
Interest
Other Income
Extraordinary items
PBT
Tax
Tax Rate (%)
Min. Int. & Assoc. Share
Reported PAT
Adjusted PAT
Change (%)
2011
214,590
16.7
74,123
34.5
6,560
67,563
679
5,798
0
72,682
22,806
31.4
0
49,876
49,876
22.6
2012
251,475
17.2
88,687
35.3
6,985
81,702
980
8,253
0
88,975
27,352
30.7
0
61,624
61,624
23.6
2013
299,013
18.9
106,470
35.6
7,956
98,514
1,059
9,387
0
106,842
32,658
30.6
0
74,184
74,184
20.4
2014
332,386
11.2
124,755
37.5
8,999
115,756
236
11,071
0
126,591
38,739
30.6
0
87,852
87,852
18.4
2015
365,074
9.8
134,946
37.0
9,617
125,328
785
15,431
0
139,975
43,898
31.4
0
96,077
96,077
9.4
2016E
365,858
0.2
140,784
38.5
10,571
130,213
489
17,565
0
147,288
48,605
33.0
0
98,683
98,683
2.7
2017E
397,691
8.7
156,289
39.3
11,956
144,334
520
20,386
0
164,199
52,544
32.0
0
111,655
111,655
13.1
(INR Million)
2018E
439,555
10.5
173,841
39.5
13,106
160,735
503
22,847
0
183,079
55,839
30.5
0
127,240
127,240
14.0
Balance Sheet
Y/E Mar
Share Capital
Reserves
Net Worth
Debt
Deferred Tax
Total Capital Employed
Gross Fixed Assets
Less: Acc Depreciation
Net Fixed Assets
Capital WIP
Investments
Current Assets
Inventory
Debtors
Cash & Bank
Loans & Adv, Others
Curr Liabs & Provns
Curr. Liabilities
Provisions
Net Current Assets
Total Assets
2011
7,738
151,795
159,533
343
8,019
167,894
127,658
44,208
83,451
13,334
55,547
97,901
52,692
8,851
22,432
13,926
82,338
47,904
34,435
15,563
167,894
2012
7,818
180,101
187,919
119
8,727
196,765
138,033
48,197
89,837
23,923
63,166
112,957
56,378
9,824
28,189
18,565
93,117
57,934
35,183
19,840
196,765
2013
7,902
214,977
222,879
113
12,037
235,029
165,884
54,698
111,186
15,786
70,603
142,600
66,002
11,633
36,150
28,815
105,146
63,661
41,485
37,454
235,029
2014
7,953
254,667
262,620
155
12,970
275,745
181,756
62,269
119,487
23,598
88,234
160,975
73,595
21,654
32,894
32,832
116,549
68,830
47,719
44,426
275,745
2015
8,016
299,341
307,357
143
16,316
323,816
209,908
72,136
137,771
25,155
84,055
194,976
78,368
17,224
75,886
23,498
118,140
68,043
50,097
76,835
323,816
2016E
8,016
334,522
342,537
143
11,585
354,266
234,908
82,707
152,201
25,155
102,010
197,596
78,992
19,873
72,535
26,196
122,697
68,421
54,276
74,900
354,266
(INR Million)
2017E
8,016
374,327
382,343
143
6,315
388,801
259,908
94,663
165,245
25,155
120,052
215,514
85,488
21,600
80,320
28,106
137,165
75,755
61,410
78,349
388,801
2018E
8,016
419,688
427,704
143
1,360
429,207
284,908
107,769
177,139
25,155
143,015
236,662
92,742
23,874
89,931
30,115
152,765
82,783
69,982
83,897
429,207
21 March 2016
3

ITC
Financials and Valuations
Ratios
Y/E Mar
Basic (INR)
EPS
Cash EPS
Book Value
DPS
Payout (incl. Div. Tax.)
Valuation(x)
P/E
Cash P/E
Price / Book Value
EV/Sales
EV/EBITDA
Dividend Yield (%)
Profitability Ratios (%)
RoE
RoCE
Turnover Ratios (%)
Asset Turnover (x)
Debtors (No. of Days)
Leverage Ratios (%)
Net Debt/Equity (x)
-0.1
2011
74,123
607
-4,522
-22,806
0
47,402
-11,224
36,178
1,722
0
-9,502
5,220
183
-679
-31,455
-26,731
11,170
11,263
22,432
-0.1
2012
88,687
2,996
1,480
-27,352
1
65,812
-20,964
44,848
-7,619
0
-28,583
7,650
-224
-980
-37,918
-31,472
5,757
22,432
28,189
-0.2
2013
106,470
1,454
-9,654
-32,658
2
65,614
-19,714
45,900
-7,437
0
-27,151
9,223
-6
-1,059
-38,660
-30,502
7,961
28,189
36,150
-0.1
2014
124,755
1,428
-10,228
-38,739
3
77,220
-23,684
53,535
-17,631
0
-41,316
6,911
43
-236
-45,877
-39,160
-3,256
36,150
32,894
-0.2
2015
134,946
-250
10,583
-43,898
0
101,381
-29,709
71,673
4,180
0
-25,529
9,788
-12
-785
-41,851
-32,859
42,993
32,894
75,887
-0.2
2016E
140,784
0
-1,416
-48,605
0
90,763
-25,000
65,763
-17,956
0
-42,956
0
0
-489
-50,669
-51,159
-3,351
75,886
72,535
-0.2
2017E
156,289
0
4,336
-52,544
0
108,082
-25,000
83,082
-18,042
0
-43,042
0
0
-520
-56,734
-57,254
7,785
72,535
80,320
-0.2
2018E
173,841
0
4,062
-55,839
0
122,064
-25,000
97,064
-22,963
0
-47,963
0
0
-503
-63,986
-64,490
9,611
80,320
89,931
1.3
15.0
1.3
13.7
1.3
13.2
1.2
18.5
1.1
19.7
1.0
18.7
1.0
19.2
1.0
19.0
33.2
42.7
35.5
44.8
36.1
45.6
36.2
45.3
33.7
41.8
30.4
38.4
30.8
38.8
31.4
39.3
26.8
24.3
9.0
6.9
18.1
2.4
24.7
22.4
7.7
6.1
16.4
2.5
24.0
21.7
6.9
6.1
15.6
2.7
21.2
19.2
6.2
5.5
13.9
3.0
18.6
16.9
5.5
4.9
12.3
3.5
6.4
7.3
20.6
5.2
80.2
7.9
8.8
24.0
5.2
66.4
9.4
10.4
28.2
6.1
65.4
11.0
12.2
33.0
7.0
63.5
12.0
13.2
38.3
7.5
62.8
12.3
13.6
42.7
7.9
64.4
13.9
15.4
47.7
9.0
64.4
15.9
17.5
53.4
10.2
64.4
2011
2012
2013
2014
2015
2016E
2017E
2018E
Cash Flow Statement
Y/E Mar
Adjusted EBITDA
Non cash opr. exp (inc)
(Inc)/Dec in Wkg. Cap.
Tax Paid
Other operating activities
CF from Op. Activity
(Inc)/Dec in FA & CWIP
Free cash flows
(Pur)/Sale of Invt
Others
CF from Inv. Activity
Inc/(Dec) in Net Worth
Inc / (Dec) in Debt
Interest Paid
Divd Paid (incl Tax) & Others
CF from Fin. Activity
Inc/(Dec) in Cash
Add: Opening Balance
Closing Balance
(INR Million)
21 March 2016
4

ITC
NOTES
21 March 2016
5

This document has been prepared by Motilal Oswal Securities Limited (hereinafter referred to as Most) to provide information about the company(ies) and/sector(s), if any, covered in the report and may be distributed by it and/or its
ITC
affiliated company(ies). This report is for personal information of the selected recipient/s and does not construe to be any investment, legal or taxation advice to you. This research report does not constitute an offer, invitation or
inducement to invest in securities or other investments and Motilal Oswal Securities Limited (hereinafter referred as MOSt) is not soliciting any action based upon it. This report is not for public distribution and has been furnished to
you solely for your general information and should not be reproduced or redistributed to any other person in any form. This report does not constitute a personal recommendation or take into account the particular investment
objectives, financial situations, or needs of individual clients. Before acting on any advice or recommendation in this material, investors should consider whether it is suitable for their particular circumstances and, if necessary, seek
professional advice. The price and value of the investments referred to in this material and the income from them may go down as well as up, and investors may realize losses on any investments. Past performance is not a guide for
future performance, future returns are not guaranteed and a loss of original capital may occur.
MOSt and its affiliates are a full-service, integrated investment banking, investment management, brokerage and financing group. We and our affiliates have investment banking and other business relationships with a some
companies covered by our Research Department. Our research professionals may provide input into our investment banking and other business selection processes. Investors should assume that MOSt and/or its affiliates are
seeking or will seek investment banking or other business from the company or companies that are the subject of this material and that the research professionals who were involved in preparing this material may educate investors
on investments in such business . The research professionals responsible for the preparation of this document may interact with trading desk personnel, sales personnel and other parties for the purpose of gathering, applying and
interpreting information. Our research professionals are paid on twin parameters of performance & profitability of MOSt.
MOSt generally prohibits its analysts, persons reporting to analysts, and members of their households from maintaining a financial interest in the securities or derivatives of any companies that the analysts cover. Additionally, MOSt
generally prohibits its analysts and persons reporting to analysts from serving as an officer, director, or advisory board member of any companies that the analysts cover. Our salespeople, traders, and other professionals or affiliates
may provide oral or written market commentary or trading strategies to our clients that reflect opinions that are contrary to the opinions expressed herein, and our proprietary trading and investing businesses may make investment
decisions that are inconsistent with the recommendations expressed herein. In reviewing these materials, you should be aware that any or all of the foregoing among other things, may give rise to real or potential conflicts of interest.
MOSt and its affiliated company(ies), their directors and employees and their relatives may; (a) from time to time, have a long or short position in, act as principal in, and buy or sell the securities or derivatives thereof of companies
mentioned herein. (b) be engaged in any other transaction involving such securities and earn brokerage or other compensation or act as a market maker in the financial instruments of the company(ies) discussed herein or act as an
advisor or lender/borrower to such company(ies) or may have any other potential conflict of interests with respect to any recommendation and other related information and opinions.; however the same shall have no bearing
whatsoever on the specific recommendations made by the analyst(s), as the recommendations made by the analyst(s) are completely independent of the views of the affiliates of MOSt even though there might exist an inherent
conflict of interest in some of the stocks mentioned in the research report .Reports based on technical and derivative analysis center on studying charts company's price movement, outstanding positions and trading volume, as
opposed to focusing on a company's fundamentals and, as such, may not match with a report on a company's fundamental analysis. In addition MOST has different business segments / Divisions with independent research
separated by Chinese walls catering to different set of customers having various objectives, risk profiles, investment horizon, etc, and therefore may at times have different contrary views on stocks sectors and markets.
Unauthorized disclosure, use, dissemination or copying (either whole or partial) of this information, is prohibited. The person accessing this information specifically agrees to exempt MOSt or any of its affiliates or employees from,
any and all responsibility/liability arising from such misuse and agrees not to hold MOSt or any of its affiliates or employees responsible for any such misuse and further agrees to hold MOSt or any of its affiliates or employees free
and harmless from all losses, costs, damages, expenses that may be suffered by the person accessing this information due to any errors and delays. The information contained herein is based on publicly available data or other
sources believed to be reliable. Any statements contained in this report attributed to a third party represent MOSt’s interpretation of the data, information and/or opinions provided by that third party either publicly or through a
subscription service, and such use and interpretation have not been reviewed by the third party. This Report is not intended to be a complete statement or summary of the securities, markets or developments referred to in the
document. While we would endeavor to update the information herein on reasonable basis, MOSt and/or its affiliates are under no obligation to update the information. Also there may be regulatory, compliance, or other reasons that
may prevent MOSt and/or its affiliates from doing so. MOSt or any of its affiliates or employees shall not be in any way responsible and liable for any loss or damage that may arise to any person from any inadvertent error in the
information contained in this report. MOSt or any of its affiliates or employees do not provide, at any time, any express or implied warranty of any kind, regarding any matter pertaining to this report, including without limitation the
implied warranties of merchantability, fitness for a particular purpose, and non-infringement. The recipients of this report should rely on their own investigations.
This report is intended for distribution to institutional investors. Recipients who are not institutional investors should seek advice of their independent financial advisor prior to taking any investment decision based on this report or for
any necessary explanation of its contents.
Most and it’s associates may have managed or co-managed public offering of securities, may have received compensation for investment banking or merchant banking or brokerage services, may have received any compensation
for products or services other than investment banking or merchant banking or brokerage services from the subject company in the past 12 months.
Most and it’s associates have not received any compensation or other benefits from the subject company or third party in connection with the research report.
Subject Company may have been a client of Most or its associates during twelve months preceding the date of distribution of the research report
MOSt and/or its affiliates and/or employees may have interests/positions, financial or otherwise of over 1 % at the end of the month immediately preceding the date of publication of the research in the securities mentioned in this
report. To enhance transparency, MOSt has incorporated a Disclosure of Interest Statement in this document. This should, however, not be treated as endorsement of the views expressed in the report.
Motilal Oswal Securities Limited is registered as a Research Analyst under SEBI (Research Analyst) Regulations, 2014. SEBI Reg. No. INH000000412
There are no material disciplinary action that been taken by any regulatory authority impacting equity research analysis activities
Disclosures
Analyst Certification
The views expressed in this research report accurately reflect the personal views of the analyst(s) about the subject securities or issues, and no part of the compensation of the research analyst(s) was, is, or will be directly or
indirectly related to the specific recommendations and views expressed by research analyst(s) in this report. The research analysts, strategists, or research associates principally responsible for preparation of MOSt research receive
compensation based upon various factors, including quality of research, investor client feedback, stock picking, competitive factors and firm revenues
Disclosure of Interest Statement
Analyst ownership of the stock
Served as an officer, director or employee
ITC LTD
No
No
A graph of daily closing prices of securities is available at www.nseindia.com and http://economictimes.indiatimes.com/markets/stocks/stock-quotes
Regional Disclosures (outside India)
For U.S.
This report is not directed or intended for distribution to or use by any person or entity resident in a state, country or any jurisdiction, where such distribution, publication, availability or use would be contrary to law, regulation or which
would subject MOSt & its group companies to registration or licensing requirements within such jurisdictions.
Motilal Oswal Securities Limited (MOSL) is not a registered broker - dealer under the U.S. Securities Exchange Act of 1934, as amended (the"1934 act") and under applicable state laws in the United States. In addition MOSL is not a
registered investment adviser under the U.S. Investment Advisers Act of 1940, as amended (the "Advisers Act" and together with the 1934 Act, the "Acts), and under applicable state laws in the United States. Accordingly, in the
absence of specific exemption under the Acts, any brokerage and investment services provided by MOSL, including the products and services described herein are not available to or intended for U.S. persons.
This report is intended for distribution only to "Major Institutional Investors" as defined by Rule 15a-6(b)(4) of the Exchange Act and interpretations thereof by SEC (henceforth referred to as "major institutional investors"). This
document must not be acted on or relied on by persons who are not major institutional investors. Any investment or investment activity to which this document relates is only available to major institutional investors and will be
engaged in only with major institutional investors. In reliance on the exemption from registration provided by Rule 15a-6 of the U.S. Securities Exchange Act of 1934, as amended (the "Exchange Act") and interpretations thereof by
the U.S. Securities and Exchange Commission ("SEC") in order to conduct business with Institutional Investors based in the U.S., MOSL has entered into a chaperoning agreement with a U.S. registered broker-dealer, Motilal Oswal
Securities International Private Limited. ("MOSIPL"). Any business interaction pursuant to this report will have to be executed within the provisions of this chaperoning agreement.
The Research Analysts contributing to the report may not be registered /qualified as research analyst with FINRA. Such research analyst may not be associated persons of the U.S. registered broker-dealer, MOSIPL, and therefore,
may not be subject to NASD rule 2711 and NYSE Rule 472 restrictions on communication with a subject company, public appearances and trading securities held by a research analyst account.
For Hong Kong:
This report is distributed in Hong Kong by Motilal Oswal capital Markets (Hong Kong) Private Limited, a licensed corporation (CE AYY-301) licensed and regulated by the Hong Kong Securities and Futures Commission (SFC)
pursuant to the Securities and Futures Ordinance (Chapter 571 of the Laws of Hong Kong) “SFO”. As per SEBI (Research Analyst Regulations) 2014 Motilal Oswal Securities (SEBI Reg No. INH000000412) has an agreement with
Motilal Oswal capital Markets (Hong Kong) Private Limited for distribution of research report in Kong Kong. This report is intended for distribution only to “Professional Investors” as defined in Part I of Schedule 1 to SFO. Any
investment or investment activity to which this document relates is only available to professional investor and will be engaged only with professional investors.” Nothing here is an offer or solicitation of these securities, products and
services in any jurisdiction where their offer or sale is not qualified or exempt from registration. The Indian Analyst(s) who compile this report is/are not located in Hong Kong & are not conducting Research Analysis in Hong Kong.
For Singapore
Motilal Oswal Capital Markets Singapore Pte Limited is acting as an exempt financial advisor under section 23(1)(f) of the Financial Advisers Act(FAA) read with regulation 17(1)(d) of the Financial Advisors Regulations and is a
subsidiary of Motilal Oswal Securities Limited in India. This research is distributed in Singapore by Motilal Oswal Capital Markets Singapore Pte Limited and it is only directed in Singapore to accredited investors, as defined in the
Financial Advisers Regulations and the Securities and Futures Act (Chapter 289), as amended from time to time.
In respect of any matter arising from or in connection with the research you could contact the following representatives of Motilal Oswal Capital Markets Singapore Pte Limited:
Kadambari Balachandran
Email : kadambari.balachandran@motilaloswal.com
Contact : (+65) 68189233 / 65249115
Office Address : 21 (Suite 31),16 Collyer Quay,Singapore 04931
Motilal Oswal Tower, Level 9, Sayani Road, Prabhadevi, Mumbai 400 025
Phone: +91 22 3982 5500 E-mail: reports@motilaloswal.com
Motilal Oswal Securities Ltd
21 March 2016
6