HCL Technologies
BSE SENSEX
25,400
S&P CNX
7,759
4 April 2016
Update
| Sector:
Technology
CMP: INR821
TP: INR1,000(+22%)
Buy
Enhances engineering services portfolio through GEOM
Access to ~60 customers; largely margin and EPS neutral
Stock Info
Bloomberg
Equity Shares (m)
52-Week Range (INR)
1, 6, 12 Rel. Per (%)
M.Cap. (INR b)
M.Cap. (USD b)
Avg Val ( INRm)
Free float (%)
HCLT IN
1,410.4
1,048/786
-3/4/0
1,157.5
17.5
2,002
39.4
Two-part deal
Financials Snapshot (INR b)
Y/E Mar
2016E* 2017E 2018E
Sales
312.9 496.0 578.8
EBITDA
68.8 107.6 124.5
PAT
56.1
84.9
96.5
39.8
59.7
67.4
EPS (INR)
-21.0
50.2
12.8
EPS Gr. (%)
201.6 240.3 285.8
BV/Sh. (INR)
21.2
27.4
26.2
RoE (%)
23.0
31.3
30.6
RoCE (%)
21.1
14.1
12.5
P/E (x)
4.2
3.5
2.9
P/BV (x)
*FY16 is 9months period ending Mar16
Shareholding pattern (%)
As On
Promoter
DII
FII
Others
Dec-15 Sep-15 Dec-14
60.4
5.5
27.6
6.6
60.6
5.0
28.4
6.1
61.4
3.7
29.0
5.8
HCLT entered into a deal to acquire the complete stake in GEOM, except for
the 58% stake the latter owns in 3DPLM Software Solutions, a JV with Dassault
Systemes.
As a consideration for this acquisition, HCLT will issue 10 shares for every 43
shares of GEOM, effectively valuing it at ~USD190m at current prices.
Dassault Systemes would wholly own 3DPLM, in exchange for which GEOM
shareholders will receive one listed redeemable preference share of INR68 per
share held, with a 7% pa preferential dividend.
2% revenue accretion, 10bp margin dilution for HCLT
In 9MFY16, GEOM (excluding 3DPLM)’s revenue totaled USD104m, and EBIT
margin stood at 8.2%. Assuming continuity of the current revenue rate and
EBIT margin sustainability at 13.5% in 3QFY16, the acquisition would add ~2%
to HCLT’s revenue and result in an EBIT margin dilution of 10bp.
While the acquisition would be accretive to earnings by 1%, the flow down to
EPS gets negated by ~1% equity share dilution.
Farming-led growth potential…
FII includes depository receipts
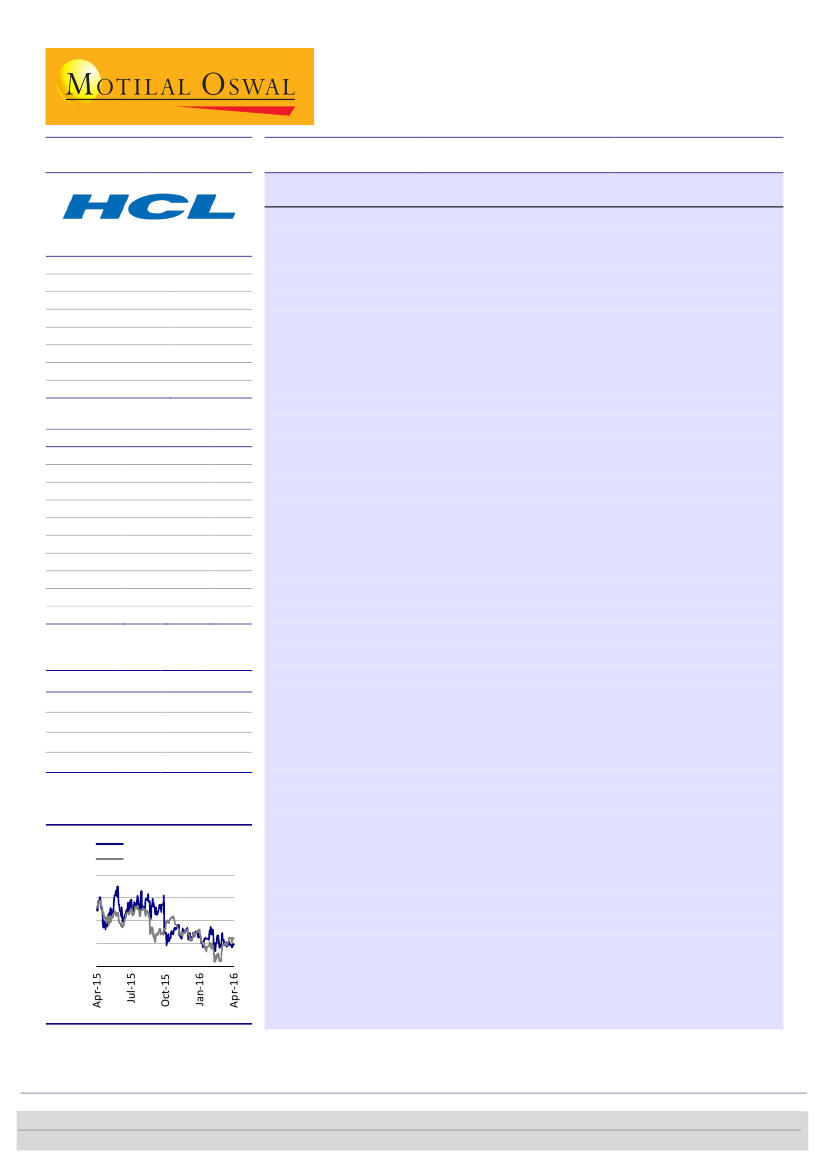
Stock Performance (1-year)
HCL Technologies
Sensex - Rebased
1,050
975
900
825
750
The acquisition would strengthen HCLT’s capabilities in engineering services,
primarily PLM consulting, mechanical and manufacturing. Engineering services
has been the company’s key strategic focus area, contributing 19% to total
revenue. As part of the deal, 2,606 workers would be onboarded across 13
global delivery locations including the US, France, Germany, Romania, India
and China.
HCLT recently announced the acquisition of Volvo’s external IT business, which
registered LTM revenue of USD190m. Furthermore, GEOM lends access to
another set of top clientele that can further augment growth. In fact, HCLT’s
potential to enhance its large client base appears the strongest on paper.
The company would gain access to 60 customers due to this acquisition,
primarily in automotive (45% of revenue), industrial (22%) and aerospace
(10%). GEOM’s clientele includes some marquee names such as Chrysler, Ford,
John Deere, Aerolia and Pratt & Whitney, among others.
Ashish Chopra
(Ashish.Chopra@MotilalOswal.com); +91 22 3982 5424
Sagar Lele
(Sagar.Lele@MotilalOswal.com); +91 22 3982 5585
Investors are advised to refer through important disclosures made at the last page of the Research Report.
Motilal Oswal research is available on www.motilaloswal.com/Institutional-Equities, Bloomberg, Thomson Reuters, Factset and S&P Capital.

HCL Technologies
… in part justifies a higher valuation multiple
Annualizing GEOM’s 3QFY16 PAT (ex. 3DPLM) of INR200m implies a multiple of
16x on FY16 earnings.
Although this appears to be on the higher side, risks in the deal are limited
assuming margin sustainability, minimal impact on HCLT’s EBIT margin (-10bp),
and on earnings. We don’t we the management bandwidth getting significantly
distracted in the aftermath of the integration process (relative to deals like
TECHM’s acquisition of LCC, where size itself meant greater impact).
HCLT’s margin performance—more from the Volvo acquisition vis-à-vis GEOM—
will be crucial for valuation. Though the EBIT margin was projected to be in the
range of 21–22% during January–March 2016, we forecast it to reach 20.4% in
FY17. Margins sustaining below 20% would be a key negative, indicating margin
weakness in the core business as opposed to a result of the Volvo integration,
which, in our view, should dilute margins by 80–100bp.
4 April 2016
2

HCL Technologies
Exhibit 1: HCLT – the largest listed vendor for engineering services
Engineering revenue in FY15 (USDm)
Engineering revenue in FY15 (% of total revenue)
1,087
699
298
5%
TCS
3%
INFO
694
18%
265
61%
30%
148
KPIT
10%
WPRO
HCLT
CYL
Source: MOSL, Company
Exhibit 2: Significant opportunities in engineering services
Global ER&D
spend
(USD1,440b)
Global
sourcing
market
(USD68b)
India's ER&D
market
(USD17b)
Source: MOSL, Company
Exhibit 3: Strong growth in HCLT's engineering services revenue (YoY, %)
Engineering services
24.4
13.9
8.1
5.2
5.0
5.8
6.8
8.2
8.1
7.3
6.5
28.0
26.0
20.9
Source: MOSL, Company
Exhibit 4: GEOM – Consolidated financials
Revenue (USDm)
Revenue (INRm)
EBIT (INRm)
EBIT margin (%)
PAT
FY14
181
10,955
1,692
15.5%
462
FY15
9MFY16
181
142
11,053
9,208
941
967
8.5%
10.5%
552
711
Source: MOSL, Company
4 April 2016
3

HCL Technologies
Exhibit 5: GEOM – 3DPLM
Revenue (USDm)
Revenue (INRm)
EBITDA (INRm)
EBITDA margin (%)
PAT
FY14
51
3,083
887
28.8%
299
FY15
9MFY16
48
38
2,914
2,473
995
804
34.1%
32.5%
340
258
Source: MOSL, Company
Exhibit 6: GEOM – excluding 3DPLM
Revenue (USDm)
Revenue (INRm)
EBITDA (INRm)
EBITDA margin (%)
PAT
FY14
130
7,871
513
6.5%
164
FY15
133
8,139
501
6.2%
211
9MFY16
104
6,735
778
11.5%
452
Source: MOSL, Company
Exhibit 7: Change in estimates
GEOM
140
9.4
1.3
13.5
0.8
65.7
FY17E
HCLT
Combined
7,224
7,294
491.2
496
100.8
101.5
20.5
20.5
84.5
84.9
1,413.9
1,430.6
Change
1.0%
1.0%
0.6%
-7bp
0.5%
1.2%
0.0%
GEOM
147
10.3
1.4
13.5
0.9
65.7
FY18E
HCLT
Combined
8,122
8,269
568.5
579
116.5
117.9
20.5
20.4
95.7
96.6
1,413.9
1,433.3
Change
1.8%
1.8%
1.2%
-12bp
0.9%
1.4%
0.1%
Revenue (USDm)
Revenue (INRb)
EBIT (INRb)
EBIT margin (%)
PAT (INRb)
Number of shares (m)
EPS (INR)
Source: MOSL, Company
4 April 2016
4

HCL Technologies
Valuation view
Maintain Buy on healthy near-term growth visibility
HCLT’s differentiated positioning in IMS helped in registering higher growth
compared to the industry average over the last few years. Additionally, the
company strengthened capabilities in engineering services from CY15.
Nevertheless, the rapid decline in margins (522bp over the last seven quarters)
led to uncertainty with regard to revival in margins, along with tepid revenue
growth during the last couple of quarters.
While 1HFY16 was relatively muted, led by transition in IMS deals and some
softness in select verticals, the visibility appears strong in the near term;
opportunities in IMS and engineering should bolster HCLT’s growth compared to
peers.
1. The YoY growth in IMS, which registered a CAGR of 30% over FY10–15 and
contributed 46% to HCLT’s incremental revenues, has decelerated in recent
quarters. Although this factor has raised concerns about heightened
competitive pressures, the company’s number of deals has remained
healthy. We expect growth in IMS to remain strong at least in the
foreseeable future. HCLT enjoys a healthy lead as far as scale in IMS is
concerned, with FY15 revenue of USD2.2b+.
2. Total spending on engineering services and R&D is estimated at USD1.4t, of
which exports from India are pegged at a mere USD12.5b. Of this, ~50% is
expected to be serviced out of captives and the remaining outsourced to
third-party vendors like HCLT. According to Nasscom, ER&D exports are
projected to reach ~USD50b by 2020. With FY15 revenues of USD1b+, HCLT
is the largest outsourcer of engineering services (19% of total revenue).
HCLT trades at 14.1x/12.5x FY17E/FY18E EPS. In our opinion, revenues and EPS
would post a CAGR of 15% and 13%, respectively, over FY16–18. Our one-year
target price of INR1,000 discounts FY18E earnings by 15x. While the valuation
has considered opportunities in IMS and engineering, it also factors in risks to
IMS’s growth beyond the foreseeable future due to market disruption through
cloud/automation/software-defined infrastructure. While these trends do not
pose a risk to HCLT’s ability to continue gaining a higher market share, they do
introduce a greater element of uncertainty compared to earlier. Our TP implies
an upside of 22%. Consequently, we maintain
Buy.
Key triggers
Uptick in quarterly deal wins TCV, led by compounding of engineering services
deals to IMS and ITO signings
Return to industry-leading growth
Sustain broad-based growth
Key risks
Further decline in margins beyond the next couple of quarters
Decelerated IMS growth amid an increase in competitive pressures
Discontinuation of traction in engineering or financial services
4 April 2016
5

HCL Technologies
Exhibit 8: HCLT one-year forward PE chart
28
22
16
10
4
5.8
15.2
14.7
14.9
PE (x)
Median(x)
Peak(x)
Min(x)
Avg(x)
25.1
Exhibit 9: HCLT one-year forward PB chart
6.5
5.0
3.5
2.0
0.5
3.3
3.3
1.0
PB (x)
Median(x)
Peak(x)
Min(x)
Avg(x)
5.2
3.5
Exhibit 10: Comparative valuations
Company
TCS
Infosys
Wipro
HCL Tech
TechM
Cognizant
Mkt cap
(USD b)
74.7
41.9
20.9
17.3
6.9
34.9
Rating
Neutral
Buy
Neutral
Buy
Neutral
Not Rated
TP (INR)
2,615
1,350
630
1,000
550
Upside
(%)
3.8
10.8
11.7
22.9
15.8
EPS (INR)
FY17E
FY18E
136.7
69.0
37.4
59.7
36.7
3.0
155.3
77.1
43.5
67.4
41.1
3.4
P/E (x)
FY17E
FY18E
18.4
17.7
15.1
13.6
13.0
19.2
16.2
15.8
13.0
12.1
11.5
16.8
RoE (%)
FY16–18E CAGR (%)
FY17E
FY18E
USD rev.
EPS
35.6
25.4
19.0
27.4
20.7
17.8
33.2
25.0
19.7
26.2
17.6
17.2
10.6
13.2
10.1
14.7
9.0
12.5
12.7
14.8
9.9
12.7
11.3
13.3
Source: Bloomberg, Company, MOSL
4 April 2016
6

HCL Technologies
Story in charts
Exhibit 11: Continued opportunities from churn in rebid
market
Churn market oppurtunity (USD b)
Dec 2011 estimates
Dec 2013 estimates
Exhibit 12: HCLT continues to capitalize on deal wins
Deals TCV (USD b)
2
1
1
1
42
48
28
46
24
34
54
2017
26
2018
1
1
2
1
1
1
2014
2015
2016
Source: Company, MOSL
Exhibit 13: IMS growth moderation, albeit strong as of now,
could impact future potential
IMS Revenues
% of overall revenues
% of incremental revenues
68
41
16
23 21
23
30
24
29 29
67
41
49
35
Exhibit 14: Parts, apart from IMS, aiding incremental growth
Incremental Revenue Contribution (%)
67.3
67.4
36.5
21.6
8.6
FY12
FY13
9.3
FY14
FY15
1HFY16
48.9
37.1
IMS
ER&D
34
35
30.3
15.9
29.5
21.6
FY09
FY10
FY11
FY12
FY13
FY14
FY15 1HFY16
FY11
Source: Company, MOSL
Exhibit 15: Operating margins bottomed out at current
levels
EBIT margin (%)
SGA (%)
Exhibit 16: Growth in PAT to be similar to revenue with
margin stabilization
PAT (INR m)
63.9
52.6
58.3
71,057
40,250
63,709
84,917
56,148
5.4
13.4
13.6
YoY growth (%)
96,479
14.8
14.0
13.3
12.3
12.3
12.7
12.8
13.0
36.8
24,553
13.4
FY11
16.0
FY12
19.7
FY13
24.1
FY14
22.3
FY15
20.6
20.5
20.4
16,092
FY11
11.5
FY16E FY17E FY18E
Source: Company, MOSL
FY12
FY13
FY14
FY15
FY16E FY17E FY18E
Source: Company, MOSL
4 April 2016
7

HCL Technologies
Exhibit 17: Comparative Valuation
4QFY13 1QFY14
Service line wise (%)
Application Services
Engineering and R&D Services
Infrastructure Services
BPO Services
Vertical wise (%)
BFSI
Manufacturing
Retail & CPG
Telecom MP&E
Life Sciences
Public Services
Others
Geography wise (%)
US
Europe
ROW
Client wise (%)
Top 5 clients
Top 10 clients
Top 20 clients
QoQ Growth (%)
Service line wise
Application Services
Engineering and R&D Services
Infrastructure Services
BPO Services
Vertical wise
BFSI
Manufacturing
Retail & CPG
Telecom MP&E
Life Sciences
Public Services
Others
Geography wise
US
Europe
ROW
Client wise
Top 5 clients
Top 10 clients
Top 20 clients
3.1
2.2
3.7
1.5
3.5
4.1
1.9
4.0
5.3
4.4
4.3
4.9
1.3
1.6
1.8
-0.2
-0.7
-0.2
1.1
0.4
2.1
-3.6
-2.3
-0.6
0.9
2.7
3.8
3.5
1.4
0.5
1.4
0.5
1.4
2.9
8.8
-8.0
4.0
2.6
3.2
3.4
7.8
-2.3
0.4
4.8
11.0
1.3
7.4
2.2
5.7
-0.3
-8.9
6.0
2.1
-0.6
0.0
-2.6
7.9
5.1
1.2
-1.3
0.6
4.8
-12.3
5.4
-4.4
-3.9
4.3
18.7
-0.4
55.4
3.1
7.1
-14.1
6.2
5.6
-0.7
-6.4
6.8
1.5
-2.6
3.8
5.0
7.5
1.2
-3.8
21.8
-16.9
6.8
2.0
2.8
-2.6
-0.7
13.9
-20.4
9.3
-2.1
2.9
9.5
1.4
2.8
2.1
1.2
4.4
14.3
-0.4
-2.1
-6.1
-6.7
-1.9
5.9
5.6
0.4
17.9
6.2
-15.8
-2.0
1.3
-13.4
7.1
0.8
9.3
-12.0
2.8
1.0
8.1
8.9
10.5
-3.8
-10.6
0.8
-0.2
0.5
1.5
3.8
3.6
-53.6
0.6
-1.7
9.5
2.5
-0.2
7.5
1.4
-0.7
4.3
8.6
3.1
0.8
1.4
8.7
1.9
2.4
2.1
6.0
13.7
2.9
0.1
5.1
-0.7
1.6
3.8
3.7
17.7
0.0
7.6
1.9
-0.2
1.6
11.5
3.6
2.0
-2.1
3.0
0.4
4.1
1.6
2.0
5.5
4.8
-0.7
3.3
-0.1
2.8
1.4
-1.8
2.6
5.2
15.4
23.8
33.0
15.1
23.8
33.2
14.8
23.8
33.6
15.0
24.1
34.2
14.7
23.7
33.7
14.4
23.1
33.0
14.0
22.3
32.4
13.5
21.8
32.2
13.2
21.7
32.4
13.6
21.9
32.4
13.6
21.7
32.4
57.0
30.5
12.5
57.2
30.2
12.6
56.9
31.3
11.8
55.4
31.8
12.8
54.3
33.0
12.7
56.3
32.3
11.4
57.4
31.7
10.9
57.5
31.0
11.5
58.6
30.4
11.0
58.7
31.7
9.6
61.0
29.9
9.1
25.3
32.7
8.6
10.1
11.3
8.0
4.0
26.0
33.3
8.3
9.1
11.6
7.8
3.9
25.9
33.6
8.6
8.9
10.8
9.2
3.1
26.9
33.3
8.5
8.4
10.4
10.1
2.3
28.4
31.6
8.5
8.9
10.2
10.1
2.3
28.2
32.3
9.5
8.7
9.8
9.3
2.2
26.6
32.9
9.7
8.4
11.1
9.5
1.8
26.1
33.4
8.4
9.0
11.2
10.4
1.5
26.0
32.7
8.8
9.5
12.0
9.7
1.3
26.1
32.5
8.8
9.6
12.4
10.0
0.6
25.9
31.5
9.5
9.7
12.2
10.6
0.6
46.9
17.3
31.5
4.3
45.8
16.9
33.1
4.2
45.1
16.6
33.7
4.6
44.9
16.1
34.5
4.5
44.2
16.2
34.5
5.1
43.4
17.1
34.5
5.0
42.4
18.3
34.4
4.9
41.5
18.9
34.5
5.1
40.9
18.7
35.3
5.2
40.4
19.2
35.1
5.3
40.4
18.6
35.5
5.5
2QFY14
3QFY14
4QFY14
1QFY15
2QFY15
3QFY15
4QFY15
1QFY16
2QFY16
Source: Company, MOSL
4 April 2016
8

HCL Technologies
Financials and Valuations
Key assumption
2011
INR/USD Rate
Revenues (USD m)
IMS Revenue (USD m)
Software Services Rev (USD m)
Total Headcount
Net Addition
Per Capita Productivity (USD)
44.9
3,545
827
2,523
77,046
12,489
46,015
2011
159,118
26.6
26,312
16.5
4,935
21,377
-541
0
20,836
4,744
22.8
0
16,092
16,092
36.7
2012
50.7
4,152
1,005
2,957
84,319
7,273
49,237
2012
210,312
32.2
39,396
18.7
5,641
33,755
-1,170
0
32,585
8,032
24.6
0
24,553
24,553
52.6
2013
54.9
4,687
1,367
3,114
85,505
1,186
54,810
2013
257,336
22.4
57,536
22.4
6,726
50,810
1,570
0
52,380
12,130
23.2
0
40,250
40,250
63.9
2014
61.4
5,360
1,820
3,293
91,691
6,186
58,454
2014
329,180
27.9
86,670
26.3
7,320
79,350
-160
0
79,190
15,480
19.5
1
63,709
63,710
58.3
2015
62.3
5,952
2,064
3,588
106,107
14,416
56,097
2015
370,620
12.6
87,020
23.5
4,440
82,580
7,559
1,551
91,690
19,080
20.8
2
72,608
71,059
11.5
2016E*
66.3
4,718
1,684
2,776
108,696
2,589
57,873
2016E*
312,924
-15.6
68,840
22.0
4,345
64,495
6,803
0
71,298
15,149
21.2
0
56,148
56,148
-21.0
2017E
68.0
7,294
2,920
3,973
132,366
23,670
55,102
2017E
495,967
58.5
107,624
21.7
6,193
101,431
6,744
0
108,175
23,258
21.5
0
84,917
84,917
51.2
2018E
70.0
8,269
3,370
4,436
148,196
15,830
55,799
2018E
578,846
16.7
124,468
21.5
6,508
117,960
5,529
0
123,489
27,010
21.9
0
96,479
96,479
13.6
Income Statement
Y/E Jun
Net Sales
Change (%)
EBITDA
EBITDA Margin (%)
Depreciation
EBIT
Other Income
Extraordinary items
PBT
Tax
Tax Rate (%)
Min. Int. & Assoc. Share
Reported PAT
Adjusted PAT
Change (%)
(INR Million)
Balance Sheet
Y/E Jun
Share Capital
Reserves
Net Worth
Debt
Total Capital Employed
Gross Fixed Assets
Less: Acc Depreciation
Net Fixed Assets
Intangibles
Investments
Current Assets
Debtors
Cash & Bank
Loans & Adv, Others
Curr Liabs & Provns
Net Current Assets
Total Assets
*FY16 is 9months period ending Mar16
2011
2,729
81,616
84,345
21,240
105,585
49,608
27,443
22,165
52,270
19,991
51,809
34,065
5,198
12,546
40,650
11,159
105,585
2012
2,762
104,552
107,314
19,222
126,536
57,859
33,084
24,775
69,453
19,723
75,325
53,440
6,673
15,212
62,740
12,585
126,536
2013
2,777
140,168
142,945
6,960
149,905
67,093
39,810
27,283
72,046
42,991
88,159
61,767
7,321
19,071
80,574
7,585
149,905
2014
2,793
198,021
200,814
7,509
208,323
78,595
47,130
31,465
74,954
89,948
108,537
77,086
10,206
21,245
96,581
11,956
208,323
2015
2,797
244,713
247,510
4,690
252,200
89,770
51,570
38,200
82,700
104,450
131,760
94,860
13,520
23,380
104,910
26,850
252,200
2016E*
2,799
279,381
282,180
1,597
283,777
103,554
51,570
51,984
91,534
109,995
139,002
101,267
8,506
29,229
108,737
30,265
283,777
(INR Million)
2017E
2,802
333,853
336,656
1,597
338,253
110,961
51,570
59,391
98,545
109,995
202,012
122,293
44,476
35,242
131,690
70,322
338,253
2018E
2,806
398,155
400,961
1,597
402,558
118,453
51,570
66,883
104,797
109,995
274,731
142,729
91,398
40,604
153,848
120,883
402,558
4 April 2016
9

HCL Technologies
Financials and Valuations
Ratios
Y/E Jun
Basic (INR)
EPS
Cash EPS
Book Value
DPS
Payout (incl. Div. Tax.)
Valuation(x)
P/E
Cash P/E
Price / Book Value
EV/Sales
EV/EBITDA
Dividend Yield (%)
Profitability Ratios (%)
RoE
RoCE
Turnover Ratios (%)
Asset Turnover (x)
Debtors (No. of Days)
Leverage Ratios (%)
Net Debt/Equity (x)
0.2
0.1
0.0
0.0
0.0
0.0
-0.1
-0.2
7.8
74.0
9.0
75.9
9.9
81.7
11.2
77.0
10.6
84.7
6.9
114.4
8.9
82.3
9.2
83.6
20.8
19.7
25.6
26.8
32.2
33.3
37.1
40.9
31.7
33.9
21.2
23.0
27.4
31.3
26.2
30.6
18.6
16.7
5.8
3.3
12.5
1.3
16.7
15.4
4.7
2.9
12.2
1.9
21.1
19.6
4.2
3.4
15.4
1.8
14.1
13.2
3.5
2.1
9.5
2.1
12.5
11.7
2.9
1.7
7.9
2.3
11.5
15.1
61.8
3.8
32.6
17.5
21.6
77.7
6.0
34.3
28.6
33.3
103.0
6.0
21.0
45.1
50.3
143.8
11.0
24.4
50.4
54.5
177.0
16.0
31.8
39.8
42.8
201.6
15.0
37.7
59.7
63.7
240.3
18.0
30.1
67.4
71.9
285.8
19.0
28.2
2011
2012
2013
2014
2015
2016E*
2017E
2018E
Cash Flow Statement
Y/E Jun
Adjusted EBITDA
Non-cash opr. exp (inc)
(Inc)/Dec in Wkg. Cap.
Tax Paid
Other operating activities
CF from Op. Activity
(Inc)/Dec in FA & CWIP
Free cash flows
(Pur)/Sale of Invt
Others
CF from Inv. Activity
Inc/(Dec) in Net Worth
Inc / (Dec) in Debt
Divd Paid (incl Tax) & Others
CF from Fin. Activity
Inc/(Dec) in Cash
Add: Opening Balance
Closing Balance
*FY16 is 9months period ending Mar16
2011
26,312
-752
-4,836
-4,744
0
15,980
-7,370
8,610
-50
0
-7,420
3,885
-5,392
-6,541
-8,048
512
4,686
5,198
2012
39,396
-9,657
-6,410
-8,032
0
15,297
-15,777
-480
6,727
0
-9,050
8,118
-2,018
-10,871
-4,772
1,475
5,198
6,673
2013
57,536
-2,415
3,843
-12,130
0
46,834
-9,412
37,422
-21,463
0
-30,875
5,134
-12,262
-8,183
-15,311
648
6,673
7,321
2014
86,670
-999
-950
-15,480
0
69,241
-13,412
55,829
-47,493
0
-60,905
12,155
549
-18,156
-5,452
2,884
7,321
10,206
2015
87,020
-7,200
-9,555
-19,080
0
51,185
-10,172
41,013
-16,527
0
-26,699
1,040
-2,819
-19,393
-21,171
3,315
10,206
13,520
2016E*
68,840
-3,417
-7,810
-15,149
0
42,464
-23,546
18,918
-6,164
0
-29,710
3,853
-3,093
-18,528
-17,768
-5,015
13,520
8,506
2017E
107,624
-7,011
-6,550
-23,258
0
70,805
-13,600
57,205
2,463
0
-11,137
-6
0
-23,691
-23,697
35,971
8,506
44,476
(INR Million)
2018E
124,468
-6,252
-5,836
-27,010
0
85,370
-14,000
71,370
2,196
0
-11,804
-10
0
-26,635
-26,645
46,922
44,476
91,398
4 April 2016
10

HCLT GALLERY
HCLT
OTHER COMPANIES
SECTOR UPDATES

This document has been prepared by Motilal Oswal Securities Limited (hereinafter referred to as Most) to provide information about the company(ies) and/sector(s), if any, covered in the report and may be distributed by it and/or its
affiliated company(ies). This report is for personal information of the selected recipient/s and does not construe to be any investment, legal or taxation advice to you. This research report does
HCL Technologies
or
not constitute an offer, invitation
inducement to invest in securities or other investments and Motilal Oswal Securities Limited (hereinafter referred as MOSt) is not soliciting any action based upon it. This report is not for public distribution and has been furnished to
you solely for your general information and should not be reproduced or redistributed to any other person in any form. This report does not constitute a personal recommendation or take into account the particular investment
objectives, financial situations, or needs of individual clients. Before acting on any advice or recommendation in this material, investors should consider whether it is suitable for their particular circumstances and, if necessary, seek
professional advice. The price and value of the investments referred to in this material and the income from them may go down as well as up, and investors may realize losses on any investments. Past performance is not a guide for
future performance, future returns are not guaranteed and a loss of original capital may occur.
MOSt and its affiliates are a full-service, integrated investment banking, investment management, brokerage and financing group. We and our affiliates have investment banking and other business relationships with a some
companies covered by our Research Department. Our research professionals may provide input into our investment banking and other business selection processes. Investors should assume that MOSt and/or its affiliates are
seeking or will seek investment banking or other business from the company or companies that are the subject of this material and that the research professionals who were involved in preparing this material may educate investors
on investments in such business . The research professionals responsible for the preparation of this document may interact with trading desk personnel, sales personnel and other parties for the purpose of gathering, applying and
interpreting information. Our research professionals are paid on twin parameters of performance & profitability of MOSt.
MOSt generally prohibits its analysts, persons reporting to analysts, and members of their households from maintaining a financial interest in the securities or derivatives of any companies that the analysts cover. Additionally, MOSt
generally prohibits its analysts and persons reporting to analysts from serving as an officer, director, or advisory board member of any companies that the analysts cover. Our salespeople, traders, and other professionals or affiliates
may provide oral or written market commentary or trading strategies to our clients that reflect opinions that are contrary to the opinions expressed herein, and our proprietary trading and investing businesses may make investment
decisions that are inconsistent with the recommendations expressed herein. In reviewing these materials, you should be aware that any or all of the foregoing among other things, may give rise to real or potential conflicts of interest.
MOSt and its affiliated company(ies), their directors and employees and their relatives may; (a) from time to time, have a long or short position in, act as principal in, and buy or sell the securities or derivatives thereof of companies
mentioned herein. (b) be engaged in any other transaction involving such securities and earn brokerage or other compensation or act as a market maker in the financial instruments of the company(ies) discussed herein or act as an
advisor or lender/borrower to such company(ies) or may have any other potential conflict of interests with respect to any recommendation and other related information and opinions.; however the same shall have no bearing
whatsoever on the specific recommendations made by the analyst(s), as the recommendations made by the analyst(s) are completely independent of the views of the affiliates of MOSt even though there might exist an inherent
conflict of interest in some of the stocks mentioned in the research report .Reports based on technical and derivative analysis center on studying charts company's price movement, outstanding positions and trading volume, as
opposed to focusing on a company's fundamentals and, as such, may not match with a report on a company's fundamental analysis. In addition MOST has different business segments / Divisions with independent research
separated by Chinese walls catering to different set of customers having various objectives, risk profiles, investment horizon, etc, and therefore may at times have different contrary views on stocks sectors and markets.
Unauthorized disclosure, use, dissemination or copying (either whole or partial) of this information, is prohibited. The person accessing this information specifically agrees to exempt MOSt or any of its affiliates or employees from,
any and all responsibility/liability arising from such misuse and agrees not to hold MOSt or any of its affiliates or employees responsible for any such misuse and further agrees to hold MOSt or any of its affiliates or employees free
and harmless from all losses, costs, damages, expenses that may be suffered by the person accessing this information due to any errors and delays. The information contained herein is based on publicly available data or other
sources believed to be reliable. Any statements contained in this report attributed to a third party represent MOSt’s interpretation of the data, information and/or opinions provided by that third party either publicly or through a
subscription service, and such use and interpretation have not been reviewed by the third party. This Report is not intended to be a complete statement or summary of the securities, markets or developments referred to in the
document. While we would endeavor to update the information herein on reasonable basis, MOSt and/or its affiliates are under no obligation to update the information. Also there may be regulatory, compliance, or other reasons that
may prevent MOSt and/or its affiliates from doing so. MOSt or any of its affiliates or employees shall not be in any way responsible and liable for any loss or damage that may arise to any person from any inadvertent error in the
information contained in this report. MOSt or any of its affiliates or employees do not provide, at any time, any express or implied warranty of any kind, regarding any matter pertaining to this report, including without limitation the
implied warranties of merchantability, fitness for a particular purpose, and non-infringement. The recipients of this report should rely on their own investigations.
This report is intended for distribution to institutional investors. Recipients who are not institutional investors should seek advice of their independent financial advisor prior to taking any investment decision based on this report or for
any necessary explanation of its contents.
Most and it’s associates may have managed or co-managed public offering of securities, may have received compensation for investment banking or merchant banking or brokerage services, may have received any compensation
for products or services other than investment banking or merchant banking or brokerage services from the subject company in the past 12 months.
Most and it’s associates have not received any compensation or other benefits from the subject company or third party in connection with the research report.
Subject Company may have been a client of Most or its associates during twelve months preceding the date of distribution of the research report
MOSt and/or its affiliates and/or employees may have interests/positions, financial or otherwise of over 1 % at the end of the month immediately preceding the date of publication of the research in the securities mentioned in this
report. To enhance transparency, MOSt has incorporated a Disclosure of Interest Statement in this document. This should, however, not be treated as endorsement of the views expressed in the report.
Motilal Oswal Securities Limited is registered as a Research Analyst under SEBI (Research Analyst) Regulations, 2014. SEBI Reg. No. INH000000412
There are no material disciplinary action that been taken by any regulatory authority impacting equity research analysis activities
Disclosures
Analyst Certification
The views expressed in this research report accurately reflect the personal views of the analyst(s) about the subject securities or issues, and no part of the compensation of the research analyst(s) was, is, or will be directly or
indirectly related to the specific recommendations and views expressed by research analyst(s) in this report. The research analysts, strategists, or research associates principally responsible for preparation of MOSt research receive
compensation based upon various factors, including quality of research, investor client feedback, stock picking, competitive factors and firm revenues
Disclosure of Interest Statement
Analyst ownership of the stock
Served as an officer, director or employee
HCL TECH
No
No
A graph of daily closing prices of securities is available at www.nseindia.com and http://economictimes.indiatimes.com/markets/stocks/stock-quotes
Regional Disclosures (outside India)
For U.S.
This report is not directed or intended for distribution to or use by any person or entity resident in a state, country or any jurisdiction, where such distribution, publication, availability or use would be contrary to law, regulation or which
would subject MOSt & its group companies to registration or licensing requirements within such jurisdictions.
Motilal Oswal Securities Limited (MOSL) is not a registered broker - dealer under the U.S. Securities Exchange Act of 1934, as amended (the"1934 act") and under applicable state laws in the United States. In addition MOSL is not a
registered investment adviser under the U.S. Investment Advisers Act of 1940, as amended (the "Advisers Act" and together with the 1934 Act, the "Acts), and under applicable state laws in the United States. Accordingly, in the
absence of specific exemption under the Acts, any brokerage and investment services provided by MOSL, including the products and services described herein are not available to or intended for U.S. persons.
This report is intended for distribution only to "Major Institutional Investors" as defined by Rule 15a-6(b)(4) of the Exchange Act and interpretations thereof by SEC (henceforth referred to as "major institutional investors"). This
document must not be acted on or relied on by persons who are not major institutional investors. Any investment or investment activity to which this document relates is only available to major institutional investors and will be
engaged in only with major institutional investors. In reliance on the exemption from registration provided by Rule 15a-6 of the U.S. Securities Exchange Act of 1934, as amended (the "Exchange Act") and interpretations thereof by
the U.S. Securities and Exchange Commission ("SEC") in order to conduct business with Institutional Investors based in the U.S., MOSL has entered into a chaperoning agreement with a U.S. registered broker-dealer, Motilal Oswal
Securities International Private Limited. ("MOSIPL"). Any business interaction pursuant to this report will have to be executed within the provisions of this chaperoning agreement.
The Research Analysts contributing to the report may not be registered /qualified as research analyst with FINRA. Such research analyst may not be associated persons of the U.S. registered broker-dealer, MOSIPL, and therefore,
may not be subject to NASD rule 2711 and NYSE Rule 472 restrictions on communication with a subject company, public appearances and trading securities held by a research analyst account.
For Hong Kong:
This report is distributed in Hong Kong by Motilal Oswal capital Markets (Hong Kong) Private Limited, a licensed corporation (CE AYY-301) licensed and regulated by the Hong Kong Securities and Futures Commission (SFC)
pursuant to the Securities and Futures Ordinance (Chapter 571 of the Laws of Hong Kong) “SFO”. As per SEBI (Research Analyst Regulations) 2014 Motilal Oswal Securities (SEBI Reg No. INH000000412) has an agreement with
Motilal Oswal capital Markets (Hong Kong) Private Limited for distribution of research report in Kong Kong. This report is intended for distribution only to “Professional Investors” as defined in Part I of Schedule 1 to SFO. Any
investment or investment activity to which this document relates is only available to professional investor and will be engaged only with professional investors.” Nothing here is an offer or solicitation of these securities, products and
services in any jurisdiction where their offer or sale is not qualified or exempt from registration. The Indian Analyst(s) who compile this report is/are not located in Hong Kong & are not conducting Research Analysis in Hong Kong.
For Singapore
Motilal Oswal Capital Markets Singapore Pte Limited is acting as an exempt financial advisor under section 23(1)(f) of the Financial Advisers Act(FAA) read with regulation 17(1)(d) of the Financial Advisors Regulations and is a
subsidiary of Motilal Oswal Securities Limited in India. This research is distributed in Singapore by Motilal Oswal Capital Markets Singapore Pte Limited and it is only directed in Singapore to accredited investors, as defined in the
Financial Advisers Regulations and the Securities and Futures Act (Chapter 289), as amended from time to time.
In respect of any matter arising from or in connection with the research you could contact the following representatives of Motilal Oswal Capital Markets Singapore Pte Limited:
Kadambari Balachandran
Email : kadambari.balachandran@motilaloswal.com
Contact : (+65) 68189233 / 65249115
Office Address : 21 (Suite 31),16 Collyer Quay,Singapore 04931
Motilal Oswal Tower, Level 9, Sayani Road, Prabhadevi, Mumbai 400 025
Phone: +91 22 3982 5500 E-mail: reports@motilaloswal.com
Motilal Oswal Securities Ltd
4 April 2016
12