25 April 2016
Update
| Sector:
Metals
NMDC
Sell
BSE SENSEX
25,679
S&P CNX
7,855
CMP: INR99
TP: INR90 (-9%)
Pricing power improves on surge in global iron ore prices
But domestic supply can be a party pooper; revise TP to INR90
Global iron ore price outlook has improved
Iron ore prices have surged by ~73% from their lows in December 2015, driven by
NMDC IN
strong Chinese steel market and toning down of iron ore supply growth guidance
3,964.7
by BHP, Rio Tinto and Vale. Appreciation of AUD and BRL against USD puts
137/75
inflationary pressure on the cost structure of iron ore mines in Australia and Brazil
-5/6/-17
that comprise over 90% of seaborne supply.
392.5
5.9
236
20.0
Stock Info
Bloomberg
Equity Shares (m)
52-Week Range (INR)
1, 6, 12 Rel. Per (%)
M.Cap. (INR b)
M.Cap. (USD b)
Avg Val ( INR m)
Free float (%)
Financials Snapshot (INR b)
Y/E Mar
2016E 2017E 2018E
Sales
66.8 68.3 67.3
EBITDA
35.5 38.6 36.0
Adj. PAT
33.8 34.3 30.5
Adj. EPS (INR)
8.5
8.6
7.7
EPS Gr(%)
-48.6
1.2 -11.0
BV/Sh. (INR)
79.0 82.9 85.9
RoE (%)
15.7 10.6
9.7
RoCE (%)
15.6 10.6
9.6
P/E (x)
11.5 11.4 12.8
P/BV
1.2
1.2
1.1
Shareholding pattern (%)
As On
Promoter
DII
FII
Others
Dec-15 Sep-15 Dec-14
80.0
13.6
4.0
2.4
80.0
13.0
3.6
3.5
80.0
11.2
6.2
2.6
NMDC’s pricing power too has improved
Taking clues from the international market, NMDC has also increased prices in
March/April by 17-19% (or INR300/ton). At current global iron ore price (cfr China)
of ~USD65/dmt, we believe there is further headroom for NMDC to increase prices.
The landed prices of iron ore fines are at 6% discount to imports for a consumer
like JSW Dolvi - farthest customer from NMDC’s mines at the western coast of
India. This implies that NMDC can increase prices by ~INR350/ton as long as iron
ore prices remain above USD65/dmt. Although prices in global trade are higher,
exports from Chhattisgarh (at 30% export duty) are still unviable. NMDC can sell
under the MoU route (concessional export duty of 10%), but the volumes there are
not scalable.
Domestic supply can be party pooper
Although NMDC has raised prices, domestic private miners have not been able to
increase prices similarly and can put NMDC’s realization/volumes at risk. Prices of
iron ore in Odisha have remained virtually unchanged despite the huge 73% jump
in seaborne trade prices. Overcapacity and lack of export viability (because of 30%
export duty on high grade ore) are key reasons behind subdued domestic pricing.
There has been a huge jump in iron ore mining capacity after amendment of
MMDRA in January 2015. The leases of all merchant mines will expire by March
2020, which has put pressure on them to maximize volumes. Further, Essar Steel
has recently secured a lease in auction in Odisha. Jindal Steel has got a favorable
decision, allowing it to lift 10-12mt of inventories from Sarda Mines. Demand from
Essar and Jindal Steel has declined.
Raising FY17 realization estimate by 23%; target price to INR90
We are increasing our estimate for NMDC’s domestic iron ore realization by 23% to
INR2,213/wmt for FY17 to reflect latest prices. We are expecting volumes to
increase by 7% to 30.9mt in FY17. Resultantly, EBITDA has increased by 38% to
INR38.5b. We have raised our target price from INR78/share to INR90/share.
Maintain
Sell.
FII Includes depository receipts
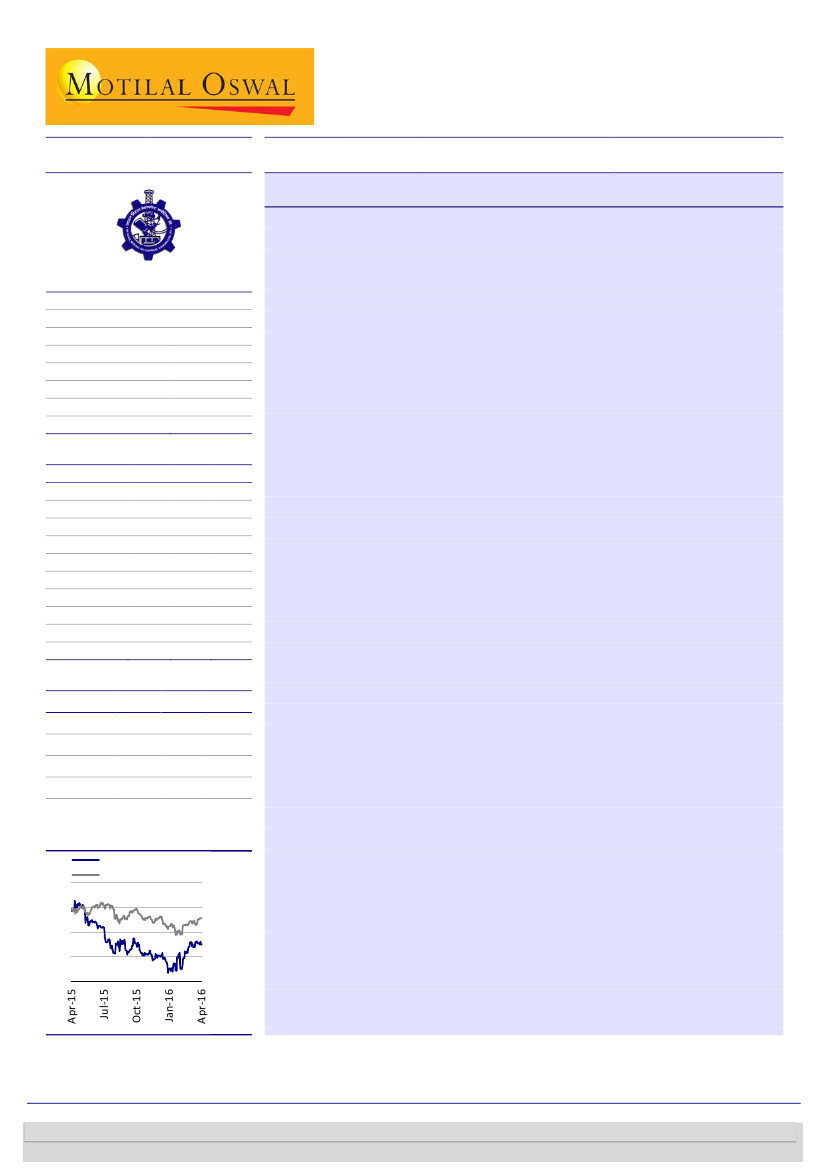
Stock Performance (1-year)
NMDC
Sensex - Rebased
150
130
110
90
70
Sanjay Jain
(SanjayJain@MotilalOswal.com); +91 22 3982 5412
Dhruv Muchhal
(Dhruv.Muchhal@MotilalOswal.com); +91 22 3027 8033
Investors are advised to refer through important disclosures made at the last page of the Research Report.
Motilal Oswal research is available on www.motilaloswal.com/Institutional-Equities, Bloomberg, Thomson Reuters, Factset and S&P Capital.

NMDC
Iron ore price outlook has improved
Iron ore prices have surged by 73% from the lowest point achieved in December
2015 driven by strong Chinese steel market and toning down of iron ore supply
growth guidance by BHP, Rio Tinto and Vale. Appreciation of AUD and BRL against
USD has inflationary pressure on the cost structure of iron ore mines in Australia
and Brazil who comprise of more 90% of seaborne supply.
Iron ore prices have surged
73% from lows of
USD38/dmt in dec 2015
Exhibit 1: Iron ore prices for 62% grade (USD/dmt)
70
60
50
40
30
CIF
FOB
CIF=delivered to Chinese ports; Fob=free on board Indian export ports
Source: Bloomberg, MOSL
NMDC’s pricing power too has improved
NMDC too has taken a clue from international market and has increased prices in
the month of March and April by a total of 17-19%.
NMDC has increased prices
of fines, but Odisha mines
have not increased prices
Exhibit 2: Prices of iron ore fines in India
Rungta Fines 63% (Odisha, incl. royalty)
3,400
2,700
2,000
1,300
NMDC Fines, ex-royalty
Source: MOSL, Company
According to our calculations, there is more headroom to increase prices. At Iron ore
prices of USD65/dmt. The landed prices of iron ore fines are at 6% discount to
imports for a consumer like JSW Dolvi - farthest customer from NMDC’s mines at
west coast of India. This implies that NMDC can increase prices by ~INR350/t as long
as iron ore prices remain above USD65/dmt.
25 April 2016
2

NMDC
NMDC can theoretically
increase prices by INR350/t
as long as iron ore prices
remain above USD65/dmt
Exhibit 3: Iron ore fines: landed cost to Indian steel mills (NMDC v/s. Imports)
(a) Landed cost from NMDC
(b) Landed cost of imports
NMDC premium/(discount) to imported
(a) calculations for landed cost from NMDC
Ex-Mine Price
add: royalty@15%
add: transportation/port handling
Landed cost at plant
(b) calculations for landed cost of imports
Iron ore lumps cfr
less: moisture (8%)
add: import duty (2.5%)
Landed cost at plant
Unit
USD/wmt
USD/wmt
USD/wmt
INR/wmt
INR/wmt
INR/wmt
INR/wmt
USD/wmt
USD/dmt
USD/wmt
USD/wmt
USD/wmt
Dolvi
60
66
-6
1,860
363
1,750
3,973
60
65
5
6
66
Essar
48
66
-19
1,860
363
950
3,173
48
65
5
6
66
RINL
49
66
-17
1,860
363
1,050
3,273
49
65
5
6
66
USD/INR exchange rate = 66.4 IODEX65USD/T, CFR China basis
Source: MOSL
But, domestic supply is party pooper
It is interesting to note that other private mines are not able to increase prices in
similar way. Prices of iron ore in Odisha have remained virtually unchanged despite
huge 73% jump in seaborne trades. Overcapacity and lack of exports viability
(because of 30% export duty on high grade ore) are key reasons behind subdued
domestic pricing scenario. There is huge jump in iron ore mining capacity after
amendment of MMDRA in Jan 2015. The leases of all merchant mines will expire by
March 2020, which has put pressure on them to maximize volumes. Further, Essar
steel has recently secured a lease in auction in Odisha. Jindal steel has got favorable
decision allowing it to lift nearly 10-12mt of inventories from Sarda mines. The
demand from Essar and Jindal steel has declined.
Domestic supply far
outstrips local demands
Exhibit 4: Indian iron ore supply (mt)
Karnataka
13
12 18
25
25
Goa
Orissa
Jharkhand
Chattisgarh
22
74 79 76 67 64 76 47 70 80
25
64 70
19
41 53
22 31
14 14 15 16 18 19 21 21 23 22 19 18 23 23 23 23
5
20 20 23 23 26 29 31 30 26 29 30 28 30 31 26 32
32
37
40
41
43 39
49 46
Source: MOSL
25 April 2016
3

NMDC
Exports of high grade ore is
still not viable due to high
export duty of 30%
Exhibit 5: Margin calculations for iron ore exports from Chhattisgarh mines
Deductions
CFR price for 62%
moister
Sea Freight
Export duty
Port charges
Rail freight
Road handling
Royalty
mining cost
EBITDA per ton
USD/dmt
8.10%
USD/wmt
30%
USD/wmt
USD/wmt
USD/wmt
USD/wmt
USD/wmt
USD/wmt
5.3
8
15.5
0
24
0
7.1
7.5
Residual realization
65
60
52
36
36
12
12
5
-2
-2
Source: MOSL
Although export of high grade ore is unviable in general, NMDC has started
generating some margins on its MoU with Japan and Korea under concessional
export duty of 10% under special govt. dispensation. However, this is not scalable.
Margins are returning in
MoU with Japan and Korea.
But this is not scalable
Exhibit 6: Margin calculations under MoU with Japan and Korea
Deductions
CFR price for 62%
moister
Sea Freight
Export duty
Port charges
Rail freight
Road handling
Royalty
mining cost
EBITDA per ton
USD/dmt
8.1%
USD/wmt
10%
USD/wmt
USD/wmt
USD/wmt
USD/wmt
USD/wmt
USD/wmt
5.3
8.0
5.2
0.0
24.0
0.0
9.1
7.5
Residual realization
65
60
52
47
47
23
23
13
6
6
Source: MOSL
Global iron ore prices have increased sharply by 73% to ~USD65/dmt, but the
sustainability of prices at these levels remains a question mark. At these prices, we
expect supply growth to kick-in and put pressure on prices.
We are increasing NMDC’s domestic iron ore realization by 23% to INR2,213/wmt
for FY17E to reflect latest prices. We are expecting volumes to increase by 7% to
30.9mt inFY17E. Resultantly, EBITDA has increased by 38% to INR38.5b. Target has
increased from INR78 to INR90/share.
Exhibit 7: Target price derivation
Y/E March
EBITDA per ton (INR)
Volumes (m tons)
EBITDA
Target EV/EBITDA(x)
Target EV
Less: Net Debt
Add: CWIP@50% discount
Equity Value
Target price (INR/share)
2014
2,548
30.5
77,713
2015
2,549
30.5
77,777
4.0
311,107
2016E
1,229
28.9
35,459
4.0
141,835
-153,238
53,469
348,542
88
2017E
1,250
30.9
38,561
4.0
154,245
-130,540
71,708
356,494
90
2018E
1,096
32.9
36,020
4.0
144,079
-122,122
81,213
347,414
88
Source: MOSL, Company
25 April 2016
4

NMDC
Financials and Valuations
Income Statement
Y/E Mar
Net Sales
Change (%)
EBITDA
EBITDA Margin (%)
Depreciation
EBIT
Interest
Other Income
Extraordinary items
PBT
Tax
Tax Rate (%)
Min. Int. & Assoc. Share
Reported PAT
Adjusted PAT
Change (%)
2011
113,689
82.2
86,430
76.0
1,215
85,215
0
12,057
0
97,272
32,280
33.2
0
64,992
64,992
88.8
2012
112,615
-0.9
89,281
79.3
1,328
87,953
0
20,169
-513
107,610
34,941
32.5
0
72,669
73,015
12.3
2013
107,043
-4.9
77,838
72.7
1,385
76,452
0
22,389
-4,058
94,783
31,228
32.9
0
63,556
66,277
-9.2
2014
120,582
12.6
77,713
64.4
1,504
76,209
0
20,945
455
97,609
33,391
34.2
0
64,218
63,919
-3.6
2015
123,564
2.5
77,777
62.9
1,622
76,155
0
23,200
0
99,354
33,460
33.7
0
65,895
65,895
3.1
2016E
66,798
-45.9
35,459
53.1
1,966
33,493
0
17,865
0
51,357
17,514
34.1
0
33,844
33,844
-48.6
2017E
68,300
2.2
38,561
56.5
2,282
36,279
0
14,101
0
50,380
16,122
32.0
0
34,259
34,259
1.2
(INR Million)
2018E
67,347
-1.4
36,020
53.5
2,519
33,501
0
11,347
0
44,847
14,351
32.0
0
30,496
30,496
-11.0
Balance Sheet
Y/E Mar
Share Capital
Reserves
Net Worth
Debt
Deferred Tax
Total Capital Employed
Gross Fixed Assets
Less: Acc Depreciation
Net Fixed Assets
Capital WIP
Investments
Current Assets
Inventory
Debtors
Cash & Bank
Loans & Adv, Others
Curr Liabs & Provns
Curr. Liabilities
Provisions
Net Current Assets
Total Assets
E: MOSL Estimates
2011
3,965
188,181
192,145
0
1,029
193,174
22,728
11,736
10,993
6,772
1,357
191,860
4,154
4,854
172,281
10,571
17,807
6,145
11,662
174,053
193,174
2012
3,965
240,099
244,064
0
1,001
245,065
23,882
11,994
11,888
19,147
2,478
232,972
4,589
7,370
202,646
18,367
21,420
6,447
14,973
211,552
245,065
2013
3,965
271,145
275,110
0
1,045
276,155
26,025
13,379
12,647
32,808
2,497
260,992
6,375
10,822
210,258
33,538
32,788
11,094
21,694
228,204
276,155
2014
3,965
295,918
299,883
0
1,073
300,956
28,506
14,883
13,623
57,613
2,504
241,029
6,812
14,484
186,572
33,161
13,814
11,092
2,722
227,216
300,956
2015
3,965
319,353
323,317
0
984
324,301
31,969
16,505
15,464
74,973
5,619
248,642
6,919
17,523
184,431
39,768
20,397
2,263
18,134
228,245
324,301
2016E
3,965
309,129
313,093
0
984
314,077
35,969
18,471
17,498
106,938
5,619
205,817
3,660
9,150
153,238
39,768
21,794
3,660
18,134
184,023
314,077
2017E
3,965
324,832
328,797
0
984
329,781
39,969
20,754
19,215
143,416
5,619
183,407
3,742
9,356
130,540
39,768
21,877
3,742
18,134
161,531
329,781
(INR Million)
2018E
3,965
336,774
340,739
0
984
341,723
43,969
23,273
20,696
162,426
5,619
174,806
3,690
9,226
122,122
39,768
21,824
3,690
18,134
152,981
341,723
25 April 2016
5

NMDC
Financials and Valuations
Ratios
Y/E Mar
Basic (INR)
EPS
Cash EPS
Book Value
DPS
Payout (incl. Div. Tax.)
Valuation(x)
P/E
Cash P/E
Price / Book Value
EV/Sales
EV/EBITDA
Dividend Yield (%)
EV/ton
Profitability Ratios (%)
RoE
RoCE
RoIC
Turnover Ratios (%)
Asset Turnover (x)
Debtors (No. of Days)
Leverage Ratios (%)
Net Debt/Equity (x)
-0.9
2011
86,430
12,057
-1,162
-32,280
-4,549
60,496
-6,228
54,268
-595
0
-6,823
0
0
0
-9,942
-9,942
43,731
128,549
172,281
-0.8
2012
89,281
19,656
-7,134
-34,941
-2,739
64,123
-13,529
50,595
-1,121
0
-14,650
0
0
0
-19,109
-19,109
30,365
172,281
202,646
-0.8
2013
77,838
18,331
-9,040
-31,228
5
55,906
-15,805
40,102
-19
0
-15,824
0
0
0
-32,471
-32,471
7,612
202,646
210,258
-0.6
2014
77,713
21,400
-22,697
-33,391
12
43,037
-27,286
15,751
-7
0
-27,293
0
0
0
-39,429
-39,429
-23,685
210,258
186,572
-0.6
2015
77,777
23,200
-3,170
-33,460
-2,888
61,459
-20,823
40,636
-3,116
0
-23,939
0
0
0
-39,661
-39,661
-2,141
186,572
184,431
-0.5
2016E
35,459
17,865
13,029
-17,514
0
48,839
-35,964
12,874
0
0
-35,964
0
0
0
-44,068
-44,068
-31,193
184,431
153,238
-0.4
2017E
38,561
14,101
-206
-16,122
0
36,335
-40,478
-4,143
0
0
-40,478
0
0
0
-18,555
-18,555
-22,698
153,238
130,540
-0.4
0.6
16
0.5
24
0.4
37
0.4
44
0.4
52
0.2
50
0.2
50
0.2
50
29.7
29.5
403.2
31.6
31.5
346.6
26.8
26.7
215.3
22.6
22.6
119.5
20.8
20.8
88.6
15.7
15.6
67.5
10.6
10.6
47.5
9.7
9.6
46.6
6.1
6.0
1.3
1.7
2.6
8.6
2
5.9
5.8
1.2
1.7
2.6
8.7
2
11.5
10.9
1.2
3.6
6.7
9.6
3
11.4
10.7
1.2
3.8
6.7
4.1
3
12.8
11.8
1.1
4.0
7.5
4.1
3
16.4
16.7
48.5
2.2
15.3
18.4
18.8
61.6
4.5
26.3
16.7
17.1
69.4
7.0
51.1
16.1
16.5
75.6
8.5
61.4
16.6
17.0
81.5
8.6
60.2
8.5
9.0
79.0
9.5
130.2
8.6
9.2
82.9
4.0
54.2
7.7
8.3
85.9
4.0
60.8
2011
2012
2013
2014
2015
2016E
2017E
2018E
Cash Flow Statement
Y/E Mar
Adjusted EBITDA
Non cash opr. exp (inc)
(Inc)/Dec in Wkg. Cap.
Tax Paid
Other operating activities
CF from Op. Activity
(Inc)/Dec in FA & CWIP
Free cash flows
(Pur)/Sale of Invt
Others
CF from Inv. Activity
Inc/(Dec) in Net Worth
Inc / (Dec) in Debt
Interest Paid
Divd Paid (incl Tax) & Others
CF from Fin. Activity
Inc/(Dec) in Cash
Add: Opening Balance
Closing Balance
E: MOSL Estimates
(INR Million)
2018E
36,020
11,347
131
-14,351
0
33,146
-23,010
10,136
0
0
-23,010
0
0
0
-18,555
-18,555
-8,419
130,540
122,122
25 April 2016
6

NMDC GALLERY
NMDC
OTHER COMPANIES
SECTOR UPDATES

Disclosures
This document has been prepared by Motilal Oswal Securities Limited (hereinafter referred to as Most) to provide information about the company (ies) and/sector(s), if any, covered in the report and may be distributed by it and/or its
NMDC
affiliated company(ies). This report is for personal information of the selected recipient/s and does not construe to be any investment, legal or taxation advice to you. This research report does not constitute an offer, invitation or
inducement to invest in securities or other investments and Motilal Oswal Securities Limited (hereinafter referred as MOSt) is not soliciting any action based upon it. This report is not for public distribution and has been furnished to
you solely for your general information and should not be reproduced or redistributed to any other person in any form. This report does not constitute a personal recommendation or take into account the particular investment
objectives, financial situations, or needs of individual clients. Before acting on any advice or recommendation in this material, investors should consider whether it is suitable for their particular circumstances and, if necessary, seek
professional advice. The price and value of the investments referred to in this material and the income from them may go down as well as up, and investors may realize losses on any investments. Past performance is not a guide for
future performance, future returns are not guaranteed and a loss of original capital may occur.
MOSt and its affiliates are a full-service, integrated investment banking, investment management, brokerage and financing group. We and our affiliates have investment banking and other business relationships with a some
companies covered by our Research Department. Our research professionals may provide input into our investment banking and other business selection processes. Investors should assume that MOSt and/or its affiliates are
seeking or will seek investment banking or other business from the company or companies that are the subject of this material and that the research professionals who were involved in preparing this material may educate investors
on investments in such business . The research professionals responsible for the preparation of this document may interact with trading desk personnel, sales personnel and other parties for the purpose of gathering, applying and
interpreting information. Our research professionals are paid on twin parameters of performance & profitability of MOSt.
MOSt generally prohibits its analysts, persons reporting to analysts, and members of their households from maintaining a financial interest in the securities or derivatives of any companies that the analysts cover. Additionally, MOSt
generally prohibits its analysts and persons reporting to analysts from serving as an officer, director, or advisory board member of any companies that the analysts cover. Our salespeople, traders, and other professionals or affiliates
may provide oral or written market commentary or trading strategies to our clients that reflect opinions that are contrary to the opinions expressed herein, and our proprietary trading and investing businesses may make investment
decisions that are inconsistent with the recommendations expressed herein. In reviewing these materials, you should be aware that any or all of the foregoing among other things, may give rise to real or potential conflicts of interest.
MOSt and its affiliated company(ies), their directors and employees and their relatives may; (a) from time to time, have a long or short position in, act as principal in, and buy or sell the securities or derivatives thereof of companies
mentioned herein. (b) be engaged in any other transaction involving such securities and earn brokerage or other compensation or act as a market maker in the financial instruments of the company(ies) discussed herein or act as an
advisor or lender/borrower to such company(ies) or may have any other potential conflict of interests with respect to any recommendation and other related information and opinions.; however the same shall have no bearing
whatsoever on the specific recommendations made by the analyst(s), as the recommendations made by the analyst(s) are completely independent of the views of the affiliates of MOSt even though there might exist an inherent
conflict of interest in some of the stocks mentioned in the research report Reports based on technical and derivative analysis center on studying charts company's price movement, outstanding positions and trading volume, as
opposed to focusing on a company's fundamentals and, as such, may not match with a report on a company's fundamental analysis. In addition MOST has different business segments / Divisions with independent research
separated by Chinese walls catering to different set of customers having various objectives, risk profiles, investment horizon, etc, and therefore may at times have different contrary views on stocks sectors and markets.
Unauthorized disclosure, use, dissemination or copying (either whole or partial) of this information, is prohibited. The person accessing this information specifically agrees to exempt MOSt or any of its affiliates or employees from,
any and all responsibility/liability arising from such misuse and agrees not to hold MOSt or any of its affiliates or employees responsible for any such misuse and further agrees to hold MOSt or any of its affiliates or employees free
and harmless from all losses, costs, damages, expenses that may be suffered by the person accessing this information due to any errors and delays. The information contained herein is based on publicly available data or other
sources believed to be reliable. Any statements contained in this report attributed to a third party represent MOSt’s interpretation of the data, information and/or opinions provided by that third party either publicly or through a
subscription service, and such use and interpretation have not been reviewed by the third party. This Report is not intended to be a complete statement or summary of the securities, markets or developments referred to in the
document. While we would endeavor to update the information herein on reasonable basis, MOSt and/or its affiliates are under no obligation to update the information. Also there may be regulatory, compliance, or other reasons that
may prevent MOSt and/or its affiliates from doing so. MOSt or any of its affiliates or employees shall not be in any way responsible and liable for any loss or damage that may arise to any person from any inadvertent error in the
information contained in this report. MOSt or any of its affiliates or employees do not provide, at any time, any express or implied warranty of any kind, regarding any matter pertaining to this report, including without limitation the
implied warranties of merchantability, fitness for a particular purpose, and non-infringement. The recipients of this report should rely on their own investigations.
This report is intended for distribution to institutional investors. Recipients who are not institutional investors should seek advice of their independent financial advisor prior to taking any investment decision based on this report or for
any necessary explanation of its contents.
Most and it’s associates may have managed or co-managed public offering of securities, may have received compensation for investment banking or merchant banking or brokerage services, may have received any compensation
for products or services other than investment banking or merchant banking or brokerage services from the subject company in the past 12 months.
Most and it’s associates have not received any compensation or other benefits from the subject company or third party in connection with the research report.
Subject Company may have been a client of Most or its associates during twelve months preceding the date of distribution of the research report
MOSt and/or its affiliates and/or employees may have interests/positions, financial or otherwise of over 1 % at the end of the month immediately preceding the date of publication of the research in the securities mentioned in this
report. To enhance transparency, MOSt has incorporated a Disclosure of Interest Statement in this document. This should, however, not be treated as endorsement of the views expressed in the report.
Motilal Oswal Securities Limited is registered as a Research Analyst under SEBI (Research Analyst) Regulations, 2014. SEBI Reg. No. INH000000412
Pending Regulatory inspections against Motilal Oswal Securities Limited:
SEBI pursuant to a complaint from client Shri C.R. Mohanraj alleging unauthorized trading, issued a letter dated 29th April 2014 to MOSL notifying appointment of an Adjudicating Officer as per SEBI regulations to hold inquiry and
adjudge violation of SEBI Regulations; MOSL replied to the Show Cause Notice whereby SEBI granted us an opportunity of Inspection of Documents. Since all the documents requested by us were not covered we have requested to
SEBI vide our letter dated June 23, 2015 to provide pending list of documents for inspection.
List of associate companies of Motilal Oswal Securities Limited -Click
here to access detailed report
Analyst Certification
The views expressed in this research report accurately reflect the personal views of the analyst(s) about the subject securities or issues, and no part of the compensation of the research analyst(s) was, is, or will be directly or
indirectly related to the specific recommendations and views expressed by research analyst(s) in this report. The research analysts, strategists, or research associates principally responsible for preparation of MOSt research receive
compensation based upon various factors, including quality of research, investor client feedback, stock picking, competitive factors and firm revenues
Disclosure of Interest Statement
Analyst ownership of the stock
Served as an officer, director or employee
NMDC
No
No
A graph of daily closing prices of securities is available at www.nseindia.com and http://economictimes.indiatimes.com/markets/stocks/stock-quotes
Regional Disclosures (outside India)
This report is not directed or intended for distribution to or use by any person or entity resident in a state, country or any jurisdiction, where such distribution, publication, availability or use would be contrary to law, regulation or which
would subject MOSt & its group companies to registration or licensing requirements within such jurisdictions.
For Hong Kong:
This report is distributed in Hong Kong by Motilal Oswal capital Markets (Hong Kong) Private Limited, a licensed corporation (CE AYY-301) licensed and regulated by the Hong Kong Securities and Futures
Commission (SFC) pursuant to the Securities and Futures Ordinance (Chapter 571 of the Laws of Hong Kong) “SFO”. As per SEBI (Research Analyst Regulations) 2014 Motilal Oswal Securities (SEBI Reg No. INH000000412) has
an agreement with Motilal Oswal capital Markets (Hong Kong) Private Limited for distribution of research report in Kong Kong. This report is intended for distribution only to “Professional Investors” as defined in Part I of Schedule 1 to
SFO. Any investment or investment activity to which this document relates is only available to professional investor and will be engaged only with professional investors.” Nothing here is an offer or solicitation of these securities,
products and services in any jurisdiction where their offer or sale is not qualified or exempt from registration. The Indian Analyst(s) who compile this report is/are not located in Hong Kong & are not conducting Research Analysis in
Hong Kong.
For U.S
Motilal Oswal Securities Limited (MOSL) is not a registered broker - dealer under the U.S. Securities Exchange Act of 1934, as amended (the"1934 act") and under applicable state laws in the United States. In addition MOSL is not a
registered investment adviser under the U.S. Investment Advisers Act of 1940, as amended (the "Advisers Act" and together with the 1934 Act, the "Acts), and under applicable state laws in the United States. Accordingly, in the
absence of specific exemption under the Acts, any brokerage and investment services provided by MOSL, including the products and services described herein are not available to or intended for U.S. persons.
This report is intended for distribution only to "Major Institutional Investors" as defined by Rule 15a-6(b)(4) of the Exchange Act and interpretations thereof by SEC (henceforth referred to as "major institutional investors"). This
document must not be acted on or relied on by persons who are not major institutional investors. Any investment or investment activity to which this document relates is only available to major institutional investors and will be
engaged in only with major institutional investors. In reliance on the exemption from registration provided by Rule 15a-6 of the U.S. Securities Exchange Act of 1934, as amended (the "Exchange Act") and interpretations thereof by
the U.S. Securities and Exchange Commission ("SEC") in order to conduct business with Institutional Investors based in the U.S., MOSL has entered into a chaperoning agreement with a U.S. registered broker-dealer, Motilal Oswal
Securities International Private Limited. ("MOSIPL"). Any business interaction pursuant to this report will have to be executed within the provisions of this chaperoning agreement.
The Research Analysts contributing to the report may not be registered /qualified as research analyst with FINRA. Such research analyst may not be associated persons of the U.S. registered broker-dealer, MOSIPL, and therefore,
may not be subject to NASD rule 2711 and NYSE Rule 472 restrictions on communication with a subject company, public appearances and trading securities held by a research analyst account.
For Singapore
Motilal Oswal Capital Markets Singapore Pte Limited is acting as an exempt financial advisor under section 23(1)(f) of the Financial Advisers Act(FAA) read with regulation 17(1)(d) of the Financial Advisors Regulations and is a
subsidiary of Motilal Oswal Securities Limited in India. This research is distributed in Singapore by Motilal Oswal Capital Markets Singapore Pte Limited and it is only directed in Singapore to accredited investors, as defined in the
Financial Advisers Regulations and the Securities and Futures Act (Chapter 289), as amended from time to time.
In respect of any matter arising from or in connection with the research you could contact the following representatives of Motilal Oswal Capital Markets Singapore Pte Limited:
Varun Kumar
Varun.kumar@motilaloswal.com
Contact : (+65) 68189232
Office Address:21 (Suite 31),16 Collyer Quay,Singapore 04931
Kadambari Balachandran
kadambari.balachandran@motilaloswal.com
(+65) 68189233 / 65249115
25 April 2016
Motilal Oswal Tower, Level 9, Sayani Road, Prabhadevi, Mumbai 400 025
Phone: +91 22 3982 5500 E-mail: reports@motilaloswal.com
Motilal Oswal Securities Ltd
8