26 April 2016
4QFY16 Results Update | Sector:
Financials
BSE SENSEX
25,679
Bloomberg
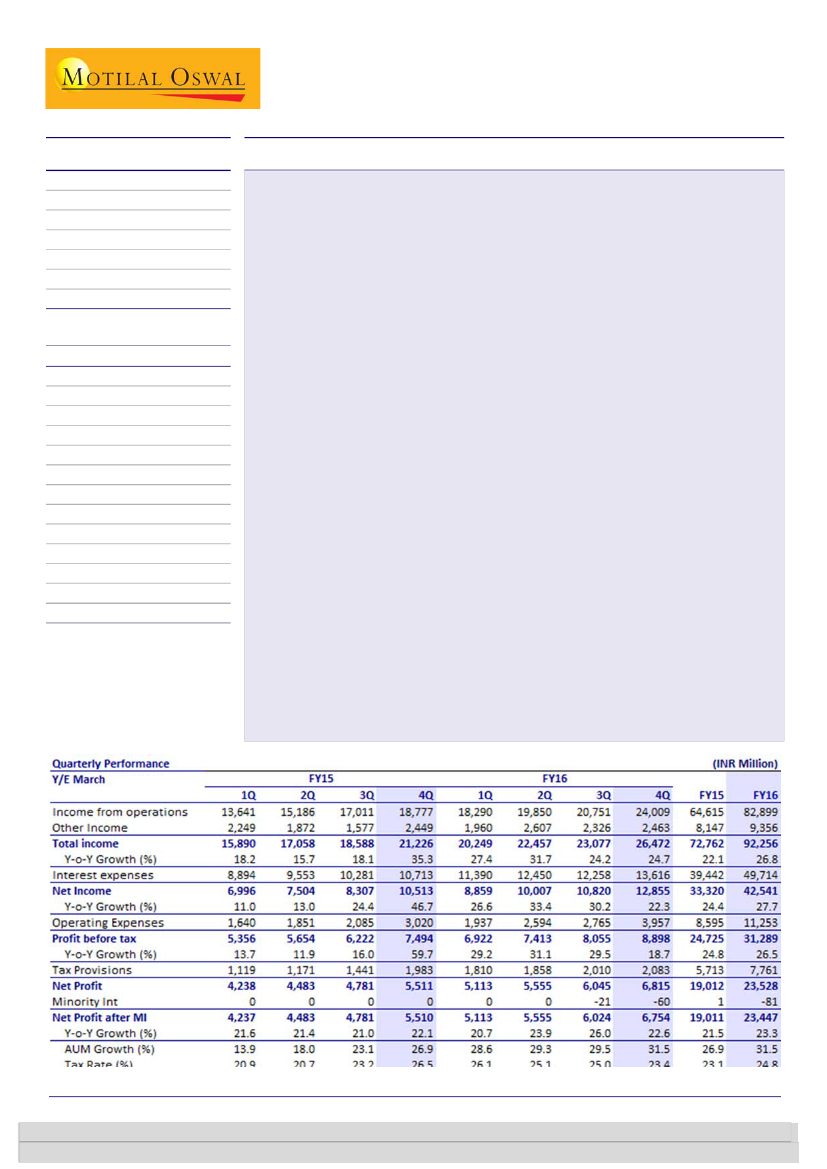
Indiabulls Housing Finance’s (IHFL) PAT grew 23% YoY and 12% QoQ to INR6.75b
Equity Shares (m)
426.2
(in line). AUM growth of 31.5% YoY, stable asset quality and spreads of 318bp
M.Cap. (INR b) / (USD b) 293.7/4.3
were the key highlights of the quarter.
52-Week Range (INR)
820 / 518
Strong disbursements growth (+40% YoY) drove AUM up 29.5% YoY to INR687b.
1, 6, 12 Rel. Per (%)
3/-4/28
Loan mix continued to shift in favor of housing loans. Management guided over
Avg Val (INR m)
1338
the next two years share of housing loans will increase to 60% (52% as of FY16);
Free float (%)
75.8
LAP and LRD would be 20% each. Home loan disbursements to salaried segment
were 70% of overall disbursement and balance were to self-employed. The
Financials & Valuation (INR Billion)
proportion is likely to be stable in the ensuing years.
Y/E March
2016 2017E 2018E
NII growth remained healthy at 29% YoY on the back of 318bp of book spreads and
Net Fin inc
28.7 36.0 45.7
300bp incremental spreads, aided by reduction in cost of funds. Overall cost of
PPP
36.3 44.5 55.4
funds stood at 9.34% whereas incremental borrowing cost stood 8.84%. GNPAs
EPS (INR)
55.7 68.6 85.4
remained stable sequentially at 0.84% v/s 0.83% in 3QFY16; however provisions at
EPS Gr. (%)
4.1 23.3 24.4
INR2.15b were up 39% YoY as the company provided additional buffer of INR1b.
BV/Sh. (INR)
254 280 316
RoA on AUM
3.4
3.3
3.4
Other highlights:
a) Spike in fee income came from 2 large loans underwritten. b)
(%)
Increase in opex was driven by continues investment into franchise and higher CSR
RoE (%)
27.1 25.7 28.6
Payout (%)
64.7 52.5 50.0
expenses. c) O/S ZCBs stand at INR12b v/s INR20b in 4Q15- wont issue further
Valuations
ZCBs. d) Sold loans of INR37.9b in FY16 v/s 25b in FY15 e) Not looking to raise
P/E (x)
12.1
9.8
7.9
capital for next 6-7 years.
P/BV (x)
2.6
2.4
2.1
Valuation and view:
IHFL’s transformation from a diversified lender to a focused
P/ABV (x)
2.6
2.4
2.1
mortgage player has yielded returns, with RoE/RoA improving from 3%/0.8% in
Div. Yield (%)
5.4
5.4
6.4
FY09 to +26%/3.5% in FY16. Focus on mortgage and market share gains will drive
AUM growth of 24% for the next three years. IHFL is among the lowest-levered
HFCs (4.7x) to support growth. Asset quality trend is likely to remain stable.
Improved borrowing profile, better credit rating and liquidity buffer will aid the
company maintain healthy spreads. De-risked business model, superior
profitability and +5% dividend yield warrant premium. The stock is trading at PBV
of 2.1x FY18E. Maintain
Buy
with a target price of INR868 (2.75x FY18E PB).
S&P CNX
7,855
IHFL IN
CMP: INR671
Indiabulls Housing Finance
TP: INR868 (+29%)
Buy
Sunesh Khanna
(Sunesh.Khanna@MotilalOswal.com); +91 22 3982 5521
Alpesh Mehta
(Alpesh.Mehta@MotilalOswal.com);
+91 22 3982 5415
Investors are advised to refer through important disclosures made at the last page of the Research Report.
Motilal Oswal research is available on www.motilaloswal.com/Institutional-Equities, Bloomberg, Thomson Reuters, Factset and S&P Capital.

Indiabulls Housing Finance
Exhibit 1: Quarterly performance v/s expectations and deviations for the same
Particulars
Income from operations
Other Income
Total income
Interest expenses
Net Income
Operating Expenses
Profit before Tax
Tax Provisions
Net Profit
Minority Int
Net Profit (after minority interest)
Int Exp/ operating inc (%)
Other Income / Total Income (%)
Tax Rate (%)
4QFY16
24,009
2,463
26,472
13,616
12,855
3,957
8,898
2,083
6,755
0
6,755
56.7
9.3
23.4
4QFY16E
22,438
2,463
24,902
12,838
12,063
3,400
8,663
2,086
6,577
0
6,577
58.4
12.0
24.1
Var. (%)
7
0
6
6
7
16
3
0
3
0
3
Comments
Higher than expected AUM growth
Book spreads at 318bp up 2bp QoQ
Higher provisioning to create addational bufffer
In-line with estimate
Source: Company, MOSL
AUM growth up at +31% YoY, led by +40% disbursements growth
Strong disbursements at INR91.3b, grew 42% YoY and 41% QoQ, led to +31.5%
AUM growth at INR687b.
The overall AUM mix skewed continues to be in favor of mortgages (share
remaining stable at 77%), with share of corporate rising to 23%. Share of
commercial vehicle segment continued to fall (as the company is winding off the
CV lending) to 1% of AUM as compared to 3% in 4QFY15.
Management continues to guide growth of upwards of 25%. However the mix
will gradually change in favor of housing loans, will increase from existing 52% to
60% over next 2 years, LAP & LRD would be 20% each.
70% of Home loan and 40% LAP qualify for PSL
Strong growth and increase in spreads led to 29% YoY NII growth
NII growth remained healthy at 29% YoY, on back of strong AUM growth coupled
with 2 bp increase in book spreads of 318bp; aided by reduction in cost of funds.
Overall cost of funds at 9.34% (9.4% in Q3FY16) and incremental borrowing at
8.84%.
Borrowings increased 26.7% YoY to INR602b. The company reduced its exposure
to high cost bank borrowings to 49% (v/s 59% in 4QFY15). Bank borrowings are
substituted by NCD/CP (38% v/s 31% in 4QFY15) and ECBs (2% during the
quarter v/s 1% in the previous year).
ZCBs have come down sharply and now form 2% of borrowings v/s 4.5% last
year. The company has decided not to issue further ZCBs.
Sell down of INR39.7b during FY16 v/s INR25b in FY15. IHFL is looking to fund
25-30% incremental funding requirement from sell-down. (if this works out,
next capital raising would be elongated to 6-7 years).
Asset quality continue to remain stable
GNPA% remained steady at 0.84% and NNPA at 0.35% respectively. GNPAs have
remained stable; however provisions at INR2.15b were up 39% YoY as the
company provided additional buffer of INR1b. Management indicated that
outlook on asset quality remain healthy and it continues to be a key focus area
with target to maintain asset quality in the range of 70-90bp.
2
26 April 2016

Indiabulls Housing Finance
Other highlights:
a) Spike in fee income came from 2 large loans underwritten.
b) Increase in opex was driven by continues investment into franchise and
higher CSR expenses. c) O/S ZCBs stand at INR12b v/s INR20b in 4Q15- won’t
issue further ZCBs.
Valuation and view
Indiabulls Housing Finance Ltd (IHFL) has transformed from a diversified lender
to a focused mortgage player. Mortgage focus has yielded returns, with
RoE/RoA improving from 3%/0.8% in FY09 to +26%/3.5% in FY16.
IHFL has devised a unique strategy – 77% of the book forms mortgage/LAP
(which keeps asset quality under check) and 23% of book forms commercial
credit and commercial vehicles (supports blended spreads of +300bp), thereby
enabling sound asset quality with superior returns.
Disbursement growth has picked up, we believe focus on mortgage and market
share gains will drive AUM growth of ~24% for next three years. One of the
lowest levered HFC (4.7x) and with capital raising completed IHFL would need
no further dilution over the medium term.
Consistent outperformance on key parameters relative to sector. Average three-
year RoE at 27% is the best among the peer group. The company offers superior
return ratios with +5% dividend yield. The stock is trading at PBV of 2.1x FY18.
Maintain
Buy
with a target price of INR868 (2.75x FY18 PB).
Conference call highlights
Macro Highlights
On back of 100% tax exemptions for affordable housing, profits for developer in
affordable segment to be at 30% (vs <20% earlier) and is in-line (could be
higher) than luxury housing projects (~25%)
Several developers have shown interest to operate in this segment; will help
keep RE prices in check and should drive volume growth.
Avg. rental yields in urban India at 3.1% v/s effective interest rate at 4% (post
tax-exemptions to individuals). IHFL expects effective interest rate to fall below
rental yield in 12-18 months and thus expect good growth in terms of new home
sales (last time the same happened was in 2003-2005 when RE saw a bull run)
IHFLs incremental mortgage market share stands at ~7% (including banks)
Growth
Continue to maintain ~25% Loan book and profit growth.
This pace of growth coupled with increasing sell down (Looking to fund 25-30%
incremental funding requirement from sell-down ) would elongate the next
capital raising cycle to 7-10 years.
Increase branch presence by 10% every year by FY18.
26 April 2016
3

Indiabulls Housing Finance
Loan Book and Spreads
Disbursed INR263.6b in FY16 (HL-INR135.4b, LAP-INR64.3b and Commercial
Credit -INR63.8b). Home loan disbursements to salaried segment is 70% and to
SE is 30%- Would continue to maintain the proportion.
52% of the loan book now comprise of pure HL. Looking to increase the same to
60%. LAP now stands at 25%.
Incremental tkt size at ~INR4m in Metros, in NCR at ~INR3m, and in smaller
cities at INR 2m, helping the company to maintain avg tkt size at ~INR2.5m
Yields in HL is at 10.4% (incremental <10%), LAP is at 14.2% and other loans are
at 15.2%; CoF at 9.34%, incremental at 8.84%
NII does not include fee and other charges; NII growth higher than loan book
growth as NIM improved.
C/I Ratio
Looking to increase Fee income by exploring cross-sell opportunity and thus
reduce C/I ratio(tied with HDFC Life during the quarter).
Working to reduce C/I ratio by ~70bp in FY17 and another 60-70bp by FY18
Sell down of INR39.7b during FY16. 70% of HL and 40% LAP qualify for PSL.
Looking to fund 25-30% incremental funding requirement from sell-down.
Sell down apart from lowering the capital requirement also works out to be
cheaper ~50-60bps lower than the bond costs
Credit Cost guidance
Credit cost guidance at 70-90bps
RoE
Looking to achieve ROE at 28-29% by FY19
LAP
LAP book currently at 25% of the total loan book, IHFL focuses on LAP in the
INR2-4m segment.
Incremental LAP loans priced at 12-14%.
All incremental LAP loans are rated by the agencies, at present nearly 60% of the
total LAP book is rated.
Approx. number of LAP borrowers would be at ~4,5000.
26 April 2016
4

Indiabulls Housing Finance
Exhibit 2: Quarterly Snapshot
FY15
1Q
Profit and Loss (INR m)
Income from operations
Interest Expenses
Net Interest Income
Other Income
Total Income
Operating Expenses
Employee
Others
PBT
Taxes
PAT
PAT Post Minority Interest
Asset Quality
GNPA (INR m)
NNPA (INR m)
Gross NPAs (%)
Net NPAs (%)
Provisions on AUM (%)
Margins (%) - (calculated)
Yield on loans
Cost of funds
Spreads
NIMs
Ratios (%)
Cost to Income
Tax Rate
RoE (Calc.)
RoA (Calc.)
Business Details
Disbursements-Quarterly (INR m)
AUM (INR m)
Borrowings (INR m)
Total AUM Mix (%)
Mortgages
Corporate
CV
Liability Mix (%)
Bank Loans
CP
NCD
ECB
Other Details
Dividend (INR/sh)
13,641
8,894
4,747
2,249
6,996
1,640
716
924
5,356
1,119
4,238
4,237
3,529
1,463
0.84
0.35
0.49
2Q
15,186
9,553
5,632
1,872
7,504
1,851
894
956
5,654
1,171
4,483
4,483
3,827
1,523
0.85
0.34
0.51
3Q
17,011
10,281
6,730
1,577
8,307
2,085
817
1,268
6,222
1,441
4,781
4,781
4,135
1,626
0.86
0.34
0.52
4Q
18,777
10,713
8,064
2,449
10,513
3,020
822
2,198
7,494
1,983
5,511
5,510
3,913
1,871
0.85
0.36
0.49
1Q
18,290
11,390
6,900
1,960
8,859
1,937
914
1,023
6,922
1,810
5,113
5,113
4,071
1,935
0.85
0.36
0.49
2Q
19,850
12,450
7,400
2,607
10,007
2,594
1,059
1,535
7,413
1,858
5,555
5,555
4,309
2,028
0.84
0.35
0.49
FY16
3QE
20,751
12,258
8,493
2,326
10,820
2,765
1,012
1,753
8,055
2,010
6,045
6,045
4,553
2,169
0.83
0.35
0.48
4QE
24,009
13,616
10,392
2,463
12,855
3,957
1,147
2,811
8,898
2,083
6,815
6,815
5,116
2,393
0.84
0.35
0.49
Variation (%)
QoQ
YoY
16
11
22
6
19
43
13
60
10
4
13
13
12
10
28
27
29
1
22
31
40
28
19
5
24
24
31
28
9.8
9.7
0.1
4.9
23.4
20.9
30.48
3.74
10.2
9.7
0.6
4.7
24.7
20.7
31.23
3.72
11.2
9.1
2.1
5.2
25.1
23.2
34.54
3.98
12.0
8.9
3.1
6.1
28.7
26.5
30.72
3.49
11.1
9.3
1.8
5.2
21.9
26.1
26.07
3.51
11.2
9.6
1.6
5.2
25.9
25.1
23.08
3.49
10.7
8.4
2.3
5.2
25.6
25.0
25.47
3.66
11.6
8.2
3.4
5.6
30.8
23.4
0.00
0.00
41
10
8
42
32
45
36,700 48,000 53,500 64,190 45,250 61,900 64,740 91,370
420,140 450,268 480,780 522,350 540,215 582,246 622,650 687,000
378,640 411,030 491,560 474,870 508,630 527,620 636,290 689,100
75
21
4
60
8
32
0
8
76
21
3
54
7
28
0
9
76
21
3
53
7
28
1
9
76
22
2
59
7
31
3
9
76
22
2
55
7
35
3
9
76
23
1
47
6
33
2
9
76
23
1
49
6
31
2
9
77
22
1
49
0
38
2
0
0
0
Source: Company, MOSL
26 April 2016
5

Indiabulls Housing Finance
Story in charts
Exhibit 3: Disb. Growth picks up at +42% YoY
Disbursement (INR b)
Exhibit 4: AUM growth of +31% boosted by healthy disb. Gr.
41
91
AUM (INR b)
AUM Gr. (%)
36 33 35 42 36 35 31 38 37
48 54
64
45
62 65
30 30
25 25 23
20 20
14
18
23
30 32
27 29 29
Source: Company, MOSL
*AUM numbers are reclassified, hence not comparable
Exhibit 5: AUM mix squeezed further in favor of mortgage
Others
CV
Corporate
Mortgages
Exhibit 6: Bank borrowing at 49% of overall borrowing
Bank Loans (%)
CP (%)
8 8 8 7 7 6 6 5 4 3 3 2 2 1 1 1
21 21 20 21 21 21 21 21 21 21 21 22 22 23 23 22
71 71 72 72 72 73 73 74 75 76 76 76 76 76 76 77
11
2
28 27 29 30 31
30 32
31 35 2 2
25 27
28 28
33 31 38
10 8 8 8 8 6
8 8
7 7
7
7 7
6 6 0
62 65 63 62 61 59 55 62 60 54 53 59 55
47 49 49
0
NCD (%)
ECB(%)
0
Sell Down (%)
Source: Company, MOSL
Exhibit 7: Asset quality remains healthy
GNPA (%)
NNPA (%)
Exhibit 8: Net gearing (x) declines due to capital raising
5.6 5.7
5.1 5.1 5.3 5.3
6.1 5.9 6.3
3.9
4.3
4.7
0.9 0.8 0.8 0.9 0.9 0.9 0.9 0.8 0.8 0.8
0.8 0.8 0.8 0.8 0.8 0.9
0.3 0.3 0.3 0.3 0.3
0.4 0.5
0.4 0.4 0.3 0.3 0.4 0.4 0.4 0.4 0.4
4.5 4.7
4.1 4.3
Source: Company, MOSL
26 April 2016
6

Indiabulls Housing Finance
Exhibit 9: Financials: Valuation metrics
66
Rating
CMP
Mcap
EPS (INR)
FY17
22.2
58.5
38.9
24.7
74.9
50.5
7.1
4.5
18.0
3.1
FY18
26.6
70.3
46.5
31.3
93.5
63.8
8.4
5.5
21.6
3.7
P/E (x)
FY17
8.3
18.7
12.1
27.5
11.7
19.4
13.4
10.6
3.9
5.9
FY18
6.5
15.5
10.1
21.7
9.4
15.4
11.4
8.7
3.2
4.9
BV (INR)
FY17
147
332
249
206
386
334
69
51
152
31
FY18
166
386
288
237
461
389
77
56
168
34
P/BV (x)
FY17
1.25
3.29
1.89
3.29
2.27
2.94
1.38
0.94
0.46
0.59
FY18
1.04
2.83
1.63
2.87
1.91
2.52
1.23
0.87
0.41
0.54
RoA (%)
FY17
1.39
1.88
1.63
1.38
1.81
1.92
0.94
0.79
1.02
0.58
FY18
1.43
1.85
1.64
1.54
1.84
1.96
0.90
0.83
1.07
0.61
RoE (%)
FY17
13.4
18.9
16.6
13.9
21.0
16.2
10.9
9.1
12.4
10.3
FY18
14.3
19.6
17.3
14.8
22.1
17.6
11.5
10.3
13.5
11.4
ICICIBC*
Buy
HDFCB
Buy
AXSB
Buy
KMB*
Neutral
YES
Buy
IIB
Buy
DCBB
Buy
FB
Neutral
JKBK
Neutral
SIB
Buy
Private
116.7
15.9 13.2
2.36 2.07
Aggregate
SBIN (cons)*
Buy
197
23.2
24.1 28.7
7.7
6.4
243
266
0.77 0.69
0.61 0.64
PNB
Neutral
89
2.7
16.8 21.6
5.3
4.1
220
239
0.41 0.37
0.48 0.55
BOI
Neutral
97
1.2
4.0
18.7 24.0
5.2
318
334
0.30 0.29
0.05 0.19
BOB
Buy
158
5.5
16.4 20.7
9.6
7.6
171
187
0.92 0.84
0.49 0.55
CBK
Neutral
207
1.7
47.3 55.2
4.4
3.8
584
626
0.35 0.33
0.41 0.43
UNBK
Buy
130
1.4
28.2 38.4
4.6
3.4
323
354
0.40 0.37
0.45 0.54
OBC
Neutral
96
0.4
25.0 32.2
3.8
3.0
458
483
0.21 0.20
0.29 0.33
INBK
Buy
100
0.7
21.1 27.4
4.7
3.7
290
311
0.34 0.32
0.45 0.51
CRPBK
Neutral
40
0.1
18.7 21.6
2.2
1.9
152
169
0.27 0.24
0.57 0.59
ANDB
Buy
55
0.5
22.8 27.9
2.4
2.0
196
216
0.28 0.26
0.62 0.65
IDBI
Neutral
71
2.0
5.7
8.7
12.4
8.1
125
132
0.57 0.54
0.29 0.39
DBNK
Neutral
30
0.3
10.0 15.6
3.0
1.9
128
141
0.24 0.22
0.38 0.53
Public
39.7
7.9
6.2
0.62 0.58
Aggregate
HDFC*
Buy
1,112
26.5
35
40
31.6 27.9
188
212
5.93 5.24
2.28 2.28
LICHF
Buy
457
3.5
40
49
11.4
9.4
213
252
2.14 1.81
1.51 1.51
DEWH
Buy
200
0.9
32
40
6.2
5.0
203
234
0.99 0.85
1.25 1.27
IHFL
Buy
671
4.3
68
82
9.9
8.2
302
336
2.22 2.00
3.84 3.69
GRHF
Buy
247
1.4
8
11
29.7 23.2
28
35
8.70 7.00
2.33 2.34
REPCO
Buy
656
0.6
33
42
20.1 15.6
181
218
3.63 3.01
2.16 2.10
RECL
Neutral
172
2.6
44
50
3.9
3.4
332
370
0.52 0.47
1.90 1.88
POWF
Neutral
174
3.5
42
43
4.2
4.0
310
341
0.56 0.51
2.07 1.85
SHTF
Buy
979
3.4
73
92
13.3 10.7
513
585
1.91 1.67
2.21 2.40
MMFS
Buy
298
2.5
16
19
19.2 15.8
119
133
2.50 2.24
2.14 2.26
BAF
Buy
6,850
5.5
303
366 22.6 18.7 1,622 1,928 4.22 3.55
3.04 2.79
MUTH
Buy
196
1.2
25
32
7.9
6.1
156
177
1.26 1.11
2.96 3.22
SKSM
Buy
581
1.1
34
46
17.0 12.7
142
177
4.10 3.29
5.25 5.46
NBFC
57.1
14.4 12.5
2.25 2.01
Aggregate
*Multiples adj. for value of key ventures/Investments; For ICICI Bank and HDFC Ltd BV is adjusted for investments in subsidiaries
(INR) (USDb)
253
22.2
1,092
41.8
470
16.9
680
18.8
879
5.6
982
8.9
95
0.4
48
1.3
69
0.5
18
0.4
10.2
7.9
1.3
9.9
8.4
9.1
5.6
7.5
12.9
12.2
4.7
8.0
11.3
9.4
5.7
11.5
9.1
11.3
6.8
9.1
13.4
13.6
6.8
11.6
24.2
20.4
16.9
23.4
32.4
19.7
14.0
14.1
15.2
13.7
20.3
16.8
27.5
19.8
20.9
18.3
25.7
33.5
21.0
14.4
13.2
16.6
15.0
20.6
19.2
28.8
26 April 2016
7

Indiabulls Housing Finance
Financials and valuations
Income Statement
Y/E March
Financing Income
Financing Charges
Net Financing income
Change (%)
Income from Investments
Fee based income
Net Income
Change (%)
Employee Cost
Other Operating Exp.
Operating profits
Change (%)
Total Provisions
% of operating profit
PBT
Tax
Tax Rate (%)
PAT
Change (%)
Minority Interest
PAT
Change (%)
Dividend (Including tax)
Balance Sheet
Y/E March
Capital
Equity Share Capital
Reserves & Surplus
Net Worth
Equity Net worth
Minority Interest
Borrowings
Change (%)
Deferred Tax Liability
Total Liabilities
Cash and bank balance
Investments
Change (%)
Loans
Change (%)
Net Current Assets
Net Fixed Assets
Total Assets
AUM Mix
Assets Under Management
Change (%)
On Books
% of AUM
Off books
% of AUM
E: MOSL Estimates
2010
14,131
5,981
8,150
13.9
219
1,907
10,370
6.1
1,364
985
8,021
15.6
3,447
43.0
4,573
1,498
32.8
3,075
189.1
62
3,013
203.0
1,938
2011
21,246
8,995
12,252
50.3
1,016
2,465
16,105
55.3
1,656
1,816
12,632
57.5
2,717
21.5
9,915
2,406
24.3
7,509
144.2
82
7,427
146.5
3,620
2012
32,235
19,201
13,035
6.4
1,980
3,604
19,264
19.6
1,924
1,770
15,570
23.3
2,349
15.1
13,220
3,156
23.9
10,065
34.0
83
9,981
34.4
4,709
2013
42,634
25,991
16,643
27.7
2,748
2,397
21,789
13.1
2,245
1,761
17,783
14.2
1,231
6.9
16,551
3,891
23.5
12,661
25.8
76
12,584
26.1
7,277
2014
51,865
32,824
19,041
14.4
4,852
2,329
26,222
20.3
2,637
1,470
22,115
24.4
2,297
10.4
19,818
4,133
20.9
15,685
23.9
44
15,642
24.3
11,298
2015
61,210
39,442
21,768
14.3
8,055
3,439
33,262
26.8
3,249
2,285
27,728
25.4
3,003
10.8
24,725
5,713
23.1
19,012
21.2
1
19,011
21.5
10,531
2016
78,418
49,714
28,704
31.9
8,607
5,230
42,541
27.9
4,131
2,118
36,292
30.9
5,003
13.8
31,289
7,760
24.8
23,529
23.8
82
23,447
23.3
17,750
2017E
97,433
61,445
35,989
25.4
9,898
6,015
51,902
22.0
5,082
2,320
44,500
22.6
5,827
13.1
38,673
9,668
25.0
29,005
23.3
90
28,915
23.3
17,761
(INR
Million)
2018E
121,082
75,375
45,706
27.0
11,383
6,917
64,056
23.4
6,200
2,435
55,422
24.5
7,335
13.2
48,086
12,022
25.0
36,065
24.3
100
35,965
24.4
21,039
2010
620
620
42,481
43,101
43,101
1,109
78,495
14.9
-251
122,454
12,313
11,683
-2.3
105,246
49.3
-7,233
445
122,454
2011
622
622
44,779
45,401
45,401
1,211
193,187
146.1
-722
239,077
21,413
30,894
164.4
194,297
84.6
-7,971
444
239,077
2012
624
624
48,432
49,056
49,056
1,315
252,870
30.9
-1,098
302,143
41,956
17,968
-41.8
254,675
31.1
-12,901
445
302,143
2013
625
625
51,061
51,686
51,686
1,449
312,858
23.7
-1,641
364,351
48,882
23,079
28.4
307,824
20.9
-15,889
456
364,351
2014
668
668
56,387
57,055
57,055
19
355,395
13.6
-1,848
410,622
44,190
29,470
27.7
354,446
15.1
-18,639
469
410,622
2015
711
711
65,606
66,317
66,317
20
474,874
33.6
-26
541,186
34,903
61,638
109.2
460,396
29.9
-16,978
541
541,186
2016
843
843
106,096
106,939
106,939
0
601,900
26.7
-26
708,812
29,028
106,930
73.5
609,000
32.3
-37,521
690
708,812
2017E
843
843
117,250
118,092
118,092
0
712,423
18.4
-26
830,489
6,597
117,623
10.0
749,919
23.1
-45,026
690
830,489
2018E
843
843
132,175
133,018
133,018
0
908,548
27.5
-26
1,041,539
27,262
129,385
10.0
936,647
24.9
-53,130
690
1,041,539
(%)
1,089,125
25.6
936,647
86.0
152,477
14.0
110,232
23.4
105,246
95.5
4,986
4.5
198,250
79.8
194,298
98.0
3,952
2.0
275,212
38.8
253,460
92.1
21,752
7.9
344,250
25.1
307,824
89.4
36,426
10.6
411,690
19.6
354,446
86.1
57,244
13.9
522,350
26.9
460,396
88.1
61,954
11.9
687,000
31.5
609,026
88.7
77,975
11.4
866,958
26.2
749,919
86.5
117,039
13.5
26 April 2016
8

Indiabulls Housing Finance
Financials and valuations
Ratios
Y/E March
Spreads Analysis (%)
Avg. Yield - on Fin. Portfolio
Avg Cost of funds
Interest Spread on on books
Net Interest Margin on AUM
Profitability Ratios (%)
RoE
RoA
RoA (on AUM)
Int. Expended/Int.Earned
Fee income/Net Inc.
Cost/Income Ratio
Empl. Cost/Op. Exps.
Asset quality
GNPA (%)
NNPA (%)
Valuations
Book Value (INR)
BV Growth (%)
Price-BV (x)
Adjusted BV (INR)
Price-ABV (x)
EPS (INR)
EPS Growth (%)
Price-Earnings (x)
DPS (INR)
Dividend Payout (%)
Dividend Yield (%)
E: MOSL Estimates
2010
15.9
8.1
7.8
8.2
2011
14.6
6.6
8.0
7.9
2012
14.1
8.6
5.5
5.5
2013
13.5
10.1
3.4
5.4
2014
13.1
10.1
3.0
5.0
2015
12.7
9.7
3.0
4.7
2016
12.6
9.4
3.2
4.7
2017E
12.5
9.4
3.2
4.6
2018E
12.4
9.3
3.1
4.7
7.9
2.7
2.4
42.3
18.4
22.7
58.1
16.8
4.1
4.0
42.3
15.3
21.6
47.7
21.1
3.7
3.5
59.6
18.7
19.2
52.1
25.0
3.8
3.5
61.0
11.0
18.0
56.1
27.0
4.0
3.6
63.3
8.9
17.1
64.2
30.8
4.0
3.6
64.4
10.3
16.6
58.7
27.1
3.8
3.4
63.4
12.3
14.7
66.1
25.7
3.8
3.3
63.1
11.6
14.3
68.7
28.6
3.8
3.4
62.3
10.8
13.5
71.8
1.92
0.91
2010
139.1
6.8
139.1
9.7
148.0
5.0
64.3
1.03
0.38
2011
146.0
5.0
146.3
23.9
145.6
10.0
48.7
0.79
0.33
2012
157.3
7.8
4.3
157.4
4.3
32.0
34.0
21.0
13.0
40.6
1.9
0.79
0.33
2013
165.4
5.1
4.1
165.4
4.1
40.3
25.8
16.7
20.0
49.6
3.0
0.83
0.36
2014
170.8
3.3
3.9
170.8
3.9
46.8
16.3
14.3
29.0
61.7
4.3
0.85
0.36
2015
186.5
9.2
3.6
186.5
3.6
53.5
14.2
12.5
35
47.9
5.2
0.80
0.40
2016
253.8
36.1
2.6
253.8
2.6
55.7
4.1
12.1
36.0
64.7
5.4
0.80
0.40
2017E
280.3
10.4
2.4
280.3
2.4
68.6
23.3
9.8
36.0
52.5
5.4
0.80
0.40
2018E
315.7
12.6
2.1
315.7
2.1
85.4
24.4
7.9
42.7
50.0
6.4
26 April 2016
9

Indiabulls Housing Finance
Corporate profile
Company description
Indiabulls Housing Finance (IHFL) is the fourth
largest housing finance company in India with
AUM of INR522b. It was established as a wholly-
owned subsidiary of Indiabulls Financial Services
(IBFSL). In early 2013, keeping with IHFL’s long-
term commitment to the housing finance business,
the company was reversed-merged into its housing
finance subsidiary IHFL. IHFL offers home loans to
target client base of middle and upper-middle
income individuals and small and medium-sized
enterprises, or SMEs. It has presence across 200+
locations across India.
Exhibit 11: Shareholding pattern (%)
Dec-15
Promoter
DII
FII
Others
24.2
2.3
57.9
15.6
Sep-15
23.6
1.5
44.7
30.1
Dec-14
27.8
3.2
45.8
23.2
Exhibit 10: Sensex rebased
Exhibit 12: Top holders
Holder Name
Europacific Growth Fund
Copthall Mauritius Investment Ltd
Cinnamon Capital Ltd
Rajiv Rattan
Merrill Lynch Capital Markets Espana S A S V
%
Holding
6.3
4.9
3.5
3.5
3.1
Note: FII Includes depository receipts
Exhibit 13: Top management
Name
Sameer Gehlaut
Gagan Banga
Ashwini Kumar
Mukesh Garg
Pinank Shah
Ramnath Shenoy
Designation
Chairman
Vice Chairman and MD
Deputy Managing Director
Chief Financial Officer
Head Treasury
Executive Vice President, IR
Exhibit 14: Directors
Name
Sameer Gehlaut
Gagan Banga
Rajiv Rattan
Saurabh Kumar Mittal
Karan Singh Khera*
Ram Kumar Sheokand*
Prem Prakash Mirdha*
*Independent
Name
Shamsher Singh Ahlawat*
Aisharya Katoch
Joginder Singh Kataria
Ajit Kumar Mittal
Ashwini Omprakash Kumar
Kamalesh Shailesh Chandra Chakrabarty*
Exhibit 15: Auditors
Name
Deloitte Haskins & Sells LLP
N D Kapur & Co
Type
Statutory
Internal
Exhibit 16: MOSL forecast v/s consensus
EPS
(INR)
FY16
FY17
FY18
MOSL
forecast
55.7
68.6
85.4
Consensus
forecast
58.7
69.6
81.9
Variation
(%)
-5.2
-1.5
4.2
26 April 2016
10

Indiabulls Housing Finance
NOTES
26 April 2016
11

Disclosures
This document has been prepared by Motilal Oswal Securities Limited (hereinafter referred to as Most) to provide information about the company (ies) and/sector(s), if any, covered in the report and may be distributed by it and/or its
Indiabulls Housing Finance
affiliated company(ies). This report is for personal information of the selected recipient/s and does not construe to be any investment, legal or taxation advice to you. This research report does not constitute an offer, invitation or
inducement to invest in securities or other investments and Motilal Oswal Securities Limited (hereinafter referred as MOSt) is not soliciting any action based upon it. This report is not for public distribution and has been furnished to
you solely for your general information and should not be reproduced or redistributed to any other person in any form. This report does not constitute a personal recommendation or take into account the particular investment
objectives, financial situations, or needs of individual clients. Before acting on any advice or recommendation in this material, investors should consider whether it is suitable for their particular circumstances and, if necessary, seek
professional advice. The price and value of the investments referred to in this material and the income from them may go down as well as up, and investors may realize losses on any investments. Past performance is not a guide for
future performance, future returns are not guaranteed and a loss of original capital may occur.
MOSt and its affiliates are a full-service, integrated investment banking, investment management, brokerage and financing group. We and our affiliates have investment banking and other business relationships with a some
companies covered by our Research Department. Our research professionals may provide input into our investment banking and other business selection processes. Investors should assume that MOSt and/or its affiliates are
seeking or will seek investment banking or other business from the company or companies that are the subject of this material and that the research professionals who were involved in preparing this material may educate investors
on investments in such business . The research professionals responsible for the preparation of this document may interact with trading desk personnel, sales personnel and other parties for the purpose of gathering, applying and
interpreting information. Our research professionals are paid on twin parameters of performance & profitability of MOSt.
MOSt generally prohibits its analysts, persons reporting to analysts, and members of their households from maintaining a financial interest in the securities or derivatives of any companies that the analysts cover. Additionally, MOSt
generally prohibits its analysts and persons reporting to analysts from serving as an officer, director, or advisory board member of any companies that the analysts cover. Our salespeople, traders, and other professionals or affiliates
may provide oral or written market commentary or trading strategies to our clients that reflect opinions that are contrary to the opinions expressed herein, and our proprietary trading and investing businesses may make investment
decisions that are inconsistent with the recommendations expressed herein. In reviewing these materials, you should be aware that any or all of the foregoing among other things, may give rise to real or potential conflicts of interest.
MOSt and its affiliated company(ies), their directors and employees and their relatives may; (a) from time to time, have a long or short position in, act as principal in, and buy or sell the securities or derivatives thereof of companies
mentioned herein. (b) be engaged in any other transaction involving such securities and earn brokerage or other compensation or act as a market maker in the financial instruments of the company(ies) discussed herein or act as an
advisor or lender/borrower to such company(ies) or may have any other potential conflict of interests with respect to any recommendation and other related information and opinions.; however the same shall have no bearing
whatsoever on the specific recommendations made by the analyst(s), as the recommendations made by the analyst(s) are completely independent of the views of the affiliates of MOSt even though there might exist an inherent
conflict of interest in some of the stocks mentioned in the research report Reports based on technical and derivative analysis center on studying charts company's price movement, outstanding positions and trading volume, as
opposed to focusing on a company's fundamentals and, as such, may not match with a report on a company's fundamental analysis. In addition MOST has different business segments / Divisions with independent research
separated by Chinese walls catering to different set of customers having various objectives, risk profiles, investment horizon, etc, and therefore may at times have different contrary views on stocks sectors and markets.
Unauthorized disclosure, use, dissemination or copying (either whole or partial) of this information, is prohibited. The person accessing this information specifically agrees to exempt MOSt or any of its affiliates or employees from,
any and all responsibility/liability arising from such misuse and agrees not to hold MOSt or any of its affiliates or employees responsible for any such misuse and further agrees to hold MOSt or any of its affiliates or employees free
and harmless from all losses, costs, damages, expenses that may be suffered by the person accessing this information due to any errors and delays. The information contained herein is based on publicly available data or other
sources believed to be reliable. Any statements contained in this report attributed to a third party represent MOSt’s interpretation of the data, information and/or opinions provided by that third party either publicly or through a
subscription service, and such use and interpretation have not been reviewed by the third party. This Report is not intended to be a complete statement or summary of the securities, markets or developments referred to in the
document. While we would endeavor to update the information herein on reasonable basis, MOSt and/or its affiliates are under no obligation to update the information. Also there may be regulatory, compliance, or other reasons that
may prevent MOSt and/or its affiliates from doing so. MOSt or any of its affiliates or employees shall not be in any way responsible and liable for any loss or damage that may arise to any person from any inadvertent error in the
information contained in this report. MOSt or any of its affiliates or employees do not provide, at any time, any express or implied warranty of any kind, regarding any matter pertaining to this report, including without limitation the
implied warranties of merchantability, fitness for a particular purpose, and non-infringement. The recipients of this report should rely on their own investigations.
This report is intended for distribution to institutional investors. Recipients who are not institutional investors should seek advice of their independent financial advisor prior to taking any investment decision based on this report or for
any necessary explanation of its contents.
Most and it’s associates may have managed or co-managed public offering of securities, may have received compensation for investment banking or merchant banking or brokerage services, may have received any compensation
for products or services other than investment banking or merchant banking or brokerage services from the subject company in the past 12 months.
Most and it’s associates have not received any compensation or other benefits from the subject company or third party in connection with the research report.
Subject Company may have been a client of Most or its associates during twelve months preceding the date of distribution of the research report
MOSt and/or its affiliates and/or employees may have interests/positions, financial or otherwise of over 1 % at the end of the month immediately preceding the date of publication of the research in the securities mentioned in this
report. To enhance transparency, MOSt has incorporated a Disclosure of Interest Statement in this document. This should, however, not be treated as endorsement of the views expressed in the report.
Motilal Oswal Securities Limited is registered as a Research Analyst under SEBI (Research Analyst) Regulations, 2014. SEBI Reg. No. INH000000412
Pending Regulatory inspections against Motilal Oswal Securities Limited:
SEBI pursuant to a complaint from client Shri C.R. Mohanraj alleging unauthorized trading, issued a letter dated 29th April 2014 to MOSL notifying appointment of an Adjudicating Officer as per SEBI regulations to hold inquiry and
adjudge violation of SEBI Regulations; MOSL replied to the Show Cause Notice whereby SEBI granted us an opportunity of Inspection of Documents. Since all the documents requested by us were not covered we have requested to
SEBI vide our letter dated June 23, 2015 to provide pending list of documents for inspection.
List of associate companies of Motilal Oswal Securities Limited -Click
here to access detailed report
Analyst Certification
The views expressed in this research report accurately reflect the personal views of the analyst(s) about the subject securities or issues, and no part of the compensation of the research analyst(s) was, is, or will be directly or
indirectly related to the specific recommendations and views expressed by research analyst(s) in this report. The research analysts, strategists, or research associates principally responsible for preparation of MOSt research receive
compensation based upon various factors, including quality of research, investor client feedback, stock picking, competitive factors and firm revenues
Disclosure of Interest Statement
Analyst ownership of the stock
Served as an officer, director or employee
INDIABULLS HOUSING FINANCE
No
No
A graph of daily closing prices of securities is available at www.nseindia.com and http://economictimes.indiatimes.com/markets/stocks/stock-quotes
Regional Disclosures (outside India)
This report is not directed or intended for distribution to or use by any person or entity resident in a state, country or any jurisdiction, where such distribution, publication, availability or use would be contrary to law, regulation or which
would subject MOSt & its group companies to registration or licensing requirements within such jurisdictions.
For Hong Kong:
This report is distributed in Hong Kong by Motilal Oswal capital Markets (Hong Kong) Private Limited, a licensed corporation (CE AYY-301) licensed and regulated by the Hong Kong Securities and Futures
Commission (SFC) pursuant to the Securities and Futures Ordinance (Chapter 571 of the Laws of Hong Kong) “SFO”. As per SEBI (Research Analyst Regulations) 2014 Motilal Oswal Securities (SEBI Reg No. INH000000412) has
an agreement with Motilal Oswal capital Markets (Hong Kong) Private Limited for distribution of research report in Kong Kong. This report is intended for distribution only to “Professional Investors” as defined in Part I of Schedule 1 to
SFO. Any investment or investment activity to which this document relates is only available to professional investor and will be engaged only with professional investors.” Nothing here is an offer or solicitation of these securities,
products and services in any jurisdiction where their offer or sale is not qualified or exempt from registration. The Indian Analyst(s) who compile this report is/are not located in Hong Kong & are not conducting Research Analysis in
Hong Kong.
Motilal Oswal Securities Limited (MOSL) is not a registered broker - dealer under the U.S. Securities Exchange Act of 1934, as amended (the"1934 act") and under applicable state laws in the United States. In addition MOSL is not a
registered investment adviser under the U.S. Investment Advisers Act of 1940, as amended (the "Advisers Act" and together with the 1934 Act, the "Acts), and under applicable state laws in the United States. Accordingly, in the
absence of specific exemption under the Acts, any brokerage and investment services provided by MOSL, including the products and services described herein are not available to or intended for U.S. persons.
This report is intended for distribution only to "Major Institutional Investors" as defined by Rule 15a-6(b)(4) of the Exchange Act and interpretations thereof by SEC (henceforth referred to as "major institutional investors"). This
document must not be acted on or relied on by persons who are not major institutional investors. Any investment or investment activity to which this document relates is only available to major institutional investors and will be
engaged in only with major institutional investors. In reliance on the exemption from registration provided by Rule 15a-6 of the U.S. Securities Exchange Act of 1934, as amended (the "Exchange Act") and interpretations thereof by
the U.S. Securities and Exchange Commission ("SEC") in order to conduct business with Institutional Investors based in the U.S., MOSL has entered into a chaperoning agreement with a U.S. registered broker-dealer, Motilal Oswal
Securities International Private Limited. ("MOSIPL"). Any business interaction pursuant to this report will have to be executed within the provisions of this chaperoning agreement.
The Research Analysts contributing to the report may not be registered /qualified as research analyst with FINRA. Such research analyst may not be associated persons of the U.S. registered broker-dealer, MOSIPL, and therefore,
may not be subject to NASD rule 2711 and NYSE Rule 472 restrictions on communication with a subject company, public appearances and trading securities held by a research analyst account.
For Singapore
Motilal Oswal Capital Markets Singapore Pte Limited is acting as an exempt financial advisor under section 23(1)(f) of the Financial Advisers Act(FAA) read with regulation 17(1)(d) of the Financial Advisors Regulations and is a
subsidiary of Motilal Oswal Securities Limited in India. This research is distributed in Singapore by Motilal Oswal Capital Markets Singapore Pte Limited and it is only directed in Singapore to accredited investors, as defined in the
Financial Advisers Regulations and the Securities and Futures Act (Chapter 289), as amended from time to time.
In respect of any matter arising from or in connection with the research you could contact the following representatives of Motilal Oswal Capital Markets Singapore Pte Limited:
Varun Kumar
Varun.kumar@motilaloswal.com
Contact : (+65) 68189232
Office Address:21 (Suite 31),16 Collyer Quay,Singapore 04931
Kadambari Balachandran
kadambari.balachandran@motilaloswal.com
(+65) 68189233 / 65249115
For U.S
26 April 2016
Motilal Oswal Tower, Level 9, Sayani Road, Prabhadevi, Mumbai 400 025
Phone: +91 22 3982 5500 E-mail: reports@motilaloswal.com
Motilal Oswal Securities Ltd
12