26 April 2016
1QCY16 Results Update | Sector: Capital Goods
ABB
BSE SENSEX
26,007
Bloomberg
Equity Shares (m)
M.Cap.(INRb)/(USDb)
52-Week Range (INR)
1, 6, 12 Rel. Per (%)
Avg Val, (INR m)
Free float (%)
S&P CNX
7,963
ABB IN
211.9
274.0 / 4.1
1,444/963
5/5/2
89
25.0
CMP: INR1,293 TP: INR1,220 (-6%)
Neutral
Financials & Valuations (INR b)
Y/E Dec
2015 2016E 2017E
Net Sales
81.4
87.0 100.7
EBITDA
7.5
8.8
11.1
PAT
3.3
4.2
5.5
EPS (INR)
15.8
19.6
26.1
Gr. (%)
22.8
24.6
32.8
BV/Sh (INR)
142.0 161.2 187.3
RoE (%)
11.1
12.2
13.9
RoCE (%)
10.6
12.8
14.5
P/E (x)
82.1
65.9
49.6
P/BV (x)
9.1
8.0
6.9
Estimate change
TP change
Rating change
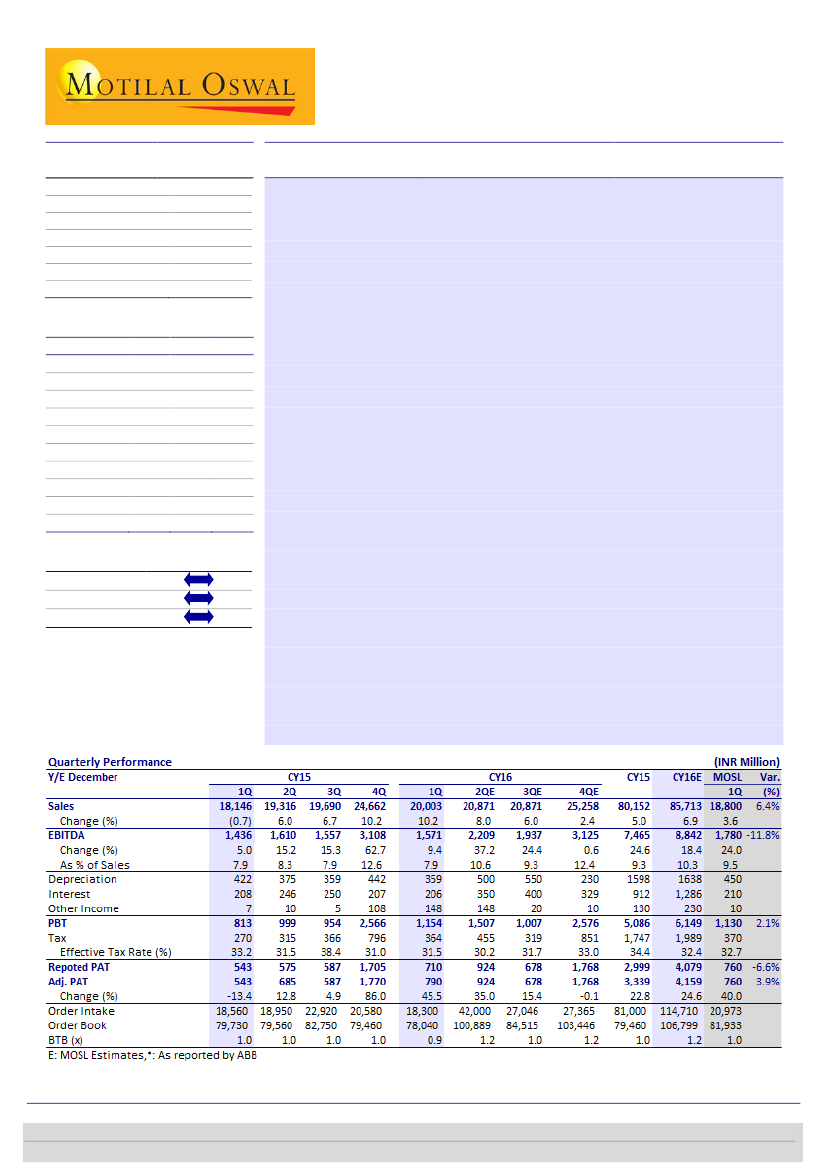
Execution remains strong; margin below estimate
Operational performance a mixed bag:
ABB’s 1QCY16 revenue at INR20b, up
10% YoY, was 6.4% higher than our estimate, while the adjusted EBIDTA
margin at 7.9%, flat YoY, was below our estimate of 9.5%. Key segments which
witnessed a strong performance were Discrete Automation with revenue at
INR7.7b (+32% YoY) and Electrification Products (+22.7% YoY). The decline in
Power Grid revenue to INR7.3b (-7.0%) was mainly a timing related issue, as
sales continued to be as per scheduled delivery. Adjusted PAT at INR790m was
marginally ahead of our estimate of INR760m on back of higher Other Income.
There was a forex loss of INR80m during the quarter.
Gross margin close to all time high:
Gross margin at 35.8% (+150bp) reflected
various initiatives taken over the last 3-4 years in terms of increased
localization, rationalization of supply chain, improving efficiency, better project
management capabilities, lower raw material prices and benefits of the EUR
depreciation. CY15 gross margin stood at 35% and management expects these
levels to sustain, going forward.
Order inflow stagnates due to weak finalization of orders:
Order inflow was
flat at INR18.3b (-1% YoY) on account of weak finalization of large orders.
Segments like Renewable, T&D, and Railways supported order inflow, though
ordering in traditional sectors such as Cement, Steel and Oil & Gas remained
muted due to underutilization of existing capacities.
Valuation and view:
Management is still cautiously optimistic on the demand
scenario and remains focused on margin expansion through improvement in
operational efficiencies and localization efforts. While segments such as
Transmission, Renewable and Transportation are witnessing traction, an
improvement in traditional sectors of Steel, Cement and Oil & Gas remains
elusive. Valuations stand at 65.9x/49.6x CY16/17E EPS of INR19.6/26.1.
Maintain
Neutral,
with a price target of INR1,220 (40x CY18 EPS of INR30.5).
Ankur Sharma
(Ankur.VSharma@MotilalOswal.com); +91 22 3982 5449
Amit Shah
(Amit.Shah@MotilalOswal.com); +91 22 3029 5126
Investors are advised to refer through important disclosures made at the last page of the Research Report.
Motilal Oswal research is available on www.motilaloswal.com/Institutional-Equities, Bloomberg, Thomson Reuters, Factset and S&P Capital.

ABB
Performance proves to be a mixed bag
ABB’s 1QCY16 revenue at INR20b, up 10% YoY, was 6.4% higher than our
estimate, while the adjusted EBIDTA margin at 7.9%, flat YoY, was below our
estimate of 9.5%. Key segments which witnessed a strong performance were
Discrete Automation with revenue at INR7.7b (+32% YoY) and Electrification
Products (+22.7% YoY). The decline in Power Grid revenue to INR7.3b (-7.0%)
was mainly a timing related issue, as sales continued to be as per scheduled
delivery, while the decline in Process Automation revenue to INR2.6b (-9.4%
YoY) was primarily on account of volume decline. Adjusted PAT at INR790m was
marginally ahead of our estimate of INR760m. There was a forex loss of INR80m
during the quarter.
Gross margin at 35.8% (+150bp) reflected various initiatives taken over the last
3-4 years in terms of increased localization, rationalization of supply chain,
improving efficiency, better project management capabilities, lower raw
material prices and benefits of the EUR depreciation. CY15 gross margin stood at
35% and management expects these levels to sustain.
EBIDTA margin remained flat at 7.9% YoY due to increase of 26% YoY in Other
expenses to INR3.5b on account of multiple factors like a) Higher warranty
provisioning for new product introductions b) Investment incurred for global
shared services center and c) Forex loss of INR80m incurred in the quarter.
Order intake stood at INR18.3b (-1% YoY), driven by non-finalization of large
project orders. Key sectors driving orders were Transportation (Rail), Renewable
(primarily solar) and Transmission. The traditional areas of Steel, Cement,
Refining and Power remained lack luster and are unlikely to go in for capacity
expansion until capacity underutilization persists. Order backlog stood at
INR78b, down 2.1% YoY.
Exhibit 2: EBITDA margin flat due to higher Other expenses
Exhibit 1: RM cost decline led by focus on localization efforts
Source: Company, MOSL
26 April 2016
2

ABB
Segmental Analysis: Products exhibit sharp increase in revenue and margin
led by operating leverage; Projects witness a mixed bag
Discrete Automation reported a revenue growth of 32% YoY to INR6.1b,
supported by improved traction in Renewable (~20% of order book for the
segment) and Railways (at 15% of DM revenues). Both these segments,
particularly solar, have witnessed improved demand environment and robust
growth. This has helped offset the decline in sales in the traditional area of
Steel, Cement and Oil &Gas.
Process Automation sales came in at INR2.6b (-9.4% YoY) and margin at 9.4% (-
60bp). The revenue decline was mainly on account of volume de-growth led by
weak demand in the traditional segments of Steel, Cement, Oil & Gas, etc.
Power Grid revenue declined by 7% YoY to INR7.3b, though its EBIT margin
improved by 250bp YoY to 4.7%, driven by execution of higher margin orders
and strict adherence to the company’s policy of cash over sales.
Electrification Products witnessed an improvement of 22.7% YoY in revenue
booking to INR4.5b on account of strong execution of projects in hand.
Exhibit 3: Segmental Analysis (INR m)
1QCY14
Discrete Automation
Revenue
Growth YoY (%)
EBIT
EBIT Margin (%)
Elecrtrification Products
Revenue
Growth YoY (%)
EBIT
EBIT Margin (%)
Process Automation
Revenue
Growth YoY (%)
EBIT
EBIT Margin (%)
Power Grid
Revenue
Growth YoY (%)
EBIT
EBIT Margin (%)
4,353
-1.5
192
4.4
2QCY14
3,955
-3.2
210
5.3
3QCY14
4,923
8.1
322
6.5
4QCY14
5,755
15.7
560
9.7
1QCY15
2QCY15
4,788
21.1
401
8.4
3QCY15
5,064
2.9
443
8.8
4QCY15
1QCY16
4,647
6.7
6,125
6.4
6,137
32.1
390
8.4
476
7.8
556
9.1
1,815
28.4
78
4.3
1,932
23.6
113
5.8
1,726
-0.4
88
7.0
1,901
-7.7
88
4.6
3,695
-2.5
454
12.3
1,920
-0.6
152
7.9
2,110
22.2
227
10.8
4,753
150.1
553
11.6
4,535
22.7
684
15.1
2,891
3.1
206
7.1
3,019
-6.0
282
9.4
3,090
2.7
222
7.2
3,452
-0.2
286
8.3
2,907
0.6
290
10.0
3,123
3.4
276
8.9
2,765
-10.5
252
9.1
4,205
21.8
561
13.3
2,635
-9.4
248
9.4
10,505
811
7.7
10,902
10,785
10,962
10,149
7,291
-1.1
6.0
-25.4
-22.3
-7.0
664
575
940
171
747
853
1,098
344
6.1
5.6
7.2
6.9
7.8
2.2
10.8
4.7
Source: Company, MOSL, Note Q116 onwards, the segments have been reclassified
10,340
13,063
7,836
Order inflow remains flat YoY owing to finalization of few project orders
Order intake fell 1% YoY to INR18b owing to finalization of few large project
orders. The key sectors driving orders were Transportation, Renewable
(primarily solar) and Transmission. The traditional areas of Steel, Cement,
Refining and Power remain lack luster on account of underutilization of
capacity and hence, their ordering will continue to be subdued in the near
term.
3
26 April 2016

ABB
Management has indicated that order pipeline remains robust from sectors like
Transportation (Rail orders for traction motors, converters and transformers),
T&D and Renewable (solar).
Order book at INR78.0b was down 2.1% YoY and down 16% from the peak level
of INR92b reached in 2QCY12 on account of a constrained environment,
especially for industrial capex.
Exhibit 5: B-T-B ~ 0.9x due to constrained environment
Exhibit 4: Order inflows down 1% YoY
Source: Company, MOSL
Key Concall Highlights
Management remained cautious on the pace of industrial capex recovery, given
the continued poor capacity utilization levels, and any pick up depends on
demand improvement.
Positive on sectors such as Railways, Renewable, Urban Mobility, Smart Cities
and Water & Waste Water projects.
Prefers cash over sales and will not push sales to customers in case of possible
issue regarding payment recovery.
Exports contributed 13-15% of revenue and grew in double digits, aided by sales
to African and South East Asian countries.
Renewable to contribute 16-17% of sales, led by strong execution of solar
related orders and growth expected to remain robust.
Gross margin expansion being driven by better operational efficiencies, lower
raw material prices, increased localization, fall in EUR and good execution.
Management expects gross margin to remain in the 35% range.
Localization efforts continue, especially in the areas of drives, motors, switch
gear and instrumentation. Higher localization is also aiding margin
improvement.
26 April 2016
4

ABB
Valuation and view
Over the last 2-3 years, ABB’s raw material costs have declined from ~75% to
the current ~65%, led by its various initiatives. However, the savings are yet to
fully reflect in the reported EBIDTA margin due to poor operating cost
absorption: staff costs have increased from ~7-7.5% to the present 9%, while
SG&A expenses have increased from ~13% to 17% in this period. Hence, we
believe that ABB is very strongly positioned to benefit from the market recovery
in the next cycle.
Localization of manufacturing is an important priority, and the ongoing/recently
commissioned capacity expansions include i) doubling of MCB capacity and will
largely cater to the export market ii) capacity for GIS Transformers and
Distribution Transformers, iii) HT Motors, etc. In Process Automation, ABB is
making efforts to build a service portfolio, which over a period of time will
provide stability to margins.
Management has always maintained that ‘In Country, for Country, by Country’
remains an important strategy and its focus is on developing products that are
suitable for the Indian market.
We expect the EPS to improve from INR15.8 in CY15 to INR19.6 in CY16 (up
24.6% YoY) and further to INR26.1 in CY17 (up 32.8% YoY). At the CMP, ABB
trades at a PER of 65.9x CY16E and 49.6x CY17E. Maintain
Neutral,
with a price
target of INR1,220/sh (40x CY18E EPS of INR30.5).
26 April 2016
5

ABB
Exhibit 6: Operating metrics
Year ended December
Revenues (INR m)
LV Products
Discrete Automation & Motion
Process automation
Power products
Power systems
Gross Segmental Sales
Revenue Growth (% YoY)
LV Products
Discrete Automation & Motion
Process automation
Power products
Power systems
Revenue Growth
EBIT Margins (%)
LV Products
Discrete Automation & Motion
Process automation
Power products
Power systems
Costs, % of Revenues
Material Costs
Contribution Margins, %
Staff Costs
Other Expenses
EBIDTA %
Products (% of Revenues)
Fixed Assets Turn (x)
NWC (Days)
EPS (INR/sh)
% YoY
PER (x)
2010
4,486
15,929
11,886
18,155
18,267
68,722
2011
5,399
17,993
13,219
20,008
23,624
80,243
2012
6,174
17,753
13,566
20,853
22,422
80,767
2013
6,769
18,237
12,480
21,304
23,851
82,640
2014
7,373
18,986
12,450
23,255
21,554
83,617
2015
8,006
20,624
12,503
25,992
18,707
85,832
2016E
7,833
25,007
12,601
28,482
17,850
91,772
2017E
8,692
28,581
13,720
31,810
23,462
106,266
2018E
9,929
32,786
16,288
37,109
24,028
120,140
17.3%
13.2%
-1.8%
-8.9%
6.3%
1.3%
20.4%
13.0%
11.2%
10.2%
29.3%
16.8%
14.4%
-1.3%
2.6%
4.2%
-5.1%
0.7%
9.6%
2.7%
-8.0%
2.2%
6.4%
2.3%
8.9%
4.1%
-0.2%
9.2%
-9.6%
1.2%
8.6%
8.6%
0.4%
11.8%
-13.2%
2.6%
-2.2%
21.2%
0.8%
9.6%
-4.6%
6.9%
11.0%
14.3%
8.9%
11.7%
31.4%
15.8%
14.2%
14.7%
18.7%
16.7%
2.4%
13.1%
0.4%
8.3%
6.9%
4.5%
-0.6%
6.3%
11.5%
2.9%
5.0%
0.0%
6.4%
11.0%
-1.1%
6.6%
2.9%
3.7%
6.9%
5.7%
8.0%
3.9%
5.4%
6.8%
8.0%
7.9%
5.3%
9.1%
8.2%
10.1%
9.1%
6.5%
10.1%
9.2%
10.1%
10.6%
8.0%
10.1%
9.2%
10.1%
11.0%
8.0%
10.1%
9.2%
10.1%
11.0%
8.0%
75.5%
24.5%
7.7%
12.6%
4.2%
54.1%
6.3
46.8
12.2
-38.2%
172.0
72.4%
27.6%
7.9%
13.4%
6.3%
55.4%
6.3
71.2
7.5
65.6%
103.9
71.7%
28.3%
8.2%
13.7%
6.4%
56.0%
5.5
71.8
12.4
-23.6%
136.0
69.9%
30.1%
8.8%
13.6%
7.7%
59.3%
5.5
71.7
9.5
35.0%
100.8
67.8%
32.2%
9.1%
13.8%
9.3%
63.6%
6.2
74.1
12.8
22.8%
82.1
65.1%
34.9%
9.2%
15.4%
10.3%
66.8%
6.5
80.6
15.8
24.6%
65.9
64.4%
35.6%
9.1%
15.3%
11.2%
65.0%
7.6
83.4
19.6
32.8%
49.6
64.5%
35.5%
9.1%
15.1%
11.3%
66.4%
8.9
83.4
26.1
16.9%
42.4
64.9%
35.1%
9.3%
14.5%
11.3%
67.6%
10.6
83.4
30.5
18.2%
35.9
Source: Company, MOSL
26 April 2016
6

ABB
Financials and Valuations
Income Statement
Y/E Dec
Net Sales
Change (%)
EBITDA
EBITDA Margin (%)
Depreciation
EBIT
Interest
Other Income
Extraordinary items
PBT
Tax
Tax Rate (%)
Min. Int. & Assoc. Share
Reported PAT
Adjusted PAT
Change (%)
2011
73,703
15.9
2,325
3.2
796
1,530
307
415
253
1,890
832
44.0
0
1,058
1,593
151.9
2011
424
24,921
25,345
0
-224
25,121
14,619
2,935
11,684
839
507
49,600
9,255
30,825
2,644
6,876
37,509
35,179
2,331
12,091
25,121
2012
75,650
2.6
4,718
6.2
941
3,777
432
-20
-1,263
2,062
688
33.4
0
1,374
2,637
65.6
2012
424
25,557
25,981
3,277
-148
29,109
15,856
3,783
12,073
1,170
525
50,784
9,204
32,644
767
8,169
35,443
32,978
2,465
15,341
29,109
2013
77,218
2.1
4,945
6.4
1,033
3,912
1,011
70
223
3,194
956
29.9
0
2,238
2,015
-23.6
2013
424
26,352
26,776
6,243
-272
32,746
18,627
4,712
13,915
475
173
55,661
9,889
32,357
3,166
10,249
37,477
34,785
2,692
18,184
32,747
2014
77,333
0.1
5,991
7.7
1,128
4,863
1,050
173
-435
3,552
1,267
35.7
0
2,285
2,719
35.0
2014
424
27,696
28,120
3,756
-152
31,723
19,718
5,723
13,995
319
165
53,585
8,938
31,575
2,260
10,812
36,341
32,817
3,524
17,244
31,723
2015
81,403
5.3
7,465
9.2
1,598
5,867
912
130
-340
4,746
1,747
36.8
0
2,999
3,339
22.8
2015
424
29,662
30,086
6,043
-478
35,651
20,267
7,227
13,040
443
164
60,007
9,396
33,909
5,736
10,966
38,003
33,740
4,263
22,004
35,651
2016E
87,003
6.9
8,842
10.2
1,638
7,204
1,286
230
-80
6,069
1,989
32.8
0
4,079
4,159
24.6
2016E
424
33,741
34,165
7,191
-478
40,878
22,177
8,866
13,311
443
167
65,843
10,048
36,262
8,026
11,507
38,885
34,658
4,227
26,957
40,878
2017E
100,668
15.7
11,136
11.1
1,793
9,343
1,306
130
0
8,168
2,643
32.4
0
5,526
5,526
32.8
2017E
424
39,267
39,691
7,191
-478
46,404
23,908
10,659
13,249
443
185
76,842
11,645
42,026
9,835
13,336
44,315
39,416
4,899
32,527
46,404
(INR Million)
2018E
113,749
13.0
12,676
11.1
1,933
10,743
1,326
130
0
9,548
3,089
32.4
0
6,459
6,459
16.9
2018E
424
43,150
43,574
7,191
-478
50,288
25,387
12,591
12,796
443
200
86,980
13,173
47,542
11,179
15,086
50,132
44,590
5,542
36,848
50,288
Balance Sheet
Y/E Dec
Share Capital
Reserves
Net Worth
Debt
Deferred Tax
Total Capital Employed
Gross Fixed Assets
Less: Acc Depreciation
Net Fixed Assets
Capital WIP
Investments
Current Assets
Inventory
Debtors
Cash & Bank
Loans & Adv, Others
Curr Liabs & Provns
Curr. Liabilities
Provisions
Net Current Assets
Total Assets
E: MOSL Estimates
(INR Million)
26 April 2016
7

ABB
Financials and Valuations
Ratios
Y/E Dec
Basic (INR)
EPS
Cash EPS
Book Value
DPS
Payout (incl. Div. Tax.)
Valuation(x)
P/E
Cash P/E
Price / Book Value
EV/Sales
EV/EBITDA
Dividend Yield (%)
Profitability Ratios (%)
RoE
RoCE
Turnover Ratios (%)
Asset Turnover (x)
Debtors (No. of Days)
Inventory (No. of Days)
Creditors (No. of Days)
Leverage Ratios (%)
Net Debt/Equity (x)
2011
2012
12.4
16.9
122.6
3.0
24.1
2013
9.5
14.4
126.4
3.0
31.8
2014
12.8
18.2
132.7
3.7
28.8
100.8
71.2
9.7
3.6
36.6
0.3
2015
15.8
23.3
142.0
3.7
23.5
82.1
55.5
9.1
3.4
36.9
0.3
11.1
10.6
2.3
152
42
94
0.0
2016E
19.6
27.4
161.2
6.6
33.7
65.9
47.3
8.0
3.1
28.4
0.5
12.2
12.8
2.1
152
42
89
0.0
2017E
26.1
34.5
187.3
8.9
34.3
49.6
37.4
6.9
2.7
21.9
0.7
13.9
14.5
2.2
152
42
89
-0.1
2018E
30.5
39.6
205.6
10.5
34.3
42.4
32.6
6.3
2.4
16.6
0.8
14.8
15.1
2.3
153
42
89
-0.1
7.5
11.3
119.6
3.0
39.9
6.4
8.3
2.9
153
46
92
-0.1
10.1
6.3
2.6
158
44
92
0.1
7.5
8.0
2.4
153
47
98
0.1
9.7
9.2
2.4
149
42
94
0.1
Cash Flow Statement
Y/E Dec
Adjusted EBITDA
Non cash opr. exp (inc)
(Inc)/Dec in Wkg. Cap.
Tax Paid
Other operating activities
CF from Op. Activity
(Inc)/Dec in FA & CWIP
Free cash flows
(Pur)/Sale of Invt
Others
CF from Inv. Activity
Inc/(Dec) in Net Worth
Inc / (Dec) in Debt
Interest Paid
Divd Paid (incl Tax) & Others
CF from Fin. Activity
Inc/(Dec) in Cash
Add: Opening Balance
Closing Balance
E: MOSL Estimates
2011
2,325
895
467
-832
0
2,855
-5,081
-2,226
-339
75
-5,345
2
0
0
-739
-737
-3,228
5,871
2,644
2012
4,718
-452
-5,127
-688
0
-1,549
-1,661
-3,210
-18
-1,187
-2,866
0
3,277
0
-739
2,538
-1,877
2,644
767
2013
4,945
-941
-444
-956
0
2,604
-2,180
425
352
-347
-2,175
-253
2,966
0
-744
1,969
2,399
767
3,165
2014
5,991
-877
34
-1,267
0
3,881
-1,053
2,828
8
-315
-1,359
-30
-2,487
0
-911
-3,428
-906
3,165
2,260
2015
7,465
-781
-1,284
-1,747
0
3,653
-766
2,887
1
-665
-1,430
-122
2,287
0
-911
1,254
3,477
2,260
5,736
2016E
8,842
-1,055
-2,663
-1,989
0
3,135
-1,910
1,225
-3
-80
-1,993
1,627
1,148
0
-1,627
1,148
2,290
5,736
8,026
2017E
11,136
-1,175
-3,760
-2,643
0
3,558
-1,731
1,827
-18
0
-1,749
2,203
0
0
-2,203
0
1,809
8,026
9,835
(INR Million)
2018E
12,676
-1,195
-2,978
-3,089
0
5,414
-1,480
3,934
-15
0
-1,495
0
0
0
-2,576
-2,576
1,343
9,835
11,179
26 April 2016
8

ABB
Corporate profile
Company description
Exhibit 1: Sensex rebased
ABB is a worldwide leader in power transmission
and distribution and process automation space. ABB
India is 75% subsidiary of ABB with focus on power
T&D and automation space. Besides power
transmission and distribution, automation products
and process automation are the larger areas of
operations. Power T&D includes products and
project services like switchgears, transformers,
motors, generators, balance of plant activities etc.
Exports contribute ~15% to the total revenues, and
share of service sector stands at ~12%.
Exhibit 2: Shareholding pattern (%)
Dec-15
75.0
12.4
4.4
8.3
Promoter
DII
FII
Others
Sep-15
75.0
12.5
4.6
7.9
Dec-14
75.0
12.2
4.8
8.0
Source: Capitaline
Source: MOSL/Bloomberg
Exhibit 3: Top holders
Holder Name
LIC Of India Profit Plus Balanced Fund
Aberdeen Global Indian Equity Limited
% Holding
8.9
1.8
Note: FII Includes depository receipts
Source: Capitaline
Exhibit 4: Top management
Name
Frank Duggan
Sanjeev Sharma
B Gururaj
Designation
Chairman
Managing Director
Company Secretary
Exhibit 5: Directors
Name
Frank Duggan
Sanjeev Sharma
D E Udwadia*
Name
Renu Sud Karnad*
Nasser Munjee*
Tarak Mehta
Source: Capitaline
*Independent
Exhibit 6: Auditors
Name
Ashwin Solanki & Associates
S R Batliboi & Associates LLP
Type
Cost Auditor
Statutory
Exhibit 7: MOSL forecast v/s consensus
EPS
(INR)
CY16
CY17
CY18
Source: Capitaline
MOSL
forecast
19.6
26.1
30.5
Consensus
forecast
18.7
24.7
30.6
Variation
(%)
4.8
5.5
-0.4
Source: Bloomberg
26 April 2016
9

Disclosures
ABB
This document has been prepared by Motilal Oswal Securities Limited (hereinafter referred to as Most) to provide information about the company (ies) and/sector(s), if any, covered in the report and may be distributed by it and/or its
affiliated company(ies). This report is for personal information of the selected recipient/s and does not construe to be any investment, legal or taxation advice to you. This research report does not constitute an offer, invitation or
inducement to invest in securities or other investments and Motilal Oswal Securities Limited (hereinafter referred as MOSt) is not soliciting any action based upon it. This report is not for public distribution and has been furnished to
you solely for your general information and should not be reproduced or redistributed to any other person in any form. This report does not constitute a personal recommendation or take into account the particular investment
objectives, financial situations, or needs of individual clients. Before acting on any advice or recommendation in this material, investors should consider whether it is suitable for their particular circumstances and, if necessary, seek
professional advice. The price and value of the investments referred to in this material and the income from them may go down as well as up, and investors may realize losses on any investments. Past performance is not a guide for
future performance, future returns are not guaranteed and a loss of original capital may occur.
MOSt and its affiliates are a full-service, integrated investment banking, investment management, brokerage and financing group. We and our affiliates have investment banking and other business relationships with a some
companies covered by our Research Department. Our research professionals may provide input into our investment banking and other business selection processes. Investors should assume that MOSt and/or its affiliates are
seeking or will seek investment banking or other business from the company or companies that are the subject of this material and that the research professionals who were involved in preparing this material may educate investors
on investments in such business . The research professionals responsible for the preparation of this document may interact with trading desk personnel, sales personnel and other parties for the purpose of gathering, applying and
interpreting information. Our research professionals are paid on twin parameters of performance & profitability of MOSt.
MOSt generally prohibits its analysts, persons reporting to analysts, and members of their households from maintaining a financial interest in the securities or derivatives of any companies that the analysts cover. Additionally, MOSt
generally prohibits its analysts and persons reporting to analysts from serving as an officer, director, or advisory board member of any companies that the analysts cover. Our salespeople, traders, and other professionals or affiliates
may provide oral or written market commentary or trading strategies to our clients that reflect opinions that are contrary to the opinions expressed herein, and our proprietary trading and investing businesses may make investment
decisions that are inconsistent with the recommendations expressed herein. In reviewing these materials, you should be aware that any or all of the foregoing among other things, may give rise to real or potential conflicts of interest.
MOSt and its affiliated company(ies), their directors and employees and their relatives may; (a) from time to time, have a long or short position in, act as principal in, and buy or sell the securities or derivatives thereof of companies
mentioned herein. (b) be engaged in any other transaction involving such securities and earn brokerage or other compensation or act as a market maker in the financial instruments of the company(ies) discussed herein or act as an
advisor or lender/borrower to such company(ies) or may have any other potential conflict of interests with respect to any recommendation and other related information and opinions.; however the same shall have no bearing
whatsoever on the specific recommendations made by the analyst(s), as the recommendations made by the analyst(s) are completely independent of the views of the affiliates of MOSt even though there might exist an inherent
conflict of interest in some of the stocks mentioned in the research report Reports based on technical and derivative analysis center on studying charts company's price movement, outstanding positions and trading volume, as
opposed to focusing on a company's fundamentals and, as such, may not match with a report on a company's fundamental analysis. In addition MOST has different business segments / Divisions with independent research
separated by Chinese walls catering to different set of customers having various objectives, risk profiles, investment horizon, etc, and therefore may at times have different contrary views on stocks sectors and markets.
Unauthorized disclosure, use, dissemination or copying (either whole or partial) of this information, is prohibited. The person accessing this information specifically agrees to exempt MOSt or any of its affiliates or employees from,
any and all responsibility/liability arising from such misuse and agrees not to hold MOSt or any of its affiliates or employees responsible for any such misuse and further agrees to hold MOSt or any of its affiliates or employees free
and harmless from all losses, costs, damages, expenses that may be suffered by the person accessing this information due to any errors and delays. The information contained herein is based on publicly available data or other
sources believed to be reliable. Any statements contained in this report attributed to a third party represent MOSt’s interpretation of the data, information and/or opinions provided by that third party either publicly or through a
subscription service, and such use and interpretation have not been reviewed by the third party. This Report is not intended to be a complete statement or summary of the securities, markets or developments referred to in the
document. While we would endeavor to update the information herein on reasonable basis, MOSt and/or its affiliates are under no obligation to update the information. Also there may be regulatory, compliance, or other reasons that
may prevent MOSt and/or its affiliates from doing so. MOSt or any of its affiliates or employees shall not be in any way responsible and liable for any loss or damage that may arise to any person from any inadvertent error in the
information contained in this report. MOSt or any of its affiliates or employees do not provide, at any time, any express or implied warranty of any kind, regarding any matter pertaining to this report, including without limitation the
implied warranties of merchantability, fitness for a particular purpose, and non-infringement. The recipients of this report should rely on their own investigations.
This report is intended for distribution to institutional investors. Recipients who are not institutional investors should seek advice of their independent financial advisor prior to taking any investment decision based on this report or for
any necessary explanation of its contents.
Most and it’s associates may have managed or co-managed public offering of securities, may have received compensation for investment banking or merchant banking or brokerage services, may have received any compensation
for products or services other than investment banking or merchant banking or brokerage services from the subject company in the past 12 months.
Most and it’s associates have not received any compensation or other benefits from the subject company or third party in connection with the research report.
Subject Company may have been a client of Most or its associates during twelve months preceding the date of distribution of the research report
MOSt and/or its affiliates and/or employees may have interests/positions, financial or otherwise of over 1 % at the end of the month immediately preceding the date of publication of the research in the securities mentioned in this
report. To enhance transparency, MOSt has incorporated a Disclosure of Interest Statement in this document. This should, however, not be treated as endorsement of the views expressed in the report.
Motilal Oswal Securities Limited is registered as a Research Analyst under SEBI (Research Analyst) Regulations, 2014. SEBI Reg. No. INH000000412
Pending Regulatory inspections against Motilal Oswal Securities Limited:
SEBI pursuant to a complaint from client Shri C.R. Mohanraj alleging unauthorized trading, issued a letter dated 29th April 2014 to MOSL notifying appointment of an Adjudicating Officer as per SEBI regulations to hold inquiry and
adjudge violation of SEBI Regulations; MOSL replied to the Show Cause Notice whereby SEBI granted us an opportunity of Inspection of Documents. Since all the documents requested by us were not covered we have requested to
SEBI vide our letter dated June 23, 2015 to provide pending list of documents for inspection.
List of associate companies of Motilal Oswal Securities Limited -Click
here to access detailed report
Analyst Certification
The views expressed in this research report accurately reflect the personal views of the analyst(s) about the subject securities or issues, and no part of the compensation of the research analyst(s) was, is, or will be directly or
indirectly related to the specific recommendations and views expressed by research analyst(s) in this report. The research analysts, strategists, or research associates principally responsible for preparation of MOSt research receive
compensation based upon various factors, including quality of research, investor client feedback, stock picking, competitive factors and firm revenues
Disclosure of Interest Statement
Analyst ownership of the stock
Served as an officer, director or employee
ABB INDIA
No
No
A graph of daily closing prices of securities is available at www.nseindia.com and http://economictimes.indiatimes.com/markets/stocks/stock-quotes
Regional Disclosures (outside India)
This report is not directed or intended for distribution to or use by any person or entity resident in a state, country or any jurisdiction, where such distribution, publication, availability or use would be contrary to law, regulation or which
would subject MOSt & its group companies to registration or licensing requirements within such jurisdictions.
For Hong Kong:
This report is distributed in Hong Kong by Motilal Oswal capital Markets (Hong Kong) Private Limited, a licensed corporation (CE AYY-301) licensed and regulated by the Hong Kong Securities and Futures
Commission (SFC) pursuant to the Securities and Futures Ordinance (Chapter 571 of the Laws of Hong Kong) “SFO”. As per SEBI (Research Analyst Regulations) 2014 Motilal Oswal Securities (SEBI Reg No. INH000000412) has
an agreement with Motilal Oswal capital Markets (Hong Kong) Private Limited for distribution of research report in Kong Kong. This report is intended for distribution only to “Professional Investors” as defined in Part I of Schedule 1 to
SFO. Any investment or investment activity to which this document relates is only available to professional investor and will be engaged only with professional investors.” Nothing here is an offer or solicitation of these securities,
products and services in any jurisdiction where their offer or sale is not qualified or exempt from registration. The Indian Analyst(s) who compile this report is/are not located in Hong Kong & are not conducting Research Analysis in
Hong Kong.
Motilal Oswal Securities Limited (MOSL) is not a registered broker - dealer under the U.S. Securities Exchange Act of 1934, as amended (the"1934 act") and under applicable state laws in the United States. In addition MOSL is not a
registered investment adviser under the U.S. Investment Advisers Act of 1940, as amended (the "Advisers Act" and together with the 1934 Act, the "Acts), and under applicable state laws in the United States. Accordingly, in the
absence of specific exemption under the Acts, any brokerage and investment services provided by MOSL, including the products and services described herein are not available to or intended for U.S. persons.
This report is intended for distribution only to "Major Institutional Investors" as defined by Rule 15a-6(b)(4) of the Exchange Act and interpretations thereof by SEC (henceforth referred to as "major institutional investors"). This
document must not be acted on or relied on by persons who are not major institutional investors. Any investment or investment activity to which this document relates is only available to major institutional investors and will be
engaged in only with major institutional investors. In reliance on the exemption from registration provided by Rule 15a-6 of the U.S. Securities Exchange Act of 1934, as amended (the "Exchange Act") and interpretations thereof by
the U.S. Securities and Exchange Commission ("SEC") in order to conduct business with Institutional Investors based in the U.S., MOSL has entered into a chaperoning agreement with a U.S. registered broker-dealer, Motilal Oswal
Securities International Private Limited. ("MOSIPL"). Any business interaction pursuant to this report will have to be executed within the provisions of this chaperoning agreement.
The Research Analysts contributing to the report may not be registered /qualified as research analyst with FINRA. Such research analyst may not be associated persons of the U.S. registered broker-dealer, MOSIPL, and therefore,
may not be subject to NASD rule 2711 and NYSE Rule 472 restrictions on communication with a subject company, public appearances and trading securities held by a research analyst account.
For Singapore
Motilal Oswal Capital Markets Singapore Pte Limited is acting as an exempt financial advisor under section 23(1)(f) of the Financial Advisers Act(FAA) read with regulation 17(1)(d) of the Financial Advisors Regulations and is a
subsidiary of Motilal Oswal Securities Limited in India. This research is distributed in Singapore by Motilal Oswal Capital Markets Singapore Pte Limited and it is only directed in Singapore to accredited investors, as defined in the
Financial Advisers Regulations and the Securities and Futures Act (Chapter 289), as amended from time to time.
In respect of any matter arising from or in connection with the research you could contact the following representatives of Motilal Oswal Capital Markets Singapore Pte Limited:
Varun Kumar
Varun.kumar@motilaloswal.com
Contact : (+65) 68189232
Office Address:21 (Suite 31),16 Collyer Quay,Singapore 04931
Kadambari Balachandran
kadambari.balachandran@motilaloswal.com
(+65) 68189233 / 65249115
For U.S
26 April 2016
Motilal Oswal Tower, Level 9, Sayani Road, Prabhadevi, Mumbai 400 025
Phone: +91 22 3982 5500 E-mail: reports@motilaloswal.com
Motilal Oswal Securities Ltd
10