Gateway Distriparks
BSE SENSEX
25,603
Bloomberg
Equity Shares (m)
M.Cap.(INRb)/(USDb)
52-Week Range (INR)
1, 6, 12 Rel. Per (%)
12M Avg Val (INR M)
Free float (%)
S&P CNX
7,847
GDPL IN
108.7
30.8 / 0.5
400 / 206
1/-11/-15
82
74.8
28 April 2016
Q4FY16 Results Update | Sector: Logistics
CMP: INR284
TP: INR437(+54%)
Buy
Financials & Valuations (INR b)
Y/E Mar
2016 2017E 2018E
Net Sales
10.5
12.1
14.2
EBITDA
2.5
3.0
3.9
PAT
1.2
1.6
2.4
EPS (INR)
11.4
14.3
21.9
Adj. EPS (INR)
8.7
10.8
15.9
Adj EPS Gr. (%)
-31.3
24.7
46.9
BV/Sh (INR)
114.0 120.0 131.8
RoE (%)
10.1
12.2
17.4
RoCE (%)
7.6
10.5
15.0
P/E (x)
24.9
19.8
13.0
P/BV (x)
2.5
2.4
2.2
Estimate change
TP change
Rating change
Results below estimates; macro revival key to volume uptick; Completion of Viramgam
terminal to boost Rail division’s margin
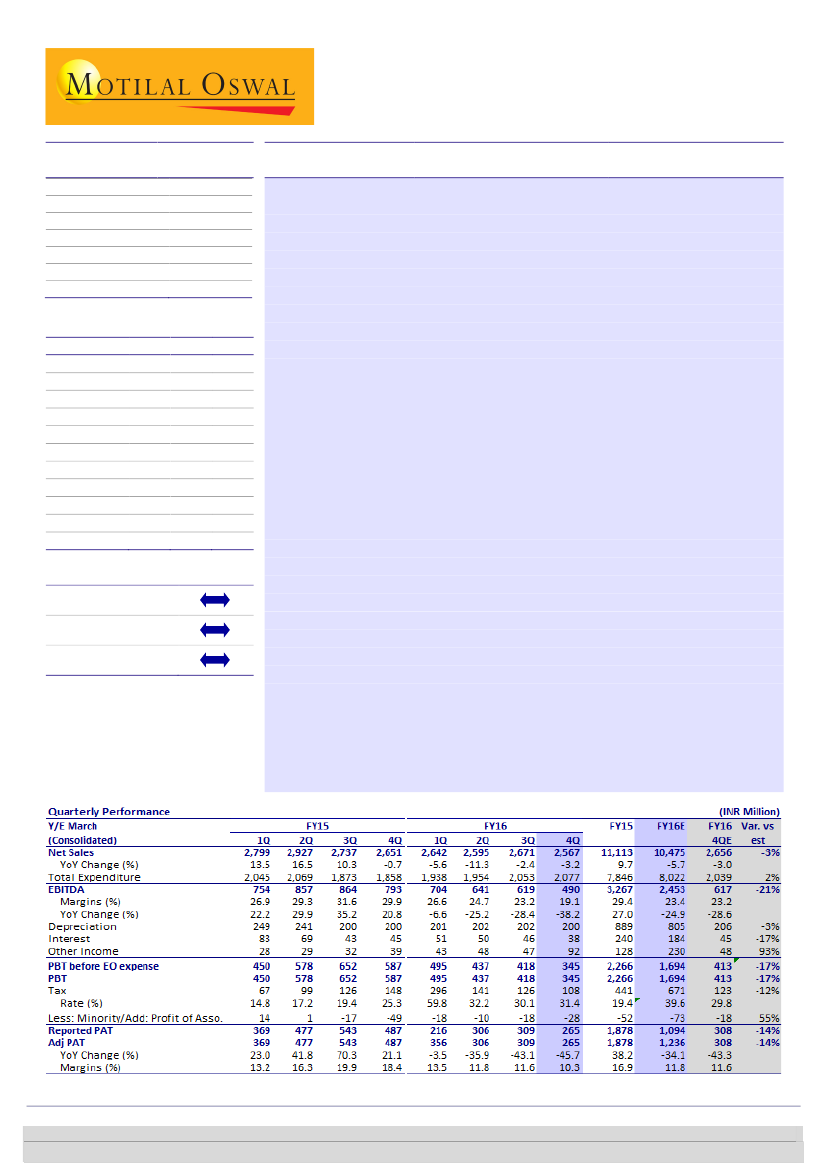
GDPL’s reported adjusted EBITDA came in at INR569m (vs. our estimate of INR617m; -38%
YoY and -21% QoQ) and PAT at INR265m (vs. our estimate of INR308m; -46% YoY and -14%
QoQ). The EBITDA was adjusted for operating income of INR79m, which was reported
under other income. While volume was largely in line, profitability was impacted by lower
realization and one-off expenses. FY16 PBT stood at INR1.7b (-24% YoY), though PAT at
INR1.1b was down 41% YoY due to a higher effective tax rate of ~40% (vs. 19.4% in FY15).
Rail volumes flat QoQ, but profitability impacted by continued EXIM imbalance
Rail division reported an EBITDA of INR350m (est. INR382m; -28% YoY and - 8% QoQ)
Container volumes stood at 50,675 TEU (vs. our est. of 51,210; -15% YoY and -1% QoQ).
Rail realization stood at INR36,318/TEU (+16% YoY and -2% QoQ). The EBITDA/TEU
declined to INR6,901 (vs. our estimate of INR7,450; -15% YoY and -8% QoQ), with the
decline driven by increased EXIM imbalance and lower double stacking in 4QFY16.
The completion of Viramgam terminal (in Gujarat) will increase double stacking and
result in ~5% savings in rail haulage charges, well ahead of the DFC completion.
GDPL is well placed to benefit from an economic recovery as its current ICD capacity
can handle a four-fold increase in volume without any significant capex. We estimate a
25% EBITDA CAGR through FY18, driven by higher volume and margin expansion.
CFS division impacted by a suspension at Mumbai CFS and weak macro environment
Consolidated CFS EBITDA stood at INR219m (est. INR235m; -33% YoY and -11% QoQ).
Consolidated volume stood at 85.4K (vs. our estimate of 85K; -7% YoY and flat QoQ).
Realization came in at INR8,565/TEU (vs. our estimate of INR8,887/TEU; -5% YoY/QoQ),
while the EBITDA/TEU stood at INR2,565 (-29% YoY and -10% QoQ).
Valuation and view
Our FY16-18 volume CAGR assumptions for Rail and CFS divisions stand at ~13%. We
value Gateway Distriparks on a SOTP-based fair value of INR437/share, which includes
INR409/share for its core business on a DCF basis (WACC: 12.2%, TGR: 4%) and
INR28/share for Snowman, post 25% discount.
The key events to watch out for will be (a) EXIM growth, (b) margin improvement led
by completion of the Viramgam terminal, and (c) clarity on the Blackstone stake
purchase by the company.
The stock trades at 17.9x FY18E adjusted EPS of INR15.9 (adjusted for Blackstone’s
stake of 49% in rail). The company’s dividend yield stands at 2-3%. Maintain
Buy.
Harshad Borawake
(HarshadBorawake@MotilalOswal.com); +91 22 3982 5432
Rajat Agarwal
(Rajat.Agarwal@MotilalOswal.com); +91 22 3982 5558
Investors are advised to refer through important disclosures made at the last page of the Research Report.
Motilal Oswal research is available on www.motilaloswal.com/Institutional-Equities, Bloomberg, Thomson Reuters, Factset and S&P Capital.

Gateway Distriparks
Key Takeaways from earnings concall
Update on Gateway rail JV
Management has indicated that it will continue to negotiate buyback of stake
from the Blackstone in its rail business JV.
Rail Division takeaways
4QFY16 operations:
The existing EXIM imbalance was further impacted by
reduction in export volumes driven by weak macro winds from China, Gulf and
Europe. Increased EXIM imbalance has resulted in shipping lines restricting
containers to CFS. Increased imbalance led to trains being taken from Mundra
port to Pipavav port to evacuate imports from the latter port.
Other income in the rail segment increased sequentially due to additional
income from auctions. Other expenses were higher due to a one-off payment of
INR35m to Tata Steel to settle defaults at the Kalamboli terminal.
Macro-economic conditions shouldn’t significantly deviate from the past trend
in 1QFY17 and volume outlook remains subdued for the quarter. Single digit
volume growth expected in FY17.
Ludhiana PFT operations were impacted by exit of two PFT customers resulting
in absence of terminal access charges in Ludhiana ICD. The exit of customers has
however allowed management to transport Ludhiana volumes from Garhi-
Harsarhu (i.e. hub and spoke model) and intensifying double stacking.
Market share in Ludhiana stands at ~45%, while market share in NCR is at 11%.
Viramgam terminal is progressing on schedule (Aug-16) but full volume benefit
would be reflected in 3QFY17.
Gateway Rail currently operates 23 rakes daily across three ports: one train daily
to Mundra and Pipavav, one train every three days to JNPT.
While port congestion surcharge removal shouldn’t incrementally impact
volumes.
Rail business income tax rate will reduce
from FY18 as the company will start
receiving 80-IA benefits for a period of ten years.
CFS business takeaways
4QFY16 operations:
Overall the volumes declined due to weaker macro
environment and due to suspension of Punjab Conware CFS suspension.
Punjab Conware CFS contributed to ~95% of decline. Suspension of the CFS for
two weeks resulted in decline in ground rent which impacted overall
profitability. Management expects full recovery in May-16 itself.
Chandra CFS in Chennai had resumed operations in Jan-16. Operational reasons,
delayed volume recovery and management expects normal operations in May-
16. Volumes decline in Vizag can be attributed to increase in competition.
Vizag CFS lost market share to competitors, thereby losing volumes.
FY17 capex stands at INR500m. Dwell time has remained consistent at 8 days.
28 April 2016
2

Gateway Distriparks
Other Key Highlights
Total debt on the balance sheet stood at INR2.2b (v/s INR1.8b in March 31,
2015).
Cash and equivalents stood at INR1.8b (vs INR1.6b in March-15).
Dividend:
The company declared a second interim dividend of INR3/sh (first
interim dividend was of INR4/sh).
Exhibit 1: Gateway’s rail division PAT down 39% QoQ on a per teu basis
1QFY14 2QFY14 3QFY14 4QFY14 1QFY15 2QFY15 3QFY15 4QFY15 1QFY16 2QFY16 3QFY16 4QFY16 YoY (%) QoQ (%)
Throughput (TEU)
51,624 50,936 51,581 58,176 57,380 67,706 63,952 59,329 54,741 46,631 51,140 50,675
-15
-1
Revenues (INRm)
1,392 1,388 1,362 1,492 1,508 1,713 1,835 1,857 1,766 1,784 1,894 1,840
-1
-3
Realizations (INR/TEU) 26,960 27,250 26,411 25,645 26,288 25,298 28,697 31,297 32,263 38,247 37,034 36,318
16
-2
EBITDA (INRm)
221
227
255
321
323
403
490
484
397
366
382
350
-28
-8
EBITDA margin (%)
16%
16%
19%
21%
21%
24%
27%
26%
22%
20%
20%
19%
-27
-6
EBITDA (INR/TEU)
4,271 4,459 4,942 5,511 5,620 5,949 7,654 8,158 7,249 7,840 7,464 6,901
-15
-8
EBIT (INRm)
121
123
154
225
204
285
370
365
273
239
256
228
-38
-11
EBIT (INR/TEU)
2,348 2,415 2,986 3,869 3,559 4,208 5,786 6,152 4,982 5,123 5,012 4,489
-27
-10
PAT (INRm)
79
94
111
229
193
263
326
250
163
143
163
130
-48
-20
PAT (INR/TEU)
1,530 1,840 2,161 3,933 3,360 3,886 5,091 4,209 2,979 3,064 3,189 2,559
-39
-20
*Rail division EBITDA includes operating income, which is clubbed in other income in income statement
Source: Company, MOSL
Exhibit 2: Rail container volumes stood at 51K; -15% YoY, flat QoQ.
Volumes were impacted YoY by lower port volumes
Rail Througputs ('000 TEUs)
61
52
60
61
52
51
52
58
68
57
64
59
55
51
51
47
Source: Company, MOSL
Exhibit 3: CFS profits stressed due to Punjab Conware suspension, JNPT capacity addition to drive Mumbai CFS volumes
1QFY14 2QFY14 3QFY14 4QFY14 1QFY15 2QFY15 3QFY15 4QFY15 1QFY16 2QFY16 3QFY16 4QFY16 YoY (%) QoQ (%)
Consolidated CFS
Utilization (%)
56
56
54
57
62
66
62
59
60
61
56
55
Throughput (TEU)
84,217 84,207 83,510 88,070 96,552 102,587 96,612 91,387 93,662 95,574 86,604 85,851
Revenues (INR m)
727
778
717
738
795
919
893
820
871
820
782
731
Realizations (INR/TEU) 8,630 9,234 8,589 8,380 8,236 8,957 9,245 8,977 9,297 8,584 9,030 8,517
EBITDA (INR m)
303
341
285
239
314
414
366
328
307
289
246
219
EBITDA margin (%)
42
44
40
32
39
45
41
40
35
35
31
30
EBITDA (INR/TEU)
3,598 4,054 3,413 2,714 3,251 4,034 3,790 3,592 3,281 3,028 2,843 2,551
EBIT (INR m)
240
279
222
176
239
331
286
247
230
214
170
142
EBIT (INR/TEU)
2,847 3,307 2,662 1,997 2,471 3,225 2,961 2,705 2,456 2,238 1,963 1,648
PAT (INR m)
184
208
191
143
163
208
195
185
173
151
128
104
PAT (INR/TEU)
2,186 2,468 2,290 1,621 1,689 2,023 2,017 2,019 1,848 1,581 1,479 1,215
-6
-11
-5
-33
-25
-29
-43
-39
-43
-40
-1
-6
-6
-11
-5
-10
-17
-16
-19
-18
Source: Company, MOSL
28 April 2016
3

Gateway Distriparks
Exhibit 4: CFS volume at 85K were down 6% YoY and flat QoQ
CFS volumes (‘000 TEUs)
92
77
9
17
51
10
17
65
Mumbai
Chennai
90
11
21
57
Vizag
Kochi
88
12
17
55
Total
97
15
22
57
103
17
25
57
97
14
23
56
91
15
18
54
94
15
21
54
96
15
23
54
76
6
16
54
83
7
18
58
91
8
23
59
87
10
19
58
79
9
19
51
83
11
19
53
78
11
19
48
84
11
19
52
84
13
20
51
84
14
18
51
87
14
16
53
85
13
17
52
Source: Company, MOSL
28 April 2016
4

Gateway Distriparks
Valuation and view
GDPL is a direct play on India’s EXIM growth and beneficiary of increasing
containerization which will be boosted by DFCs completion. Management’s
focus on reinvesting in the core business along with upgrading to value-added
services has ensured continual margin improvement.
Blackstone has ~49% stake in Gateway Rail. GDPL management is currently
negotiating with Blackstone for purchase of its stake in rail JV.
Key events to watch out are (a) EXIM growth, (b) margin improvement from
Viramgam terminal, (c) DFCs completion timelines and (d) GST implementation.
Key risks include (a) delay in JNPT expansion, (b) delay in DFCs completion and
(c) competition in CFS and rail segment.
Our FY16-18 volume CAGR assumptions in rail and CFS stands at ~13%.
We value
Gateway Distriparks on SOTP-based fair value of INR437/sh, which includes
INR409/sh for core business on DCF basis (WACC: 12.2%, TGR: 4%) and INR28/sh
for Snowman, post 25% discount.
On FY18E, the stock trades at 17.9x FY18E adj. EPS of INR15.9 (adjusted for 49%
Blackstone stake in rail). Dividend yield stands at 2-3%.
Maintain Buy.
Exhibit 5: Gateway Distriparks - Key Assumptions
FY12
Consolidated CFS
Utilization (%)
Throughput (TEU)
Revenues (INR m)
Realizations (INR/TEU)
EBITDA (INR m)
EBITDA margin (%)
EBITDA (INR/TEU)
EBIT (INR m)
EBIT (INR/TEU)
PAT (INR m)
PAT (INR/TEU)
Rail Division
Throughput (TEU)
Revenues (INR m)
Realizations (INR/TEU)
EBITDA (INR m)
EBITDA margin (%)
EBITDA (INR/TEU)
EBIT (INR m)
EBIT (INR/TEU)
PAT (INR m)
PAT (INR/TEU)
65
334,088
3,102
9,284
1,654
53%
4,949
1,452
4,346
1,065
3,189
180,473
4,496
24,910
717
18%
3,971
336
1,860
222
1,230
FY13
62
342,661
3,052
8,908
1,412
46%
4,120
1,205
3,518
890
2,598
233,566
5,376
23,017
820
15%
3,510
419
1,792
275
1,178
FY14
56
340,004
2,960
8,705
1,168
39%
3,436
917
2,696
726
2,135
212,317
5,671
26,710
1,023
18%
4,819
623
2,935
513
2,416
FY15
61
387,138
3,428
8,854
1,430
42%
3,674
1,103
2,848
750
1,937
248,367
6,913
27,835
1,699
25%
6,840
1,224
4,929
1,031
4,152
FY16
58
364,842
3,204
8,783
1,062
33%
2,911
755
2,070
557
1,526
203,187
7,284
35,965
1,494
21%
7,363
995
4,899
599
2,947
FY17E
70
406,600
3,811
9,372
1,258
33%
3,094
922
2,267
636
1,565
222,300
8,336
37,500
1,734
21%
7,800
1,187
5,338
775
3,488
FY18E
80
472,000
4,470
9,470
1,634
37%
3,461
1,292
2,737
900
1,906
259,200
9,720
37,500
2,281
23%
8,800
1,643
6,338
1,330
5,132
Source: Company, MOSL
28 April 2016
5

Gateway Distriparks
Story in charts
Exhibit 6: Upcoming Dedicated Freight Corridors (DFC) in
railways to significantly multiply freight train capacity
Exhibit 7: DFC features to significantly boost Container Train
operators efficiencies
Source: PTI, PMO, MOSL
Source: DFCCIL, MOSL
Exhibit 8: GDPL’s strategically located ICDs (Inland Container
Depot) to benefit from Western DFC
Exhibit 9: GDPL’s CFS are located at Mumbai, Chennai, Vizag
and Kochi
Source: Company, MOSL
28 April 2016
6

Gateway Distriparks
Story in charts
Exhibit 10: Model 13% Rail volume CAGR thr’ FY18E led by
Faridabad ramp-up and expansion at Garhi and Ludhiana
Rail throughput ('000 TEUs)
234
180
112
131
2,687
302
FY10 FY11 FY12 FY13 FY14 FY15 FY16E FY17E FY18E
Source: Company, MOSL
248
212
203
259
222
Exhibit 11: Expect 24% Rail EBITDA CAGR thr’ FY18E led by
volume growth and likely improvement in profitability
EBITDA (INR/teu)
8,800
7,363 7,800
6,840
2,281
4,819 1,699
3,971
1,494 1,734
3,510
3,333
717
820
1,023
Rail EBITDA (INRm)
438
FY10 FY11 FY12 FY13 FY14 FY15 FY16E FY17E FY18E
Source: Company, MOSL
Exhibit 12: Model consolidated CFS volume CAGR at 14%
thr’ FY18E helped by JNPT port capacity expansion
In '000 TEU
Mumbai
Chennai
Vizag
Kochi
Total
472
19
63
97
Exhibit 13: Expect 24% CFS EBITDA CAGR thr’ FY18E led by
volume growth and improvement
CFS EBITDA (INRm)
4,949
4,120
3,273 3,408
1,654
1,412
3,436 3,674
2,911 3,094
1,258
3,461
1,634
CFS EBITDA (INR/teu)
304
-
24
64
215
333
29-
74
230
334
-
37
78
343
431
76
340
6
51
74
209
387 365 407
14
16
16 56
60
58
80
88
78
223
213
256
219
223
293
995
1,136
1,168
1,422
1,062
FY10 FY11 FY12 FY13 FY14 FY15 FY16E FY17E FY18E
Source: Company, MOSL
FY10 FY11 FY12 FY13 FY14 FY15 FY16E FY17E FY18E
Source: Company, MOSL
Exhibit 14: Gateway market share in container rail business
has more than doubled in the last few years (%)
Exhibit 15: Expect GDPL’s RoE and RoCE to move towards
20% and above (%)
20
RoE
RoCE
15
10
5
FY11
Source: Company, MOSL
FY12
FY13
FY14
FY15
FY16 FY17E FY18E
Source: Company, MOSL
28 April 2016
7

Gateway Distriparks
Financials and Valuations
Income Statement
Y/E Mar
Net Sales
Change (%)
EBITDA
EBITDA Margin (%)
Depreciation
EBIT
Interest
Other Income
Extraordinary items
PBT
Tax
Tax Rate (%)
Min. Int. & Assoc. Share
Reported PAT
Adjusted PAT
Change (%)
2012
8,215
36.3
2,498
30.4
628
1,870
149
144
0
1,865
508
27.3
36
1,320
1,320
36.5
2012
1,083
2,958
6,395
9,837
663
1,270
140
12,509
9,290
310
565
0
3,320
664
1,600
1,056
976
519
458
2,344
12,509
2013
9,541
16.1
2,464
25.8
699
1,766
187
155
0
1,734
373
21.5
93
1,267
1,267
-4.0
2013
1,085
2,958
6,802
10,436
806
2,520
88
14,259
11,194
511
565
1
2,852
964
927
961
863
779
84
1,989
14,259
2014
10,128
6.2
2,587
25.5
801
1,786
294
171
0
1,662
190
11.4
114
1,358
1,358
7.2
2014
1,086
2,958
7,280
10,845
1,257
3,241
40
15,862
12,028
553
760
340
3,481
1,136
1,149
1,196
1,300
833
467
2,181
15,862
2015
11,113
9.7
3,281
29.5
889
2,392
254
128
0
2,266
441
19.4
37
1,878
1,878
38.2
2015
1,087
2,958
8,146
11,324
259
1,820
150
14,420
9,647
317
299
2,253
3,077
1,064
744
1,270
1,173
695
478
1,904
14,420
2016
10,475
-5.7
2,453
23.4
805
1,648
184
230
0
1,694
671
39.6
10
1,096
1,236
-34.2
2016
1,087
2,958
8,346
12,191
259
2,320
150
15,120
10,579
317
452
3,023
2,010
1,029
308
673
1,260
805
455
749
15,120
2017E
12,147
16.0
2,992
24.6
859
2,132
200
232
0
2,164
677
31.3
32
1,555
1,555
25.8
2017E
1,087
2,958
9,004
12,843
259
2,120
150
15,578
10,754
317
567
3,023
2,314
1,193
340
780
1,397
927
470
917
15,578
(INR Million)
2018E
14,190
16.8
3,915
27.6
956
2,959
191
281
0
3,049
740
24.3
55
2,379
2,379
52.9
Balance Sheet
Y/E Mar
Share Capital
Preference Capital
Reserves
Net Worth
Minority Interest
Debt
Deferred Tax
Total Capital Employed
Net Fixed Assets
Goodwill on Consolidation
Capital WIP
Investments
Current Assets
Debtors
Cash & Bank
Loans & Adv, Others
Curr Liabs & Provns
Curr. Liabilities
Provisions
Net Current Assets
Total Assets
(INR Million)
2018E
1,087
2,958
10,290
13,763
259
2,120
150
16,865
10,898
317
567
3,023
3,609
1,393
1,304
912
1,550
1,062
488
2,059
16,865
28 April 2016
8

Gateway Distriparks
Financials and Valuations
Ratios
Y/E Mar
Basic (INR)
EPS
EPS (excl. 49% Rail JV share)
Cash EPS
Book Value
DPS
Payout (incl. Div. Tax.)
Valuation(x)
P/E
P/E (excl. 49% Rail JV share)
Cash P/E
Price / Book Value
Adj. EV/EBITDA
EV/EBITDA
Dividend Yield (%)
Profitability Ratios (%)
RoE
RoCE
Turnover Ratios (%)
Asset Turnover (x)
Working Cap. Turnover (Days)
Leverage Ratios (%)
Net Debt/Equity (x)
2012
12.2
11.2
18.0
96.4
6.0
57.2
2013
11.7
10.4
18.1
100.0
7.0
69.6
2014
12.5
10.1
19.9
104.3
7.0
65.5
2015
17.3
12.6
25.4
112.1
7.0
47.9
16.4
22.5
11.1
2.5
13.0
9.7
2.5
16.0
12.9
0.8
38
0.1
2015
3,281
64
-304
-615
-52
2,375
-1,554
820
-437
-89
-2,080
12
428
-238
-902
-700
-405
1,149
744
2016
11.4
8.7
18.8
114.0
7.0
81.7
24.9
32.7
15.1
2.5
19.1
13.4
2.5
10.1
7.6
0.7
15
0.2
2016
2,453
0
719
-671
0
2,502
-1,890
612
-770
230
-2,430
0
500
-184
-823
-507
-436
744
308
2017E
14.3
10.8
22.2
120.0
7.0
57.7
19.8
26.2
12.8
2.4
15.2
10.9
2.5
12.2
10.5
0.8
17
0.2
2017E
2,992
0
-135
-677
0
2,180
-1,150
1,030
0
232
-918
0
-200
-200
-830
-1,230
32
308
340
2018E
21.9
15.9
30.7
131.8
8.5
45.9
13.0
17.9
9.2
2.2
11.3
8.1
3.0
17.4
15.0
0.8
19
0.1
2.1
13.0
11.6
0.6
33
0.0
2012
2,498
23
-84
-436
71
2,073
-1,116
957
147
60
-909
28
-79
-135
-754
-940
223
1,377
1,600
2.5
11.9
10.7
0.6
41
0.2
2013
2,464
14
-264
-285
3
1,933
-2,383
-450
0
-77
-2,460
22
1,240
-148
-1,260
-146
-673
1,600
927
2.5
12.3
10.8
0.6
37
0.3
2014
2,587
56
-133
-405
-7
2,098
-1,964
134
-340
519
-1,785
10
675
-269
-508
-92
222
927
1,149
Cash Flow Statement
Y/E Mar
Adjusted EBITDA
Non cash opr. exp (inc)
(Inc)/Dec in Wkg. Cap.
Tax Paid
Other operating activities
CF from Op. Activity
(Inc)/Dec in FA & CWIP
Free cash flows
(Pur)/Sale of Invt
Others
CF from Inv. Activity
Inc/(Dec) in Net Worth
Inc / (Dec) in Debt
Interest Paid
Divd Paid (incl Tax) & Others
CF from Fin. Activity
Inc/(Dec) in Cash
Add: Opening Balance
Closing Balance
(INR Million)
2018E
3,915
0
-178
-740
0
2,996
-1,100
1,896
0
281
-819
0
0
-191
-1,023
-1,214
964
340
1,304
28 April 2016
9

Gateway Distriparks
Corporate profile
Company description
Exhibit 1: Sensex rebased
Incorporated in 1994, GDPL is the logistics facilitator
with presence in three synergistic verticals – Container
Freight Stations (CFS), Inland Container Depots (ICD)
with rail movement of containers to major ports, and
cold chain storage logistics.
GDPL operates five CFS at Mumbai, Chennai, Vizag and
Kochi. Its rail subsidiary Gateway Rail operates rail
linked ICDs located at Gurgaon, Ludhiana, Mumbai and
Faridabad.
Source: MOSL/Bloomberg
Exhibit 2: Shareholding pattern (%)
Promoter
DII
FII
Others
Dec-15
25.2
27.6
36.9
10.3
Sep-15
32.9
25.4
31.4
10.4
Dec-14
32.9
25.7
29.5
12.0
Exhibit 3: Top holders
Holder Name
ICICI Prudential Value Discovery F
Franklin Templeton Mutual Fund
Franklin India Prima
Amansa Holdings Pvt Ltd
L & T Mutual Fund Trustee Ltd -
Morgan Stanley Investment Manag
% Holding
6.2
4.6
4.2
3.5
3.3
Source: Capitaline
A/c
Note: FII Includes depository receipts
Source: Capitaline
Exhibit 4: Top management
Name
Prem Kishan Gupta
R Kumar
Designation
Chairman
&
Managing
Director
Company Secretary
Exhibit 5: Directors
Name
Arun Agarwal
Ishaan Gupta
Saroosh Dinshaw
Bhaskar Reddy
Name
Chitra Gouri Lal
M P Pinto
Shabbir Hassanbhai
Mamta Gupta
Source: Capitaline
*Independent
Exhibit 6: Auditors
Name
Price Waterhouse
Varma & Varma
Type
Statutory
Internal
Exhibit 7: MOSL forecast v/s consensus
EPS
(INR)
FY17
FY18
MOSL
forecast
14.3
21.9
Consensus
forecast
13.5
18.4
Variation
(%)
5.7
18.9
Source: Bloomberg
Source: Capitaline
28 April 2016
10

Gateway Distriparks
NOTES
28 April 2016
11

Disclosures
This document has been prepared by Motilal Oswal Securities Limited (hereinafter referred to as Most) to provide information about the company (ies) and/sector(s), if any, covered in the report and may be distributed by it and/or its
Gateway Distriparks
affiliated company(ies). This report is for personal information of the selected recipient/s and does not construe to be any investment, legal or taxation advice to you. This research report does not constitute an offer, invitation or
inducement to invest in securities or other investments and Motilal Oswal Securities Limited (hereinafter referred as MOSt) is not soliciting any action based upon it. This report is not for public distribution and has been furnished to
you solely for your general information and should not be reproduced or redistributed to any other person in any form. This report does not constitute a personal recommendation or take into account the particular investment
objectives, financial situations, or needs of individual clients. Before acting on any advice or recommendation in this material, investors should consider whether it is suitable for their particular circumstances and, if necessary, seek
professional advice. The price and value of the investments referred to in this material and the income from them may go down as well as up, and investors may realize losses on any investments. Past performance is not a guide for
future performance, future returns are not guaranteed and a loss of original capital may occur.
MOSt and its affiliates are a full-service, integrated investment banking, investment management, brokerage and financing group. We and our affiliates have investment banking and other business relationships with a some
companies covered by our Research Department. Our research professionals may provide input into our investment banking and other business selection processes. Investors should assume that MOSt and/or its affiliates are
seeking or will seek investment banking or other business from the company or companies that are the subject of this material and that the research professionals who were involved in preparing this material may educate investors
on investments in such business . The research professionals responsible for the preparation of this document may interact with trading desk personnel, sales personnel and other parties for the purpose of gathering, applying and
interpreting information. Our research professionals are paid on twin parameters of performance & profitability of MOSt.
MOSt generally prohibits its analysts, persons reporting to analysts, and members of their households from maintaining a financial interest in the securities or derivatives of any companies that the analysts cover. Additionally, MOSt
generally prohibits its analysts and persons reporting to analysts from serving as an officer, director, or advisory board member of any companies that the analysts cover. Our salespeople, traders, and other professionals or affiliates
may provide oral or written market commentary or trading strategies to our clients that reflect opinions that are contrary to the opinions expressed herein, and our proprietary trading and investing businesses may make investment
decisions that are inconsistent with the recommendations expressed herein. In reviewing these materials, you should be aware that any or all of the foregoing among other things, may give rise to real or potential conflicts of interest.
MOSt and its affiliated company(ies), their directors and employees and their relatives may; (a) from time to time, have a long or short position in, act as principal in, and buy or sell the securities or derivatives thereof of companies
mentioned herein. (b) be engaged in any other transaction involving such securities and earn brokerage or other compensation or act as a market maker in the financial instruments of the company(ies) discussed herein or act as an
advisor or lender/borrower to such company(ies) or may have any other potential conflict of interests with respect to any recommendation and other related information and opinions.; however the same shall have no bearing
whatsoever on the specific recommendations made by the analyst(s), as the recommendations made by the analyst(s) are completely independent of the views of the affiliates of MOSt even though there might exist an inherent
conflict of interest in some of the stocks mentioned in the research report Reports based on technical and derivative analysis center on studying charts company's price movement, outstanding positions and trading volume, as
opposed to focusing on a company's fundamentals and, as such, may not match with a report on a company's fundamental analysis. In addition MOST has different business segments / Divisions with independent research
separated by Chinese walls catering to different set of customers having various objectives, risk profiles, investment horizon, etc, and therefore may at times have different contrary views on stocks sectors and markets.
Unauthorized disclosure, use, dissemination or copying (either whole or partial) of this information, is prohibited. The person accessing this information specifically agrees to exempt MOSt or any of its affiliates or employees from,
any and all responsibility/liability arising from such misuse and agrees not to hold MOSt or any of its affiliates or employees responsible for any such misuse and further agrees to hold MOSt or any of its affiliates or employees free
and harmless from all losses, costs, damages, expenses that may be suffered by the person accessing this information due to any errors and delays. The information contained herein is based on publicly available data or other
sources believed to be reliable. Any statements contained in this report attributed to a third party represent MOSt’s interpretation of the data, information and/or opinions provided by that third party either publicly or through a
subscription service, and such use and interpretation have not been reviewed by the third party. This Report is not intended to be a complete statement or summary of the securities, markets or developments referred to in the
document. While we would endeavor to update the information herein on reasonable basis, MOSt and/or its affiliates are under no obligation to update the information. Also there may be regulatory, compliance, or other reasons that
may prevent MOSt and/or its affiliates from doing so. MOSt or any of its affiliates or employees shall not be in any way responsible and liable for any loss or damage that may arise to any person from any inadvertent error in the
information contained in this report. MOSt or any of its affiliates or employees do not provide, at any time, any express or implied warranty of any kind, regarding any matter pertaining to this report, including without limitation the
implied warranties of merchantability, fitness for a particular purpose, and non-infringement. The recipients of this report should rely on their own investigations.
This report is intended for distribution to institutional investors. Recipients who are not institutional investors should seek advice of their independent financial advisor prior to taking any investment decision based on this report or for
any necessary explanation of its contents.
Most and it’s associates may have managed or co-managed public offering of securities, may have received compensation for investment banking or merchant banking or brokerage services, may have received any compensation
for products or services other than investment banking or merchant banking or brokerage services from the subject company in the past 12 months.
Most and it’s associates have not received any compensation or other benefits from the subject company or third party in connection with the research report.
Subject Company may have been a client of Most or its associates during twelve months preceding the date of distribution of the research report
MOSt and/or its affiliates and/or employees may have interests/positions, financial or otherwise of over 1 % at the end of the month immediately preceding the date of publication of the research in the securities mentioned in this
report. To enhance transparency, MOSt has incorporated a Disclosure of Interest Statement in this document. This should, however, not be treated as endorsement of the views expressed in the report.
Motilal Oswal Securities Limited is registered as a Research Analyst under SEBI (Research Analyst) Regulations, 2014. SEBI Reg. No. INH000000412
Pending Regulatory inspections against Motilal Oswal Securities Limited:
SEBI pursuant to a complaint from client Shri C.R. Mohanraj alleging unauthorized trading, issued a letter dated 29th April 2014 to MOSL notifying appointment of an Adjudicating Officer as per SEBI regulations to hold inquiry and
adjudge violation of SEBI Regulations; MOSL replied to the Show Cause Notice whereby SEBI granted us an opportunity of Inspection of Documents. Since all the documents requested by us were not covered we have requested to
SEBI vide our letter dated June 23, 2015 to provide pending list of documents for inspection.
List of associate companies of Motilal Oswal Securities Limited -Click
here to access detailed report
Analyst Certification
The views expressed in this research report accurately reflect the personal views of the analyst(s) about the subject securities or issues, and no part of the compensation of the research analyst(s) was, is, or will be directly or
indirectly related to the specific recommendations and views expressed by research analyst(s) in this report. The research analysts, strategists, or research associates principally responsible for preparation of MOSt research receive
compensation based upon various factors, including quality of research, investor client feedback, stock picking, competitive factors and firm revenues
Disclosure of Interest Statement
Analyst ownership of the stock
Served as an officer, director or employee
GATEWAY DISTRIPARKS
No
No
A graph of daily closing prices of securities is available at www.nseindia.com and http://economictimes.indiatimes.com/markets/stocks/stock-quotes
Regional Disclosures (outside India)
This report is not directed or intended for distribution to or use by any person or entity resident in a state, country or any jurisdiction, where such distribution, publication, availability or use would be contrary to law, regulation or which
would subject MOSt & its group companies to registration or licensing requirements within such jurisdictions.
For Hong Kong:
This report is distributed in Hong Kong by Motilal Oswal capital Markets (Hong Kong) Private Limited, a licensed corporation (CE AYY-301) licensed and regulated by the Hong Kong Securities and Futures
Commission (SFC) pursuant to the Securities and Futures Ordinance (Chapter 571 of the Laws of Hong Kong) “SFO”. As per SEBI (Research Analyst Regulations) 2014 Motilal Oswal Securities (SEBI Reg No. INH000000412) has
an agreement with Motilal Oswal capital Markets (Hong Kong) Private Limited for distribution of research report in Kong Kong. This report is intended for distribution only to “Professional Investors” as defined in Part I of Schedule 1 to
SFO. Any investment or investment activity to which this document relates is only available to professional investor and will be engaged only with professional investors.” Nothing here is an offer or solicitation of these securities,
products and services in any jurisdiction where their offer or sale is not qualified or exempt from registration. The Indian Analyst(s) who compile this report is/are not located in Hong Kong & are not conducting Research Analysis in
Hong Kong.
Motilal Oswal Securities Limited (MOSL) is not a registered broker - dealer under the U.S. Securities Exchange Act of 1934, as amended (the"1934 act") and under applicable state laws in the United States. In addition MOSL is not a
registered investment adviser under the U.S. Investment Advisers Act of 1940, as amended (the "Advisers Act" and together with the 1934 Act, the "Acts), and under applicable state laws in the United States. Accordingly, in the
absence of specific exemption under the Acts, any brokerage and investment services provided by MOSL, including the products and services described herein are not available to or intended for U.S. persons.
This report is intended for distribution only to "Major Institutional Investors" as defined by Rule 15a-6(b)(4) of the Exchange Act and interpretations thereof by SEC (henceforth referred to as "major institutional investors"). This
document must not be acted on or relied on by persons who are not major institutional investors. Any investment or investment activity to which this document relates is only available to major institutional investors and will be
engaged in only with major institutional investors. In reliance on the exemption from registration provided by Rule 15a-6 of the U.S. Securities Exchange Act of 1934, as amended (the "Exchange Act") and interpretations thereof by
the U.S. Securities and Exchange Commission ("SEC") in order to conduct business with Institutional Investors based in the U.S., MOSL has entered into a chaperoning agreement with a U.S. registered broker-dealer, Motilal Oswal
Securities International Private Limited. ("MOSIPL"). Any business interaction pursuant to this report will have to be executed within the provisions of this chaperoning agreement.
The Research Analysts contributing to the report may not be registered /qualified as research analyst with FINRA. Such research analyst may not be associated persons of the U.S. registered broker-dealer, MOSIPL, and therefore,
may not be subject to NASD rule 2711 and NYSE Rule 472 restrictions on communication with a subject company, public appearances and trading securities held by a research analyst account.
For Singapore
Motilal Oswal Capital Markets Singapore Pte Limited is acting as an exempt financial advisor under section 23(1)(f) of the Financial Advisers Act(FAA) read with regulation 17(1)(d) of the Financial Advisors Regulations and is a
subsidiary of Motilal Oswal Securities Limited in India. This research is distributed in Singapore by Motilal Oswal Capital Markets Singapore Pte Limited and it is only directed in Singapore to accredited investors, as defined in the
Financial Advisers Regulations and the Securities and Futures Act (Chapter 289), as amended from time to time.
In respect of any matter arising from or in connection with the research you could contact the following representatives of Motilal Oswal Capital Markets Singapore Pte Limited:
Varun Kumar
Varun.kumar@motilaloswal.com
Contact : (+65) 68189232
Office Address:21 (Suite 31),16 Collyer Quay,Singapore 04931
Kadambari Balachandran
kadambari.balachandran@motilaloswal.com
(+65) 68189233 / 65249115
For U.S
28 April 2016
Motilal Oswal Tower, Level 9, Sayani Road, Prabhadevi, Mumbai 400 025
Phone: +91 22 3982 5500 E-mail: reports@motilaloswal.com
Motilal Oswal Securities Ltd
12