BSE SENSEX
25,120
S&P CNX
7,707
Godrej Consumer
CMP: INR1,336
TP: INR1,325(-1%)
Project Leapfrog II articulated
Neutral
Accelerating core growth
We recently attended Godrej Consumer’s Analyst Meet. The following are
the key takeaways:
4 May 2016
Update
| Sector:
Consumer
Stock Info
Bloomberg
Equity Shares (m)
52-Week Range (INR)
1, 6, 12 Rel. Per (%)
M.Cap. (INR b)
M.Cap. (USD b)
12M Avg Val (INR M)
Free float (%)
GCPL IN
340.5
1457 / 1024
-3/12/35
454.9
6.9
312
36.7
Financials Snapshot (INR b)
Y/E Mar
2016 2017E 2018E
Net Sales
89.6 110.0 126.2
EBITDA
16.1
20.8
23.4
PAT
11.4
14.0
16.1
EPS (INR)
33.6
41.1
47.3
Gr. (%)
26.1
22.3
15.1
BV/Sh (INR)
150.4 179.8 215.4
RoE (%)
23.9
24.9
23.9
RoCE (%)
19.5
21.3
20.6
P/E (x)
39.7
32.5
28.2
P/BV (x)
8.9
7.4
6.2
Shareholding pattern (%)
As On
Dec-15 Sep-15 Dec-14
Promoter
63.3
63.3
63.3
DII
1.8
1.7
1.9
FII
28.7
28.7
29.0
Others
6.3
6.3
5.9
FII Includes depository receipts
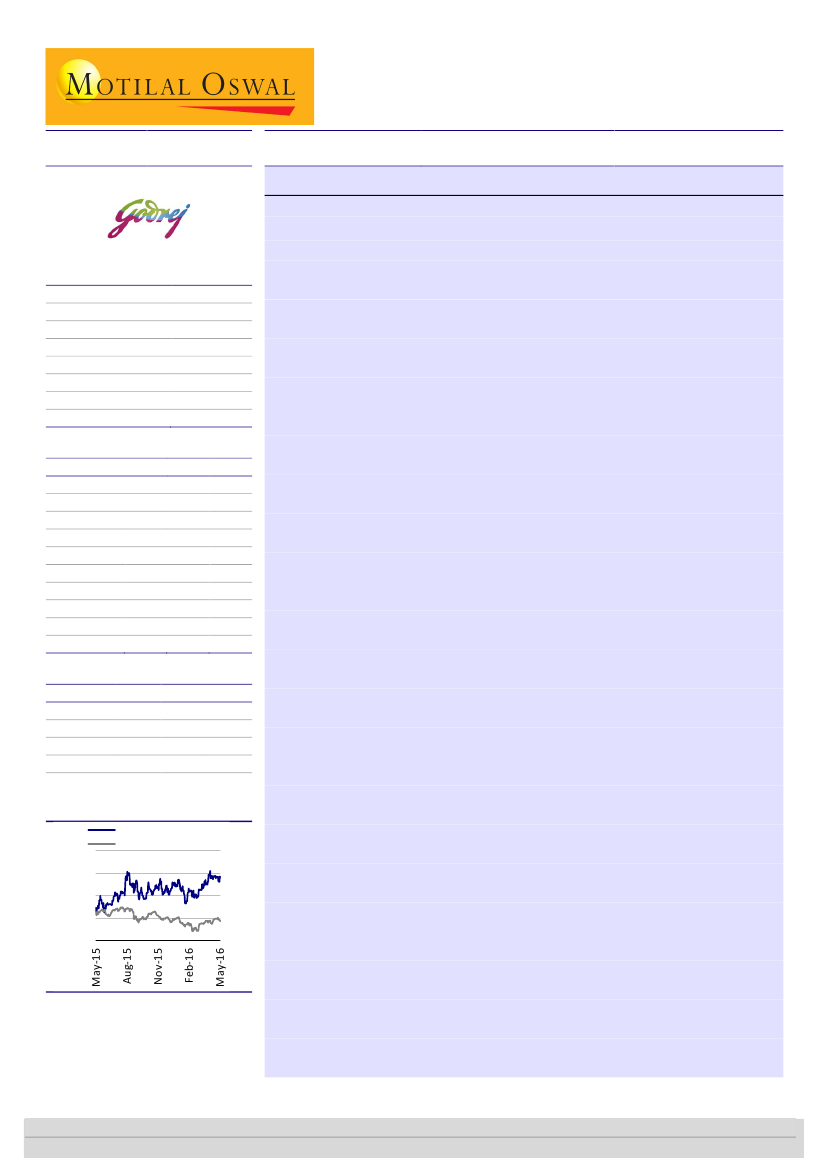
Stock Performance (1-year)
Godrej Consumer
Sensex - Rebased
1,600
1,400
1,200
1,000
800
Overall business:
In FY16, GCPL’s international business contributed 47% of its
consolidated sales. The company caters to 2b people across its targeted
geographies. Out of GCPL’s consolidated sales, Household Insecticides
comprised 33%, Hair Care 27%, Personal Wash 18% and Others 22%. The Top 8
brands made up 75% of total sales and included Good Knight, Hit India, Hit
Indonesia, Godrej No. 1, Godrej Expert, Cinthol, Stella and Darling. In 90% of
their global categories, these brands are ranked either first or second in terms
of market share. In the air freshener category, the company is No. 1 in
Indonesia and No. 2 in India. GCPL expects to become No. 1 in India in the
category over the next 2-3 years if the current momentum sustains. The
management reckons that their personal care approach to the Air Freshener
segment is helping it develop better products in comparison to global MNCs
focusing on the traditional Home Care segment. Project Pi led to savings of
INR750m in FY16 as a result of (a) Strategic sourcing all clusters, (b) Packaging
modifications, (c) Manufacturing efficiencies and (d) Optimization of ATL and
BTL marketing expenses.
Overall business strategy ahead:
The management announced the start of
Project Leapfrog II which will involve: (a) Thinking boldly about future targets
of being among the Top 3 players in HPC in India and Indonesia, becoming the
No 1 HPC player in Sub-Saharan Africa and the leading hair color company in
LatAm (ex-Brazil,) (b) Accelerating core growth mainly by driving reach and
penetration, (c) Placing a few bets to plant seeds for the future, including Air
Care, Hair Styling and Wellness in India, Baby Care and Hair Care in Indonesia,
and Hair Care and Household Insecticides in Africa, (d) Drive profitability to
fund growth plans, (e) Invest in developing talent and capabilities.
Going forward, the management has guided for a larger proportion of overseas
business as compared to India sales. The company is well-placed to grow
sharply in HPC on the S Curve in a number of emerging markets. For FY17,
Africa, Godrej Protekt and BBlunt will be the key focus areas. BBlunt
advertising, which will commence in this year, will be entirely digital.
India business and strategy:
GCPL reaches 4.5m outlets in India with a direct
reach of over 1m outlets. In terms of rural markets, it reaches over 60,000
villages. The rural markets will be a key growth area, going forward, with the
company targeting an increase in the contribution of rural sales to total sales at
40% from the current 28% over the next 6-7 years. GCPL’s ambitious rural
growth drive will focus on three main brands, viz. Good Knight, Godrej Expert
and Godrej No. 1. It is adopting various strategies, such as split distribution and
roll out of handheld devices to sales representatives of rural distributors, which
has already been implemented among 1200 rural sub-stockists. The key trends
in India that will drive GCPL’s strategy ahead are: (a) Accelerating
premiumization, (b) Rise of small-town India, (c) Duality of rural growth, both
premium-led and penetration-led, and (d) Take off of online and mobile.
Krishnan Sambamoorthy
(Krishnan.Sambamoorthy@MotilalOswal.com); +91 22 3982 5428
Vishal Punmiya
(Vishal.Punmiya@MotilalOswal.com); +91 22 3980 4261
Investors are advised to refer through important disclosures made at the last page of the Research Report.
Motilal Oswal research is available on www.motilaloswal.com/Institutional-Equities, Bloomberg, Thomson Reuters, Factset and S&P Capital.

Godrej Consumer
International business and strategy:
After the SoN acquisition, GCPL is the
largest hair care brand worldwide for women of African origin. Acquiring strong
local brands and working with the local team will continue to be an important
part of its overseas growth strategy. The management believes that unlike
global MNCs, GCPL respects local consumers in all the emerging markets and
tries to sell them superior products at affordable price points. In fact, the per
capita consumption of GCPL’s products in Mozambique, South Africa, Uganda
and Tanzania is higher as compared to India. The company has local or regional
manufacturing in most of the geographies in which it operates, thus easing
logistics and supply chain integration. Presently, the African business comprises
largely of hair extensions, though Household Insecticides will become a key
focus area, going forward. The addressable market for Household Insecticides in
Africa is worth USD3b. GCPL will leverage on its global expertise in Household
Insecticides with the initial African launch set to take place in Nigeria and
Tanzania. The current market share in the entire HPC segment in Africa is very
fragmented across geographies. Africa’s distribution infrastructure is 15-20
years behind that of India in terms of evolution. GCPL plans to apply all the
learning acquired from the robust distribution in India to Africa. In Asia, the
geographies that GCPL is looking to enter are Bangladesh and Myanmar,
followed by Iran and Pakistan, all potentially through organic means, while for
Vietnam it is likely to be through an acquisition.
Valuation & View:
At 32.5x FY17E and 28.2x FY18E EPS, the stock trades at a
discount to the sector. GCPL’s exposure to various geographies with attendant
currency risks and relatively lower RoE (mid-20s) justify the discount, in our
view. Maintain Neutral with a target price of INR1,325 (28x FY18E adjusted EPS).
4 May 2016
2

Godrej Consumer
Exhibit 1: Category-wise revenue break-up
Exhibit 2: Growing salience of international business
Source: Company, MOSL
Exhibit 3: Top 8 brands constitute 75% of global business
Exhibit 4: International revenue break-up
Source: Company, MOSL
Exhibit 5: Design driven innovation approach
Source: Company, MOSL
4 May 2016
3

Godrej Consumer
Financials and Valuations
Income Statement
Y/E Mar
Net Sales
Change (%)
EBITDA
EBITDA Margin (%)
Depreciation
EBIT
Interest
Other Income
Extraordinary items
PBT
Tax
Tax Rate (%)
Min. Int. & Assoc. Share
Reported PAT
Adjusted PAT
Change (%)
2011
36,430
78.5
6,460
17.7
499
5,961
519
676
331
6,449
1,302
20.2
0
5,147
4,661
37.3
2012
48,662
33.6
8,554
17.6
644
7,910
658
741
2,002
9,994
2,261
22.6
245
7,488
5,304
13.8
2013
64,163
31.9
9,824
15.3
770
9,054
775
678
1,289
10,246
1,792
17.5
493
7,961
6,506
22.7
2014
76,024
18.5
11,568
15.2
819
10,749
1,074
627
-6
10,297
2,104
20.4
596
7,597
7,439
14.3
2015
82,764
8.9
13,653
16.5
908
12,745
1,002
915
-172
12,487
2,723
21.8
693
9,071
9,079
22.0
2016
89,572
8.2
16,135
18.0
1,031
15,104
1,002
926
-249
14,779
3,191
21.6
395
11,194
11,442
26.0
2017E
110,014
22.8
20,777
18.9
1,018
19,759
1,435
907
0
19,230
4,539
23.6
700
13,992
13,992
22.3
(INR Million)
2018E
126,188
14.7
23,444
18.6
1,117
22,327
1,455
1,129
0
22,001
5,200
23.6
700
16,101
16,101
15.1
Balance Sheet
Y/E Mar
Share Capital
Reserves
Net Worth
Debt
Deferred Tax
Total Capital Employed
Gross Fixed Assets
Less: Acc Depreciation
Net Fixed Assets
Capital WIP
Investments
Current Assets
Inventory
Debtors
Cash & Bank
Loans & Adv, Others
Curr Liabs & Provns
Curr. Liabilities
Provisions
Net Current Assets
Total Assets
2011
324
16,928
17,252
20,032
86
37,369
19,148
3,775
15,373
154
0
13,774
4,394
3,840
2,269
3,271
7,335
7,246
89
6,439
37,370
2012
340
27,699
28,040
18,769
-5
47,686
20,403
4,940
15,464
376
635
22,048
7,839
4,725
5,764
3,719
12,290
11,862
428
9,757
47,686
2013
340
32,790
33,130
24,563
-140
59,649
21,575
5,699
15,876
1,409
1,212
29,230
10,471
7,288
7,476
3,995
17,162
16,736
426
12,068
59,649
2014
340
37,414
37,754
23,734
-203
63,536
22,511
6,821
15,689
1,671
1,363
28,751
10,821
7,321
7,048
3,561
19,462
19,075
387
9,289
63,536
2015
340
42,767
43,107
27,172
-312
71,587
22,890
7,821
15,069
2,246
1,857
31,464
10,717
8,046
8,942
3,759
19,489
18,756
734
11,974
71,587
2016
340
50,007
50,348
31,822
439
83,450
24,340
8,698
15,643
2,246
1,363
38,396
13,073
11,179
10,178
3,966
19,939
19,205
734
18,457
83,450
(INR Million)
2017E
340
59,301
59,641
40,422
593
102,197
29,090
9,716
19,375
2,246
1,363
48,094
16,276
12,056
15,255
4,507
19,621
18,887
734
28,474
102,198
2018E
340
70,704
71,044
40,422
765
114,473
33,840
10,833
23,008
2,246
1,363
57,196
18,669
12,100
21,302
5,125
20,081
19,348
734
37,115
114,472
4 May 2016
4

Godrej Consumer
Financials and Valuations
Ratios
Y/E Mar
Basic (INR)
EPS
Cash EPS
Book Value
DPS
Payout (incl. Div. Tax.)
Valuation(x)
P/E
Cash P/E
Price / Book Value
EV/Sales
EV/EBITDA
Dividend Yield (%)
Profitability Ratios (%)
RoE
RoCE
Turnover Ratios (%)
Asset Turnover (x)
Debtors (No. of Days)
Leverage Ratios (%)
Net Debt/Equity (x)
1.0
0.4
0.5
0.4
0.4
0.4
0.4
0.3
2.3
38
3.1
35
3.7
41
4.4
35
4.8
35
5.0
46
5.1
40
5.0
35
34.8
25.2
23.0
18.6
20.3
16.9
19.8
17.5
21.4
18.9
23.9
19.5
24.9
21.3
23.9
20.6
61.1
55.1
11.4
6.2
40.7
0.4
50.1
45.5
10.2
5.7
34.6
0.5
39.7
36.4
8.9
5.3
29.5
0.7
32.5
30.3
7.4
4.4
23.1
0.9
28.2
26.4
6.2
3.8
20.2
0.9
14.4
15.9
53.3
5.0
35.0
15.6
17.5
85.0
1.7
11.2
19.1
21.4
103.5
5.0
26.2
21.9
24.3
117.5
5.3
24.0
26.7
29.3
131.4
7.1
26.7
33.6
36.7
150.4
9.7
28.9
41.1
44.1
179.8
11.8
28.7
47.3
50.6
215.4
11.8
24.9
2011
2012
2013
2014
2015
2016
2017E
2018E
Cash Flow Statement
Y/E Mar
Adjusted EBITDA
Non cash opr. exp (inc)
(Inc)/Dec in Wkg. Cap.
Tax Paid
Other operating activities
CF from Op. Activity
(Inc)/Dec in FA & CWIP
Free cash flows
(Pur)/Sale of Invt
Others
CF from Inv. Activity
Inc/(Dec) in Net Worth
Inc / (Dec) in Debt
Interest Paid
Divd Paid (incl Tax) & Others
CF from Fin. Activity
Inc/(Dec) in Cash
Add: Opening Balance
Closing Balance
2011
6,460
268
-3,654
-1,298
331
2,107
-15,144
-13,037
670
-12,285
-26,760
15
19,663
-519
4,711
23,870
-783
3,052
2,269
2012
8,554
619
176
-2,279
2,002
9,071
-1,478
7,593
0
-6,050
-7,528
17
-1,263
-658
3,856
1,951
3,495
2,269
5,764
2013
9,824
350
-598
-1,919
1,289
8,946
-2,205
6,741
0
-7,630
-9,835
0
5,794
-775
-2,418
2,602
1,712
5,764
7,476
2014
11,568
285
2,351
-2,167
-6
12,031
-1,197
10,833
-343
-6,440
-7,980
0
-829
-1,074
-2,576
-4,478
-428
7,476
7,048
2015
13,653
284
-791
-2,861
-172
10,113
-955
9,158
0
-4,916
-5,872
0
3,437
-1,002
-4,783
-2,347
1,894
7,048
8,942
2016
16,135
284
-5,247
-3,191
-249
7,732
-1,450
6,282
0
-5,300
-6,750
0
4,650
-1,002
-3,394
254
1,236
8,942
10,178
2017E
20,777
405
-4,939
-4,385
0
11,858
-4,750
7,108
0
-5,000
-9,750
0
8,600
-1,435
-4,197
2,968
5,077
10,178
15,255
(INR Million)
2018E
23,444
577
-2,594
-5,027
0
16,399
-4,750
11,649
0
0
-4,750
0
0
-1,455
-4,147
-5,602
6,047
15,255
21,302
4 May 2016
5

Disclosures
This document has been prepared by Motilal Oswal Securities Limited (hereinafter referred to as Most) to provide information about the company (ies) and/sector(s), if any, covered in the report and may be distributed by it and/or its
Godrej Consumer
affiliated company(ies). This report is for personal information of the selected recipient/s and does not construe to be any investment, legal or taxation advice to you. This research report does not constitute an offer, invitation or
inducement to invest in securities or other investments and Motilal Oswal Securities Limited (hereinafter referred as MOSt) is not soliciting any action based upon it. This report is not for public distribution and has been furnished to
you solely for your general information and should not be reproduced or redistributed to any other person in any form. This report does not constitute a personal recommendation or take into account the particular investment
objectives, financial situations, or needs of individual clients. Before acting on any advice or recommendation in this material, investors should consider whether it is suitable for their particular circumstances and, if necessary, seek
professional advice. The price and value of the investments referred to in this material and the income from them may go down as well as up, and investors may realize losses on any investments. Past performance is not a guide for
future performance, future returns are not guaranteed and a loss of original capital may occur.
MOSt and its affiliates are a full-service, integrated investment banking, investment management, brokerage and financing group. We and our affiliates have investment banking and other business relationships with a some
companies covered by our Research Department. Our research professionals may provide input into our investment banking and other business selection processes. Investors should assume that MOSt and/or its affiliates are
seeking or will seek investment banking or other business from the company or companies that are the subject of this material and that the research professionals who were involved in preparing this material may educate investors
on investments in such business . The research professionals responsible for the preparation of this document may interact with trading desk personnel, sales personnel and other parties for the purpose of gathering, applying and
interpreting information. Our research professionals are paid on twin parameters of performance & profitability of MOSt.
MOSt generally prohibits its analysts, persons reporting to analysts, and members of their households from maintaining a financial interest in the securities or derivatives of any companies that the analysts cover. Additionally, MOSt
generally prohibits its analysts and persons reporting to analysts from serving as an officer, director, or advisory board member of any companies that the analysts cover. Our salespeople, traders, and other professionals or affiliates
may provide oral or written market commentary or trading strategies to our clients that reflect opinions that are contrary to the opinions expressed herein, and our proprietary trading and investing businesses may make investment
decisions that are inconsistent with the recommendations expressed herein. In reviewing these materials, you should be aware that any or all of the foregoing among other things, may give rise to real or potential conflicts of interest.
MOSt and its affiliated company(ies), their directors and employees and their relatives may; (a) from time to time, have a long or short position in, act as principal in, and buy or sell the securities or derivatives thereof of companies
mentioned herein. (b) be engaged in any other transaction involving such securities and earn brokerage or other compensation or act as a market maker in the financial instruments of the company(ies) discussed herein or act as an
advisor or lender/borrower to such company(ies) or may have any other potential conflict of interests with respect to any recommendation and other related information and opinions.; however the same shall have no bearing
whatsoever on the specific recommendations made by the analyst(s), as the recommendations made by the analyst(s) are completely independent of the views of the affiliates of MOSt even though there might exist an inherent
conflict of interest in some of the stocks mentioned in the research report Reports based on technical and derivative analysis center on studying charts company's price movement, outstanding positions and trading volume, as
opposed to focusing on a company's fundamentals and, as such, may not match with a report on a company's fundamental analysis. In addition MOST has different business segments / Divisions with independent research
separated by Chinese walls catering to different set of customers having various objectives, risk profiles, investment horizon, etc, and therefore may at times have different contrary views on stocks sectors and markets.
Unauthorized disclosure, use, dissemination or copying (either whole or partial) of this information, is prohibited. The person accessing this information specifically agrees to exempt MOSt or any of its affiliates or employees from,
any and all responsibility/liability arising from such misuse and agrees not to hold MOSt or any of its affiliates or employees responsible for any such misuse and further agrees to hold MOSt or any of its affiliates or employees free
and harmless from all losses, costs, damages, expenses that may be suffered by the person accessing this information due to any errors and delays. The information contained herein is based on publicly available data or other
sources believed to be reliable. Any statements contained in this report attributed to a third party represent MOSt’s interpretation of the data, information and/or opinions provided by that third party either publicly or through a
subscription service, and such use and interpretation have not been reviewed by the third party. This Report is not intended to be a complete statement or summary of the securities, markets or developments referred to in the
document. While we would endeavor to update the information herein on reasonable basis, MOSt and/or its affiliates are under no obligation to update the information. Also there may be regulatory, compliance, or other reasons that
may prevent MOSt and/or its affiliates from doing so. MOSt or any of its affiliates or employees shall not be in any way responsible and liable for any loss or damage that may arise to any person from any inadvertent error in the
information contained in this report. MOSt or any of its affiliates or employees do not provide, at any time, any express or implied warranty of any kind, regarding any matter pertaining to this report, including without limitation the
implied warranties of merchantability, fitness for a particular purpose, and non-infringement. The recipients of this report should rely on their own investigations.
This report is intended for distribution to institutional investors. Recipients who are not institutional investors should seek advice of their independent financial advisor prior to taking any investment decision based on this report or for
any necessary explanation of its contents.
Most and it’s associates may have managed or co-managed public offering of securities, may have received compensation for investment banking or merchant banking or brokerage services, may have received any compensation
for products or services other than investment banking or merchant banking or brokerage services from the subject company in the past 12 months.
Most and it’s associates have not received any compensation or other benefits from the subject company or third party in connection with the research report.
Subject Company may have been a client of Most or its associates during twelve months preceding the date of distribution of the research report
MOSt and/or its affiliates and/or employees may have interests/positions, financial or otherwise of over 1 % at the end of the month immediately preceding the date of publication of the research in the securities mentioned in this
report. To enhance transparency, MOSt has incorporated a Disclosure of Interest Statement in this document. This should, however, not be treated as endorsement of the views expressed in the report.
Motilal Oswal Securities Limited is registered as a Research Analyst under SEBI (Research Analyst) Regulations, 2014. SEBI Reg. No. INH000000412
Pending Regulatory inspections against Motilal Oswal Securities Limited:
SEBI pursuant to a complaint from client Shri C.R. Mohanraj alleging unauthorized trading, issued a letter dated 29th April 2014 to MOSL notifying appointment of an Adjudicating Officer as per SEBI regulations to hold inquiry and
adjudge violation of SEBI Regulations; MOSL replied to the Show Cause Notice whereby SEBI granted us an opportunity of Inspection of Documents. Since all the documents requested by us were not covered we have requested to
SEBI vide our letter dated June 23, 2015 to provide pending list of documents for inspection.
List of associate companies of Motilal Oswal Securities Limited -Click
here to access detailed report
Analyst Certification
The views expressed in this research report accurately reflect the personal views of the analyst(s) about the subject securities or issues, and no part of the compensation of the research analyst(s) was, is, or will be directly or
indirectly related to the specific recommendations and views expressed by research analyst(s) in this report. The research analysts, strategists, or research associates principally responsible for preparation of MOSt research receive
compensation based upon various factors, including quality of research, investor client feedback, stock picking, competitive factors and firm revenues
Disclosure of Interest Statement
Analyst ownership of the stock
Served as an officer, director or employee
GODREJ CONSUMER PRODUCTS
No
No
A graph of daily closing prices of securities is available at www.nseindia.com and http://economictimes.indiatimes.com/markets/stocks/stock-quotes
Regional Disclosures (outside India)
This report is not directed or intended for distribution to or use by any person or entity resident in a state, country or any jurisdiction, where such distribution, publication, availability or use would be contrary to law, regulation or which
would subject MOSt & its group companies to registration or licensing requirements within such jurisdictions.
For Hong Kong:
This report is distributed in Hong Kong by Motilal Oswal capital Markets (Hong Kong) Private Limited, a licensed corporation (CE AYY-301) licensed and regulated by the Hong Kong Securities and Futures
Commission (SFC) pursuant to the Securities and Futures Ordinance (Chapter 571 of the Laws of Hong Kong) “SFO”. As per SEBI (Research Analyst Regulations) 2014 Motilal Oswal Securities (SEBI Reg No. INH000000412) has
an agreement with Motilal Oswal capital Markets (Hong Kong) Private Limited for distribution of research report in Kong Kong. This report is intended for distribution only to “Professional Investors” as defined in Part I of Schedule 1 to
SFO. Any investment or investment activity to which this document relates is only available to professional investor and will be engaged only with professional investors.” Nothing here is an offer or solicitation of these securities,
products and services in any jurisdiction where their offer or sale is not qualified or exempt from registration. The Indian Analyst(s) who compile this report is/are not located in Hong Kong & are not conducting Research Analysis in
Hong Kong.
Motilal Oswal Securities Limited (MOSL) is not a registered broker - dealer under the U.S. Securities Exchange Act of 1934, as amended (the"1934 act") and under applicable state laws in the United States. In addition MOSL is not a
registered investment adviser under the U.S. Investment Advisers Act of 1940, as amended (the "Advisers Act" and together with the 1934 Act, the "Acts), and under applicable state laws in the United States. Accordingly, in the
absence of specific exemption under the Acts, any brokerage and investment services provided by MOSL, including the products and services described herein are not available to or intended for U.S. persons.
This report is intended for distribution only to "Major Institutional Investors" as defined by Rule 15a-6(b)(4) of the Exchange Act and interpretations thereof by SEC (henceforth referred to as "major institutional investors"). This
document must not be acted on or relied on by persons who are not major institutional investors. Any investment or investment activity to which this document relates is only available to major institutional investors and will be
engaged in only with major institutional investors. In reliance on the exemption from registration provided by Rule 15a-6 of the U.S. Securities Exchange Act of 1934, as amended (the "Exchange Act") and interpretations thereof by
the U.S. Securities and Exchange Commission ("SEC") in order to conduct business with Institutional Investors based in the U.S., MOSL has entered into a chaperoning agreement with a U.S. registered broker-dealer, Motilal Oswal
Securities International Private Limited. ("MOSIPL"). Any business interaction pursuant to this report will have to be executed within the provisions of this chaperoning agreement.
The Research Analysts contributing to the report may not be registered /qualified as research analyst with FINRA. Such research analyst may not be associated persons of the U.S. registered broker-dealer, MOSIPL, and therefore,
may not be subject to NASD rule 2711 and NYSE Rule 472 restrictions on communication with a subject company, public appearances and trading securities held by a research analyst account.
For Singapore
Motilal Oswal Capital Markets Singapore Pte Limited is acting as an exempt financial advisor under section 23(1)(f) of the Financial Advisers Act(FAA) read with regulation 17(1)(d) of the Financial Advisors Regulations and is a
subsidiary of Motilal Oswal Securities Limited in India. This research is distributed in Singapore by Motilal Oswal Capital Markets Singapore Pte Limited and it is only directed in Singapore to accredited investors, as defined in the
Financial Advisers Regulations and the Securities and Futures Act (Chapter 289), as amended from time to time.
In respect of any matter arising from or in connection with the research you could contact the following representatives of Motilal Oswal Capital Markets Singapore Pte Limited:
Varun Kumar
Varun.kumar@motilaloswal.com
Contact : (+65) 68189232
Office Address:21 (Suite 31),16 Collyer Quay,Singapore 04931
Kadambari Balachandran
kadambari.balachandran@motilaloswal.com
(+65) 68189233 / 65249115
For U.S
4 May 2016
Motilal Oswal Tower, Level 9, Sayani Road, Prabhadevi, Mumbai 400 025
Phone: +91 22 3982 5500 E-mail: reports@motilaloswal.com
Motilal Oswal Securities Ltd
6