25 May 2016
Q4FY16 Results Update | Sector: Automobiles
Bosch Ltd
Buy
BSE SENSEX
25,881
Bloomberg
Equity Shares (m)
M.Cap.(INRb)/(USDb)
52-Week Range (INR)
1, 6, 12 Rel. Per (%)
Avg Val, INRm/ Vol m
Free float (%)
S&P CNX
7,935
BOS IN
31.4
688.1 / 10.2
26,701/15,753
10/19/0
568.9 / 0.0
28.8
CMP: INR21,914
TP: INR24,659(+13%)
Above Estimates; Lower cost drives EBITDA margins to decadal high
Financials & Valuations (INR b)
Y/E Mar
2016 2017E 2018E
Net Sales
106.1
130.2
145.6
EBITDA
18.8
24.4
28.4
PAT
12.5
16.4
22.0
EPS (INR)
396.8
522.9
699.5
Gr. (%)
-8.2
31.8
33.8
BV/Sh (INR) 2,639.8 3,031.9 3,556.6
RoE (%)
15.9
18.4
21.2
RoCE (%)
23.6
26.3
28.3
P/E (x)
55.2
41.9
31.3
P/BV (x)
8.3
7.2
6.2
Estimate change
TP change
Rating change
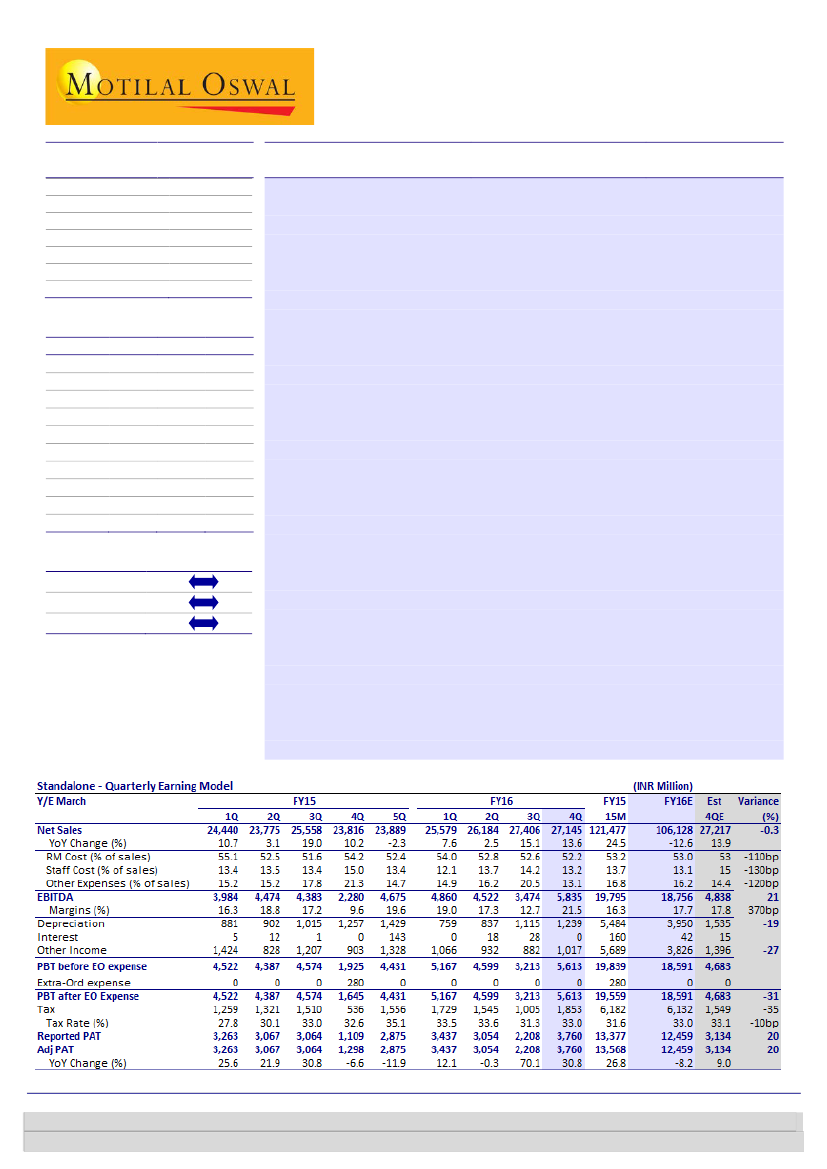
In-line revenue driven by strong growth in auto:
Bosch Ltd.’s (BOS) net sales
for 4QFY16 at INR27.1b were in line with our estimate of INR27.2b and were up
14% YoY (-1% QoQ), driven by a growth of ~14.7% YoY in auto and ~9.6% YoY in
non-auto. Domestic revenue grew by ~15.5% YoY, but exports declined by
~9.1% YoY due to a decline of 17.4% YoY in auto exports.
Lower overall costs drive highest margin in decade:
BOS’ EBITDA margin
surged higher by ~880bp QoQ (+190bp YoY) to ~21.5% (vs. our estimate of
~17.8%), driven by lower than estimated overall costs. Raw material costs were
down ~40bp QoQ, staff cost declined by ~100bp QoQ and other expenses fell
by 740bp QoQ. Adjusted PAT stood at ~INR3.8b (vs. our estimate of ~INR3.1b),
marking a growth of ~31% YoY (+70% QoQ).
Earnings call highlights:
a) BOS’ Gasoline and Diesel business grew in the
double-digits. A decline in the share of diesel PV was more than offset by a
robust growth in the CV and tractor segments b) In the non-auto business,
security systems witnessed a double-digit growth, while revenue from starters
& generators remained flat. The growth in Thermo technology was primarily
due to one-time export orders c) Management provided a capex guidance of
INR7.7b for FY17 towards a new office building in Bangalore and capacity
expansion at the Nashik and Bidadi plants d) The implementation of BS VI for 2
wheelers presents a long-term opportunity for BOS e) The localization for BSIV
CRDi is relatively higher.
Demerger of Starter Motor and Generator business expected by Aug-16:
BOS
has received approval from the board and shareholders for selling off its SMG
division for INR4.86b to a 100% subsidiary of the parent. The SMG division
recorded revenue of ~INR8.9b and PBT of ~INR262m in FY16, implying a deal
valuation of ~0.55x FY16 sales (as compared to BOS’ EV/Sales of ~5x CY14).
Valuation and view:
We are largely maintaining our EPS estimates for FY17/18,
despite factoring in the divestment of SMG from FY18 onwards. The stock
trades at 41.9x/31.3x FY17E/18E EPS. Maintain
Buy
with a target price of
INR24,659 (~35x FY18E).
Investors are advised to refer through important disclosures made at the last page of the Research Report.
Motilal Oswal research is available on www.motilaloswal.com/Institutional-Equities, Bloomberg, Thomson Reuters, Factset and S&P Capital.
Jinesh Gandhi
(Jinesh@MotilalOswal.com); +91 22 3982 5416
Aditya Vora
(Aditya.Vora@MotilalOswal.com); +91 22 3078 4701
 Motilal Oswal Financial Services
Bosch Ltd
Exhibit 1: Domestic auto business drives revenues in 4QFY16
Net Sales (INR b)
19
11
6
5
1
3
10
23.9
-2
8
2
25.6 26.2 27.4 27.1
Growth (%)
15
14
8.6
Exhibit 2:
Down trend in export growth continues
35.0
Domestic Growth (%)
Exports Growth (%)
17.4
2.4
3.3
16.4
6.9
(4.2) (1.2)
(9.5)
11.7
9.2
12.9
15.5
23.1 21.5 21.6 24.4 23.8 25.6 23.8
(18.5)
(3.2)
(17.3)
(9.1)
Source: Company, MOSL
Exhibit 3: Revenue Breakup
INR m
Auto
Growth (%)
Contribution (%)
Non-Auto
Growth (%)
Contribution (%)
Total (post inter segment)
Growth (%)
1QFY15
21,330
12.0
87.0
2,766
4.9
13.1
24,504
10.9
2QFY15
21,043
3.4
88.5
2,766
1.0
11.6
23,775
3.1
3QFY15
22,833
20.9
89.3
2,742
3.9
10.7
25,558
18.9
4QFY15
21,386
13.9
87.0
3,390
15.5
13.8
24,582
13.7
5QFY15
21,042
(1.3)
88.1
2,850
(11.3)
11.9
23,889
(2.5)
1QFY16
22,189
5.4
86.7
3,419
23.6
13.4
25,579
7.6
2QFY16
23,226
1.7
88.7
3,027
10.4
11.6
26,194
2.5
3QFY16
23,540
10.1
85.9
4,258
25.6
15.5
27,406
11.5
4QFY16
24,129
14.7
88.9
3,124
9.6
11.5
27,145
13.6
Source: Company, MOSL
Exhibit 4: Highest EBITDA margins since 2QCY05
EBITDA (INR b)
15.7 15.2
9.9
16.3
18.8
17.2
9.6
EBITDA Margins (%)
19.6 19.0
21.5
17.3
12.7
Exhibit 5: Robust domestic Auto business leading to
increased share in overall PBIT
Auto
9.2
4.6
3.9
26.0
Non-Auto
1.9
2.4
4.3
13.8
2.9
90.8
95.4
96.1
74.0
98.1
97.6
95.7
86.2
97.1
3.6 3.3 2.1 4.0 4.5 4.4 2.3 4.7 4.9 4.5 3.5 5.8
Source: Company, MOSL
5QFY15
3,560
4.4
16.9
71
(79.7)
2.5
3,631
(3.4)
15.2
1QFY16
4,367
17.1
19.7
106
(41.4)
3.1
4,474
14.4
17.5
2QFY16
4,007
12.0
17.3
180
22.7
5.9
4,187
12.4
15.9
3QFY16
2,357
177.7
10.0
376
25.8
8.8
2,733
138.2
9.8
4QFY16
4,740
33.1
19.6
143
102.4
4.6
4,883
34.5
17.9
Exhibit 6: PBIT Breakup
INR m
Auto
Growth (%)
PBIT Margins (%)
Non-Auto
Growth (%)
PBIT Margins (%)
Total
Growth (%)
PBIT Margins (%)
1QFY15
3,411
12.9
16.0
347
(13.8)
10.8
3,759
9.8
15.3
2QFY15
3,729
19.4
17.7
181
(3,517.0)
6.5
3,910
25.4
16.4
3QFY15
3,579
35.3
15.7
147
137.0
5.3
3,726
37.7
14.6
4QFY15
849
(36.0)
4.0
299
183.7
8.8
1,148
(19.9)
4.6
Source: Company, MOSL
25 May 2016
2
 Motilal Oswal Financial Services
Bosch Ltd
Valuation and view
Strong industry positioning, technology focus enables high growth visibility
BOS enjoys very strong and unique positioning in the auto component industry
with focus on technology enabling high value add, strong relationships with
OEMs and strong aftermarket presence (refer Exhibit 50).
BOS has several levers to drive over 18-20% CAGR in revenues over the next 5-6
years (~21% CAGR over FY16-18), as BOS is at forefront of technological
evolution of the Indian auto industry.
Operating leverage would drive EBITDA margin improvement of ~150bp to
~18.2% by FY18, driving ~32% EPS CAGR over FY16-18 (on the back of flat EPS
over CY11-14). As a result, we estimate RoEs to improve by ~500bp to ~20.3%
and RoICs by 10.6pp to 34.3% by FY18.
BOS stock has got significantly corrected over the last 3 months, impacted by
slower than expected revenue growth in-line with weaker than expected
recovery in PVs, LCVs and tractors.
We largely maintain our EPS for FY17/18, despite factoring in for divestment of
SMG from FY18 onwards.
The stock trades at 41.9x/31.3x FY17E/18E EPS. BOS premium valuations vis-à-
vis its auto component peers is manifestation of very strong and unique industry
positioning as reflected in lower cyclicality in operating performance, stronger
long term growth outlook and superior capital efficiencies.
Maintain Buy with a target price of INR24,659 (~35x FY18E).
Exhibit 7: Revised estimates
(INR b)
Net Sales
EBITDA Margin (%)
PAT
EPS (Rs)
Rev
130.2
18.7
16.4
522.9
FY17E
Old
130.9
18.4
16.6
529.2
Chg (%)
-0.5
30bp
-1.2
-1.2
Rev
145.6
19.5
22.0
699.5
FY18E
Old
157.2
18.5
21.5
685.6
Chg (%)
-7.4
100bp
2.0
2.0
Source: MOSL
Exhibit 8: Valuations at marginal premium to LP
75
60
45
30
15
0
P/E (x)
5 Yrs Avg(x)
15 Yrs Avg(x)
10 Yrs Avg(x)
39.7
26.0
12
9
33.8
20.7
6
3
0
4.7
3.9
5.5
P/B (x)
5 Yrs Avg(x)
15 Yrs Avg(x)
10 Yrs Avg(x)
7.0
Source: MOSL
Source: MOSL
25 May 2016
3
 Motilal Oswal Financial Services
Bosch Ltd
Exhibit 9: Comparative valuation
Auto OEM's
Bajaj Auto
Hero MotoCorp
TVS Motor
M&M
Maruti Suzuki
Tata Motors
Ashok Leyland
Eicher Motors
Auto Ancillaries
Bharat Forge
742 Buy
Exide Industries
157 Buy
Amara Raja Batt. 851 Buy
BOSCH
21,914 Buy
CMP * Rating
(INR)
2,479 Buy
2,929 Buy
296 Buy
1,312 Neutral
4,054 Buy
397 Buy
97 Buy
18,525 Buy
TP
(INR)
2,762
3,325
339
1,484
4,525
477
119
22,935
903
176
975
24,659
P/E (x)
FY17E
FY18E
16.8
15.0
16.3
13.4
20.9
17.5
17.7
14.7
19.7
16.1
10.0
7.6
14.6
11.4
31.0
22.4
21.2
18.8
23.8
41.9
16.4
16.0
19.6
31.3
EV/EBITDA (x)
FY17E
FY18E
11.3
9.7
10.4
8.8
12.6
10.6
14.1
12.2
9.9
8.4
3.7
3.1
8.2
6.6
18.1
14.4
11.7
12.0
14.7
27.1
9.6
10.2
12.3
22.8
RoE (%)
FY17E
FY18E
33.0
32.6
40.9
40.8
30.7
29.1
15.5
15.9
19.2
20.3
16.4
18.3
30.8
31.1
39.8
40.3
21.0
14.4
25.9
18.4
23.1
15.0
25.4
21.2
RoCE (%)
FY17E
FY18E
31.8
31.5
39.9
40.0
31.8
30.8
17.3
18.0
25.8
27.2
15.4
16.8
22.0
23.9
31.8
34.0
14.0
19.4
24.5
26.3
16.6
19.9
24.3
28.3
25 May 2016
4
 Motilal Oswal Financial Services
Bosch Ltd
Bosch| Key Operating Indicators
Exhibit 10: Sales and Sales Growth
38.9
22.2
6.0
1.1
10.4
9.8
53
CY11
52
CY12
Net Sales (INR b)
Growth (%)
22.7
11.8
Exhibit 11: Segment Mix
Fuel Injection Equipment
Starters & Generators
Others
10
6
7
23
10
7
8
23
12
7
11
23
47
CY13
13
8
12
23
44
CY14
15
8
12
26
39
FY15
(15m)
Injectors & Nozzles
Power tools
16
8
11
27
39
FY16
15
7
10
28
40
17
8
2
30
43
FY17E FY18E
Exhibit 12: Gross Margins v/s EBITDA margins
Gross Margins (%)
48
47
46
45
44
CY11 CY12 CY13 CY14 FY15 FY16 FY17E FY18E
(15m)
EBITDA Margins (%)
24.0
18.0
12.0
6.0
0.0
Exhibit 13: Dividend payout to remain stable
43.9
Dividend Payout (%)
22.9
17.1
24.8
24.0
25.8
25.0
25.0
CY11
CY12
CY13
CY14
FY15
(15m)
FY16
FY17E FY18E
Exhibit 14: FCF and Net Cash
CFO (INR b)
Capex (INR b)
FCF (INR b)
Exhibit 15: Cash would be over 60% of the capital employed
Net Cash (as % of Cap Employed)
61
45
48
63
67
59
62
53
CY11
CY12
CY13
CY14
FY15
(15m)
FY16 FY17E FY18E
Exhibit 16: Over 30% EPS CAGR (FY15-18E)…
EPS (INR)
45.4
30.7
(8.2)
(14.6)
(14.3)
65.2
Growth (%)
31.8
33.8
Exhibit 17: …coupled with improvement in RoIC…
36.7
29.9
23.0
RoIC (%)
RoE (%)
30.4
19.9
26.4
15.9
30.9
18.4
36.1
21.2
25.4 26.7
18.6 19.8
13.8
Source: Company, MOSL
25 May 2016
5
 Motilal Oswal Financial Services
Bosch Ltd
Operating metrics
Exhibit 18: Snapshot of Revenue Model
(INR m)
Fuel Injection Equipment
Growth (%)
% of Net Revenues
Injectors, Nozzles and Nozzle holders
Growth (%)
% of Net Revenues
SMG & Auto Electricals
Growth (%)
% of Net Revenues
Portable Electric Power tools
Growth (%)
% of Net Revenues
Others
Growth (%)
% of Net Revenues
Total Gross sale of product
Growth (%)
Less: Excise Duty
Excise Duty (% of Net Sales)
Net Sales
Growth (%)
Service Income
Growth (%)
% of Net Sales
Total Other Operating Income
Net Revenues
Growth (%)
- of which Exports
Growth (%)
% of net revenues
EBITDA
- EBITDA Margins (%)
PAT
EPS (INR/Share)
Core EPS (INR/Share)
CY10
37,519
46
56
16,333
45
24
4,924
32
7
4,555
29
7
7,390
22
11
70,722
41
4,417
7
66,305
40
512
-14
1
0
66,817
39
8,461
45
13
10,531
16
8,589
274
237
CY11
44,183
18
54
19,839
21
24
6,731
37
8
5,660
24
7
8,919
21
11
85,332
21
6,037
8
79,295
20
677
32
1
1,686
81,658
22
10,344
22
13
15,119
19
11,227
358
293
CY12
42,960
-3
50
21,423
8
25
9,629
43
11
6,356
12
7
10,954
23
13
91,322
7
7,150
8
84,172
6
1,052
55
1
1,367
86,591
6
9,402
-9
11
13,495
16
9,583
305
233
CY13
40,396
-6
46
21,270
-1
24
10,916
13
12
7,146
12
8
12,372
13
14
92,100
1
6,949
8
85,151
1
1,346
28
2
1,070
87,567
1
10,578
13
12
12,277
14
8,213
262
193
15MFY15
49,297
-2
41
32,601
23
27
14,448
6
12
9,951
11
8
19,297
25
16
125,594
9
8,180
7
117,414
10
2,000
19
2
1,441
120,855
10
14,625
11
12
19,813
16
13,376
426
315
FY16
43,935
11
41
29,795
14
28
11,892
3
11
8,630
8
8
17,589
14
17
111,841
11
9,235
9
102,607
9
1,550
-3
2
1,971
106,128
10
13,339
14
13
18,756
18
12,459
397
328
FY17E
FY18E
55,191
66,592
26
21
42
46
38,361
46,416
29
21
29
32
13,230
3,531
11
-73
10
2
10,086
11,790
17
17
8
8
21,165
25,851
20
22
16
18
138,033
154,180
23
12
11,397
12,730
9
9
126,635
141,450
23
12
2,026
2,405
31
19
2
2
1,536
1,717
130,198
145,572
23
12
16,463
18,388
23
12
13
13
24,351
28,379
19
19
16,419
21,965
523
700
425
576
Source: Company, MOSL
25 May 2016
6
 Motilal Oswal Financial Services
Bosch Ltd
Financials and Valuations
Income Statement
Y/E Mar
Net Sales
Change (%)
EBITDA
EBITDA Margin (%)
Depreciation
EBIT
Interest
Other Income
Extraordinary items
PBT
Tax
Tax Rate (%)
Min. Int. & Assoc. Share
Reported PAT
Adjusted PAT
Change (%)
2010
66,817
38.9
10,531
15.8
2,540
7,991
39
4,076
0
12,028
3,439
28.6
0
8,589
8,589
45.4
2010
314
40,666
40,980
2,764
-2,182
41,562
30,238
25,878
4,360
2,242
16,073
37,521
8,093
7,210
13,259
8,960
18,634
13,371
5,263
18,887
41,562
2011
81,658
22.2
15,119
18.5
2,578
12,541
4
3,203
0
15,740
4,513
28.7
0
11,227
11,227
30.7
2011
314
46,970
47,284
3,071
-2,276
48,079
33,584
27,667
5,917
3,207
16,347
43,563
11,831
8,959
9,515
13,258
20,955
15,272
5,683
22,608
48,079
2012
86,591
6.0
13,495
15.6
3,670
9,825
55
3,692
0
13,462
3,879
28.8
0
9,583
9,583
-14.6
2012
314
55,419
55,733
2,304
-2,552
55,485
39,414
30,781
8,633
4,083
15,286
48,468
10,957
10,270
14,872
12,369
20,985
13,736
7,249
27,483
55,485
2013
87,567
1.1
12,277
14.0
3,842
8,435
29
3,526
0
11,932
3,719
31.2
0
8,213
8,213
-14.3
2013
314
62,629
62,943
1,831
-2,989
61,785
43,086
33,705
9,381
4,568
21,851
50,423
12,072
10,735
14,415
13,201
24,438
17,189
7,249
25,985
61,785
2015
120,855
38.0
19,813
16.4
5,484
14,329
143
5,653
-280
19,558
6,182
31.6
0
13,376
13,568
65.2
2015
314
73,156
73,470
1,122
-4,172
70,420
47,908
38,232
9,676
2,760
28,896
58,805
12,762
11,877
18,960
15,206
29,716
16,544
13,172
29,089
70,420
2016
106,128
-12.2
18,756
17.7
3,950
14,806
42
3,826
0
18,591
6,132
33.0
0
12,459
12,459
-8.2
2016
314
82,575
82,889
191
-4,528
78,552
53,551
42,182
11,369
1,500
37,397
60,243
11,991
13,162
18,315
16,776
31,958
18,018
13,940
28,286
78,552
2017E
130,198
22.7
24,351
18.7
4,707
19,644
15
3,826
0
23,455
7,037
30.0
0
16,419
16,419
31.8
2017E
314
94,889
95,203
191
-4,528
90,866
61,251
46,889
14,362
1,500
28,896
79,140
14,711
16,147
27,702
20,580
33,032
19,092
13,940
46,108
90,866
(INR Million)
2018E
145,572
11.8
28,379
19.5
4,988
23,391
15
5,912
0
29,287
7,322
25.0
0
21,965
21,965
33.8
Balance Sheet
Y/E Mar
Share Capital
Reserves
Net Worth
Debt
Deferred Tax
Total Capital Employed
Gross Fixed Assets
Less: Acc Depreciation
Net Fixed Assets
Capital WIP
Investments
Current Assets
Inventory
Debtors
Cash & Bank
Loans & Adv, Others
Curr Liabs & Provns
Curr. Liabilities
Provisions
Net Current Assets
Total Assets
(INR Million)
2018E
314
111,363
111,677
191
-4,528
107,340
63,451
47,577
15,874
1,500
28,896
96,214
15,953
17,548
40,877
21,836
35,144
21,204
13,940
61,070
107,340
25 May 2016
7
 Motilal Oswal Financial Services
Bosch Ltd
Financials and Valuations
Ratios
Y/E Mar
Basic (INR)
EPS
Cash EPS
Book Value
DPS
Payout (incl. Div. Tax.)
Valuation(x)
P/E
Cash P/E
Price / Book Value
EV/Sales
EV/EBITDA
Dividend Yield (%)
Profitability Ratios (%)
RoE
RoCE
RoIC
Turnover Ratios (%)
Asset Turnover (x)
Debtors (No. of Days)
Inventory (No. of Days)
Creditors (No. of Days)
2010
273.5
354.4
1305.1
40.0
17.1
2011
357.5
439.6
1505.9
135.0
43.9
2012
305.2
422.1
1774.9
60.0
22.9
2013
261.6
383.9
2004.6
55.0
24.8
2015
432.1
606.8
2339.8
85.0
24.0
50.7
36.1
9.4
5.5
33.8
0.4
23.0
30.0
29.9
25.4
33.5
36.7
18.6
24.9
26.7
13.8
19.5
19.8
19.9
28.7
30.4
2016
396.8
522.6
2639.8
85.0
25.8
55.2
41.9
8.3
6.3
35.7
0.4
15.9
23.6
26.4
2017E
522.9
672.8
3031.9
108.6
25.0
41.9
32.6
7.2
5.1
27.1
0.5
18.4
26.3
30.9
2018E
699.5
858.4
3556.6
145.3
25.0
31.3
25.5
6.2
4.4
22.8
0.7
21.2
28.3
36.1
1.5
37
44
54
1.6
37
53
46
1.5
40
46
39
1.4
41
50
44
1.6
34
39
37
1.3
42
41
45
1.4
42
41
37
1.3
40
40
36
Cash Flow Statement
Y/E Mar
Adjusted EBITDA
Non cash opr. exp (inc)
(Inc)/Dec in Wkg. Cap.
Tax Paid
Other operating activities
CF from Op. Activity
(Inc)/Dec in FA & CWIP
Free cash flows
(Pur)/Sale of Invt
Others
CF from Inv. Activity
Inc/(Dec) in Net Worth
Inc / (Dec) in Debt
Interest Paid
Divd Paid (incl Tax) & Others
CF from Fin. Activity
Inc/(Dec) in Cash
Add: Opening Balance
Closing Balance
2010
10,531
2,893
-141
-4,027
-397
8,859
-3,006
5,854
-1,534
-525
-5,064
0
-79
-36
-1,099
-1,214
2,581
10,678
13,259
2011
15,119
1,356
-5,996
-4,682
-1,351
4,446
-5,376
-930
943
502
-3,931
0
308
-5
-4,562
-4,259
-3,744
13,259
9,515
2012
13,495
1,572
-1,284
-3,631
-1,440
8,712
-6,138
2,574
2,114
2,231
-1,793
0
289
-25
-1,826
-1,562
5,357
9,515
14,872
2013
12,277
1,788
1,552
-4,258
-789
10,570
-5,251
5,319
-5,732
2,521
-8,462
0
-473
-28
-1,878
-2,379
-271
1,810
1,539
2015
19,813
1,756
1,316
-6,911
-2,032
13,942
-4,960
8,982
-16,295
9,460
-11,795
0
-709
-86
-1,587
-2,382
-235
1,539
1,304
2016
18,756
0
158
-6,132
0
12,783
-4,383
8,400
-8,502
3,826
-9,058
0
-931
-42
-3,212
-4,185
-461
1,304
843
2017E
24,351
0
-8,435
-7,037
0
8,879
-7,700
1,179
8,502
3,826
4,628
0
0
-15
-4,105
-4,120
9,387
843
10,230
(INR Million)
2018E
28,379
0
-1,788
-7,322
0
19,269
-2,200
17,069
0
5,912
3,712
0
0
-15
-5,491
-5,507
17,474
10,230
27,705
25 May 2016
8
 Motilal Oswal Financial Services
Bosch Ltd
Corporate profile
Company description
Exhibit 1: Sensex rebased
BOS is the best proxy on the Indian automotive
industry, addressing over 40% of the Indian auto
component industry. The company has several
cyclical and structural drivers in place to drive over
20% revenue CAGR over the next 5-6 years. BOS’s
Aftermarket business network is India’s largest
aftermarket network, offering the widest product
portfolio and having the largest independent
service network. Unique industry positioning,
technology focus enables high growth visibility as
reflected in ~34% FY15-18E EPS CAGR.
Exhibit 2: Shareholding pattern (%)
Dec-15
Promoter
DII
FII
Others
71.2
11.5
7.7
9.6
Sep-15
71.2
10.9
8.4
9.5
Dec-14
71.2
11.8
6.9
10.2
Source: Capitaline
Source: MOSL/Bloomberg
Exhibit 3: Top holders
Holder Name
General Insurance Corporation Of India
The New India Assurance Company Limited
Aberdeen Global Indian Equity Ltd.
Life Insurance Corporation Of India
NA
% Holding
3.1
2.8
1.8
1.1
0.0
Source: Capitaline
Note: FII Includes depository receipts
Exhibit 4: Top management
Name
V K Viswanathan
Steffen Berns
Soumitra Bhattacharya
S Karthik
Designation
Chairman
Managing Director
Joint Managing Director
Company Secretary
Exhibit 5: Directors
Name
Bernhard Steinruecke
Renu S Karnad
Peter Tyroller
Name
Prasad Chandran
Bhaskar Bhat
Andreas Wolf
Source: Capitaline
*Independent
Exhibit 6: Auditors
Name
Price Waterhouse & Co LLP
Rao Murthy & Associates
Sachin Bhagwat
Type
Statutory
Cost Auditor
Secretarial Audit
Exhibit 7: MOSL forecast v/s consensus
EPS
(INR)
FY17
FY18
MOSL
forecast
522.9
699.5
Consensus
forecast
500.2
645.1
Variation
(%)
4.5
8.4
Source: Bloomberg
Source: Capitaline
25 May 2016
9
 Motilal Oswal Financial Services
Disclosures
Bosch
it and/or
This document has been prepared by Motilal Oswal Securities Limited (hereinafter referred to as Most) to provide information about the company (ies) and/sector(s), if any, covered in the report and may be distributed by
Ltd
its
affiliated company(ies). This report is for personal information of the selected recipient/s and does not construe to be any investment, legal or taxation advice to you. This research report does not constitute an offer, invitation or
inducement to invest in securities or other investments and Motilal Oswal Securities Limited (hereinafter referred as MOSt) is not soliciting any action based upon it. This report is not for public distribution and has been furnished to
you solely for your general information and should not be reproduced or redistributed to any other person in any form. This report does not constitute a personal recommendation or take into account the particular investment
objectives, financial situations, or needs of individual clients. Before acting on any advice or recommendation in this material, investors should consider whether it is suitable for their particular circumstances and, if necessary, seek
professional advice. The price and value of the investments referred to in this material and the income from them may go down as well as up, and investors may realize losses on any investments. Past performance is not a guide for
future performance, future returns are not guaranteed and a loss of original capital may occur.
MOSt and its affiliates are a full-service, integrated investment banking, investment management, brokerage and financing group. We and our affiliates have investment banking and other business relationships with a some
companies covered by our Research Department. Our research professionals may provide input into our investment banking and other business selection processes. Investors should assume that MOSt and/or its affiliates are
seeking or will seek investment banking or other business from the company or companies that are the subject of this material and that the research professionals who were involved in preparing this material may educate investors
on investments in such business . The research professionals responsible for the preparation of this document may interact with trading desk personnel, sales personnel and other parties for the purpose of gathering, applying and
interpreting information. Our research professionals are paid on twin parameters of performance & profitability of MOSt.
MOSt generally prohibits its analysts, persons reporting to analysts, and members of their households from maintaining a financial interest in the securities or derivatives of any companies that the analysts cover. Additionally, MOSt
generally prohibits its analysts and persons reporting to analysts from serving as an officer, director, or advisory board member of any companies that the analysts cover. Our salespeople, traders, and other professionals or affiliates
may provide oral or written market commentary or trading strategies to our clients that reflect opinions that are contrary to the opinions expressed herein, and our proprietary trading and investing businesses may make investment
decisions that are inconsistent with the recommendations expressed herein. In reviewing these materials, you should be aware that any or all of the foregoing among other things, may give rise to real or potential conflicts of interest.
MOSt and its affiliated company(ies), their directors and employees and their relatives may; (a) from time to time, have a long or short position in, act as principal in, and buy or sell the securities or derivatives thereof of companies
mentioned herein. (b) be engaged in any other transaction involving such securities and earn brokerage or other compensation or act as a market maker in the financial instruments of the company(ies) discussed herein or act as an
advisor or lender/borrower to such company(ies) or may have any other potential conflict of interests with respect to any recommendation and other related information and opinions.; however the same shall have no bearing
whatsoever on the specific recommendations made by the analyst(s), as the recommendations made by the analyst(s) are completely independent of the views of the affiliates of MOSt even though there might exist an inherent
conflict of interest in some of the stocks mentioned in the research report Reports based on technical and derivative analysis center on studying charts company's price movement, outstanding positions and trading volume, as
opposed to focusing on a company's fundamentals and, as such, may not match with a report on a company's fundamental analysis. In addition MOST has different business segments / Divisions with independent research
separated by Chinese walls catering to different set of customers having various objectives, risk profiles, investment horizon, etc, and therefore may at times have different contrary views on stocks sectors and markets.
Unauthorized disclosure, use, dissemination or copying (either whole or partial) of this information, is prohibited. The person accessing this information specifically agrees to exempt MOSt or any of its affiliates or employees from,
any and all responsibility/liability arising from such misuse and agrees not to hold MOSt or any of its affiliates or employees responsible for any such misuse and further agrees to hold MOSt or any of its affiliates or employees free
and harmless from all losses, costs, damages, expenses that may be suffered by the person accessing this information due to any errors and delays. The information contained herein is based on publicly available data or other
sources believed to be reliable. Any statements contained in this report attributed to a third party represent MOSt’s interpretation of the data, information and/or opinions provided by that third party either publicly or through a
subscription service, and such use and interpretation have not been reviewed by the third party. This Report is not intended to be a complete statement or summary of the securities, markets or developments referred to in the
document. While we would endeavor to update the information herein on reasonable basis, MOSt and/or its affiliates are under no obligation to update the information. Also there may be regulatory, compliance, or other reasons that
may prevent MOSt and/or its affiliates from doing so. MOSt or any of its affiliates or employees shall not be in any way responsible and liable for any loss or damage that may arise to any person from any inadvertent error in the
information contained in this report. MOSt or any of its affiliates or employees do not provide, at any time, any express or implied warranty of any kind, regarding any matter pertaining to this report, including without limitation the
implied warranties of merchantability, fitness for a particular purpose, and non-infringement. The recipients of this report should rely on their own investigations.
This report is intended for distribution to institutional investors. Recipients who are not institutional investors should seek advice of their independent financial advisor prior to taking any investment decision based on this report or for
any necessary explanation of its contents.
Most and it’s associates may have managed or co-managed public offering of securities, may have received compensation for investment banking or merchant banking or brokerage services, may have received any compensation
for products or services other than investment banking or merchant banking or brokerage services from the subject company in the past 12 months.
Most and it’s associates have not received any compensation or other benefits from the subject company or third party in connection with the research report.
Subject Company may have been a client of Most or its associates during twelve months preceding the date of distribution of the research report
MOSt and/or its affiliates and/or employees may have interests/positions, financial or otherwise of over 1 % at the end of the month immediately preceding the date of publication of the research in the securities mentioned in this
report. To enhance transparency, MOSt has incorporated a Disclosure of Interest Statement in this document. This should, however, not be treated as endorsement of the views expressed in the report.
Motilal Oswal Securities Limited is registered as a Research Analyst under SEBI (Research Analyst) Regulations, 2014. SEBI Reg. No. INH000000412
Pending Regulatory inspections against Motilal Oswal Securities Limited:
SEBI pursuant to a complaint from client Shri C.R. Mohanraj alleging unauthorized trading, issued a letter dated 29th April 2014 to MOSL notifying appointment of an Adjudicating Officer as per SEBI regulations to hold inquiry and
adjudge violation of SEBI Regulations; MOSL replied to the Show Cause Notice whereby SEBI granted us an opportunity of Inspection of Documents. Since all the documents requested by us were not covered we have requested to
SEBI vide our letter dated June 23, 2015 to provide pending list of documents for inspection.
List of associate companies of Motilal Oswal Securities Limited -Click
here to access detailed report
Analyst Certification
The views expressed in this research report accurately reflect the personal views of the analyst(s) about the subject securities or issues, and no part of the compensation of the research analyst(s) was, is, or will be directly or
indirectly related to the specific recommendations and views expressed by research analyst(s) in this report. The research analysts, strategists, or research associates principally responsible for preparation of MOSt research receive
compensation based upon various factors, including quality of research, investor client feedback, stock picking, competitive factors and firm revenues
Disclosure of Interest Statement
Analyst ownership of the stock
Served as an officer, director or employee
BOSCH
No
No
A graph of daily closing prices of securities is available at www.nseindia.com and http://economictimes.indiatimes.com/markets/stocks/stock-quotes
Regional Disclosures (outside India)
This report is not directed or intended for distribution to or use by any person or entity resident in a state, country or any jurisdiction, where such distribution, publication, availability or use would be contrary to law, regulation or which
would subject MOSt & its group companies to registration or licensing requirements within such jurisdictions.
For Hong Kong:
This report is distributed in Hong Kong by Motilal Oswal capital Markets (Hong Kong) Private Limited, a licensed corporation (CE AYY-301) licensed and regulated by the Hong Kong Securities and Futures
Commission (SFC) pursuant to the Securities and Futures Ordinance (Chapter 571 of the Laws of Hong Kong) “SFO”. As per SEBI (Research Analyst Regulations) 2014 Motilal Oswal Securities (SEBI Reg No. INH000000412) has
an agreement with Motilal Oswal capital Markets (Hong Kong) Private Limited for distribution of research report in Kong Kong. This report is intended for distribution only to “Professional Investors” as defined in Part I of Schedule 1 to
SFO. Any investment or investment activity to which this document relates is only available to professional investor and will be engaged only with professional investors.” Nothing here is an offer or solicitation of these securities,
products and services in any jurisdiction where their offer or sale is not qualified or exempt from registration. The Indian Analyst(s) who compile this report is/are not located in Hong Kong & are not conducting Research Analysis in
Hong Kong.
For U.S
Motilal Oswal Securities Limited (MOSL) is not a registered broker - dealer under the U.S. Securities Exchange Act of 1934, as amended (the"1934 act") and under applicable state laws in the United States. In addition MOSL is not a
registered investment adviser under the U.S. Investment Advisers Act of 1940, as amended (the "Advisers Act" and together with the 1934 Act, the "Acts), and under applicable state laws in the United States. Accordingly, in the
absence of specific exemption under the Acts, any brokerage and investment services provided by MOSL, including the products and services described herein are not available to or intended for U.S. persons.
This report is intended for distribution only to "Major Institutional Investors" as defined by Rule 15a-6(b)(4) of the Exchange Act and interpretations thereof by SEC (henceforth referred to as "major institutional investors"). This
document must not be acted on or relied on by persons who are not major institutional investors. Any investment or investment activity to which this document relates is only available to major institutional investors and will be
engaged in only with major institutional investors. In reliance on the exemption from registration provided by Rule 15a-6 of the U.S. Securities Exchange Act of 1934, as amended (the "Exchange Act") and interpretations thereof by
the U.S. Securities and Exchange Commission ("SEC") in order to conduct business with Institutional Investors based in the U.S., MOSL has entered into a chaperoning agreement with a U.S. registered broker-dealer, Motilal Oswal
Securities International Private Limited. ("MOSIPL"). Any business interaction pursuant to this report will have to be executed within the provisions of this chaperoning agreement.
The Research Analysts contributing to the report may not be registered /qualified as research analyst with FINRA. Such research analyst may not be associated persons of the U.S. registered broker-dealer, MOSIPL, and therefore,
may not be subject to NASD rule 2711 and NYSE Rule 472 restrictions on communication with a subject company, public appearances and trading securities held by a research analyst account.
For Singapore
Motilal Oswal Capital Markets Singapore Pte Limited is acting as an exempt financial advisor under section 23(1)(f) of the Financial Advisers Act(FAA) read with regulation 17(1)(d) of the Financial Advisors Regulations and is a
subsidiary of Motilal Oswal Securities Limited in India. This research is distributed in Singapore by Motilal Oswal Capital Markets Singapore Pte Limited and it is only directed in Singapore to accredited investors, as defined in the
Financial Advisers Regulations and the Securities and Futures Act (Chapter 289), as amended from time to time.
In respect of any matter arising from or in connection with the research you could contact the following representatives of Motilal Oswal Capital Markets Singapore Pte Limited:
Varun Kumar
Varun.kumar@motilaloswal.com
Contact : (+65) 68189232
Office Address:21 (Suite 31),16 Collyer Quay,Singapore 04931
Kadambari Balachandran
kadambari.balachandran@motilaloswal.com
(+65) 68189233 / 65249115
25 May 2016
Motilal Oswal Tower, Level 9, Sayani Road, Prabhadevi, Mumbai 400 025
Phone: +91 22 3982 5500 E-mail: reports@motilaloswal.com
Motilal Oswal Securities Ltd
10