Amara Raja Batteries
BSE SENSEX
25,881
Bloomberg
Equity Shares (m)
M.Cap.(INRb)/(USDb)
52-Week Range (INR)
1, 6, 12 Rel. Per (%)
Avg Val, INR m
Free float (%)
S&P CNX
7,935
AMRJ IN
170.8
145.3 / 2.2
1,132/773
-8/-2/3
275.3 / 0.3
47.9
25 May 2016
4QFY16 Results Update | Sector: Automobiles
CMP: INR851
TP: INR975(+15%)
Buy
Below est; Sales growth moderates, higher RM and other expenses leads
to 8 quarter low EBITDA margins; Downgrade EPS
Financials & Valuations (INR b)
Y/E Mar
2016 2017E 2018E
Net Sales
46.9
54.5
63.7
EBITDA
8.2
9.7
11.4
PAT
4.9
6.1
7.4
EPS (INR)
28.7
35.7
43.3
Gr. (%)
17.7
24.6
21.4
BV/Sh (INR)
123.0 152.8 189.1
RoE (%)
25.8
25.9
25.4
RoCE (%)
24.2
24.5
24.3
P/E (x)
29.7
23.8
19.6
P/BV (x)
6.9
5.6
4.5
Estimate change
TP change
Rating change
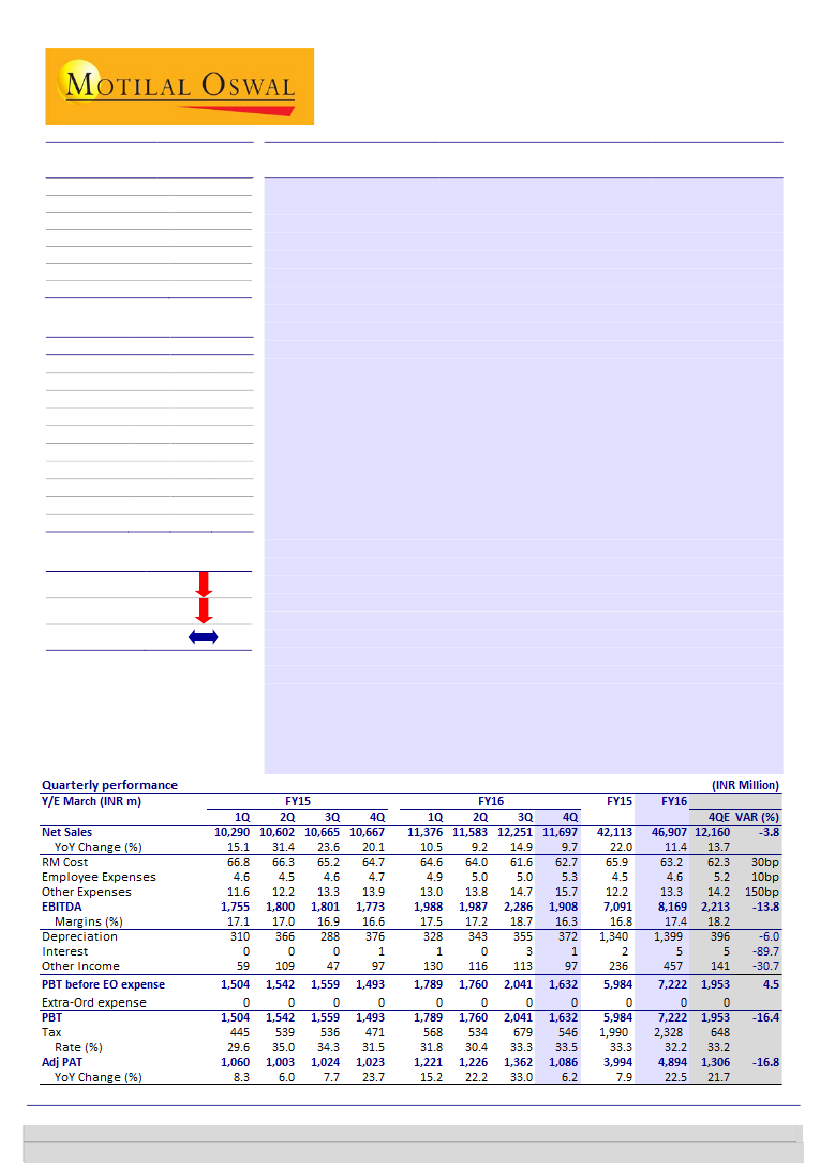
Net sales grew by 10% YoY (-4.5% QoQ) to INR11.7b (in line with our est.), with
the YoY growth being driven by a broad-based performance across segments.
EBITDA margin declined by 30bp YoY (-240bp QoQ) to 16.3%, translating into
EBITDA growth of ~7.6% YoY (-17% QoQ).
Raw material costs increased by 110bp QoQ (-200bp YoY) to 62.7%, as lead
costs hardened on a QoQ basis, but declined by ~12% YoY (spot prices with a
lag of one quarter). Other expenses were also higher by ~100bp QoQ (+180bp
YoY), which was most likely due to overheads incurred for recently
commissioned capacities and higher marketing spend.
Adjusted PAT grew by 6.2% YoY to INR~1.1b (vs. our estimate of ~INR1.3b).
At the end of 4QFY16, working capital rose by ~5 days, driven by an increase of
11 days in inventory to 47 days.
Free
cash flow came in at a negative ~INR0.5b due to higher capex of ~INR5.5b,
resulting in net cash declining to ~INR939m (as against ~INR1.64b in FY15).
Capacity expansion plan for 2W batteries:
The company is expanding its 2W
battery capacity in four phases, staggered over a period of four years, from the
current 11m units per annum to 25m units per annum, with the first phase
comprising of three lines adding a capacity of 4m units per annum. The
company had earlier also announced expansion of its 4W battery capacity from
8.25m units per annum to 11m units per annum.
Takeaways from press release:
a) The aftermarket segment continued to
witness high growth, driven by new products, network expansion and
marketing support b) The auto OEM business also recorded growth due to
supply to new platforms and recovery in PV volume c) Auto exports growth was
driven by higher penetration in focused markets d) The auto segment’s market
share improved across segments e) The company has strengthened its core
management team, with a focus on making its management systems and
processes more robust.
Valuation and view:
We have lowered our EPS estimate for by 7-8% in order to
factor in the weaker sales growth and higher other expenses. The stock trades at
23.8x/19.6x FY17/18 EPS. Maintain
Buy
with a TP of ~INR975 (~22.5x FY18E EPS).
Investors are advised to refer through important disclosures made at the last page of the Research Report.
Motilal Oswal research is available on www.motilaloswal.com/Institutional-Equities, Bloomberg, Thomson Reuters, Factset and S&P Capital.
Jinesh Gandhi
(Jinesh@MotilalOswal.com); +91 22 3982 5416
Aditya Vora
(Aditya.Vora@MotilalOswal.com); +91 22 3078 4701
 Motilal Oswal Financial Services
Amara Raja Batteries
Exhibit 1: Net sales grew ~9.7%
Net sales (INR m)
28.4
19.6
12 13.7
10.5
15.1
31.4
23.6
20.1
10.5
9.2
14.9
9.7
Growth YoY (%)
Exhibit 2: Gross margins down 110bp QoQ as RM cost rises
Gross margin (%)
Source: Company, MOSL
Exhibit 3: EBITDA margin at 16.3 % (lowest in 8 qtrs.)
EBITDA
EBITDA (%)
Exhibit 4: Muted PAT growth at 6% YoY
1,600
1,200
800
400
0
2
29
PAT (INR m)
39
31
17
8
6
8
24
15
6
22
Growth YoY (%)
33
Source: Company, MOSL
Exhibit 5: Spot lead prices are ~6% higher QoQ in 4QFY16, impact of which will be reflected
with a quarter lag in 1QFY17
150,000
135,000
120,000
105,000
90,000
INR/Ton
Source: Company, MOSL
Valuation and view
Industry structure remains duopoly, but AMRJ is a strong No. 2:
While the
industry structure remains largely duopoly, AMRJ has emerged as a formidable
challenger to leader EXIDE, with market leadership in telecom (46% share) and
UPS (32%) segments, and a fast gaining share in Autos. Over FY04-15, AMRJ
clocked a CAGR of 34% and 68% in net sales and PAT respectively, far exceeding
EXID’s 20% CAGR each in net sales and PAT. This has been driven through a
combination of technological innovations (first to introduce maintenance-free,
factory charged, extended warranty batteries), witty advertising and unique
2
25 May 2016
 Motilal Oswal Financial Services
Amara Raja Batteries
distribution model (franchisee based) supported with operational efficiency-led
competitive pricing.
AMRJ – gearing up to be leader:
AMRJ is gearing up to be a leader through i)
consolidating in existing areas, ii) entering new business opportunities within
battery space, mainly home UPS, Solar and Motive Power and iii) aided by
capacity and network expansion. Company aims to increase its share in the OEM
and replacement segments to 40% (from current 30%) and 30% (from current
24%) respectively over the medium term. In the telecom segment, AMRJ
expects to maintain its market share at current levels (60% currently).
Strong ~23% EPS CAGR over FY16-FY18E, robust return ratios and FCF; Buy:
We
had lowered our EPS estimates by 7-8%, factoring in for weaker sales growth
and higher other expenses. FY16 is inflection year for AMRJ—with new
capacities driving top-line (~17% CAGR over FY16-18E) and benign lead prices
driving margins (+50bp by FY18), translating into ~23% EPS CAGR (FY16-18E).
Stable competitive environment, significant FCF generation (~INR4b over FY16-
18) and stable RoE of 25% —coupled with potential shift from unorganized to
organized players due to GST would continue to drive stock re-rating. The stock
trades at 23.8x/19.6x FY17/18 EPS. Maintain Buy with a TP of ~INR975 (~22.5x
FY18E EPS).
Exhibit 6: Revised estimates
(INR M)
Net Sales
EBITDA (%)
Net Profit
EPS (INR)
Rev
54,534
17.9
6,098
35.7
FY17E
Old
55,992
18.3
6,686
39.1
Chg (%)
-2.6
-40bp
-8.8
-8.8
Rev
63,748
17.9
7,404
43.3
FY18E
Old
65,654
18.4
7,986
46.8
Chg (%)
-2.9
-50bp
-7.3
-7.3
Source: MOSL
Exhibit 7: Valuations trading above historical average, reflecting improving fundamentals
35
28
21
14
7
0
11.9
10.5
P/E (x)
5 Yrs Avg(x)
17.0
15 Yrs Avg(x)
10 Yrs Avg(x)
23.0
8.0
6.0
4.0
2.0
0.0
4.2
2.9
2.1
5.4
P/B (x)
5 Yrs Avg(x)
15 Yrs Avg(x)
10 Yrs Avg(x)
Source: MOSL
Source: MOSL
25 May 2016
3
 Motilal Oswal Financial Services
Amara Raja Batteries
Exhibit 8: Comparative valuation
Auto OEM's
Bajaj Auto
Hero MotoCorp
TVS Motor
M&M
Maruti Suzuki
Tata Motors
Ashok Leyland
Eicher Motors
Auto Ancillaries
Bharat Forge
742 Buy
Exide Industries
157 Buy
Amara Raja Batt. 851 Buy
BOSCH
21,914 Buy
CMP * Rating
(INR)
2,479 Buy
2,929 Buy
296 Buy
1,312 Neutral
4,054 Buy
397 Buy
97 Buy
18,525 Buy
TP
(INR)
2,762
3,325
339
1,484
4,525
477
119
22,935
903
176
975
24,659
P/E (x)
FY17E
FY18E
16.8
15.0
16.3
13.4
20.9
17.5
17.7
14.7
19.7
16.1
10.0
7.6
14.6
11.4
31.0
22.4
21.2
18.8
23.8
41.9
16.4
16.0
19.6
31.3
EV/EBITDA (x)
FY17E
FY18E
11.3
9.7
10.4
8.8
12.6
10.6
14.1
12.2
9.9
8.4
3.7
3.1
8.2
6.6
18.1
14.4
11.7
12.0
14.7
27.1
9.6
10.2
12.3
22.8
RoE (%)
FY17E
FY18E
33.0
32.6
40.9
40.8
30.7
29.1
15.5
15.9
19.2
20.3
16.4
18.3
30.8
31.1
39.8
40.3
21.0
14.4
25.9
18.4
23.1
15.0
25.4
21.2
RoCE (%)
FY17E
FY18E
31.8
31.5
39.9
40.0
31.8
30.8
17.3
18.0
25.8
27.2
15.4
16.8
22.0
23.9
31.8
34.0
14.0
19.4
24.5
26.3
16.6
19.9
24.3
28.3
25 May 2016
4
 Motilal Oswal Financial Services
Amara Raja Batteries
Amara Raja| Story in charts: Robust ~24% EPS CAGR expected over FY16-18E
Exhibit 9: Capacity for various batteries
4W (mn units)
MVRLA (mn units)
2W (mn units)
LVRLA (billion. Amph)
8.4
6
3.5
2.25
1.5
4.5
3.5
1.5
4.7
4
1.65
16.0
3
3
11.4
8.25 8.4
Exhibit 10: Expect net sales to register a CAGR of ~18% over
FY16-18E
Net sales (INR m)
34.3
25.2
22.5
16.3
16.9
Growth (%)
FY11
FY12
FY13
FY14
FY15
FY12
FY13
FY14
FY15
FY16
FY17E
FY18E
Source: Company, MOSL
Exhibit 11: Expect margins to sustain and improve to 19% by
FY18E
EBITDA (INR m)
15.2
16.3
16.8
EBITDA margins (%)
17.4
17.9
17.9
Exhibit 12: Strong EPS growth of ~27% over FY16-18E
45.2
36.2
26.3
12.3
12.6
17.2
FY13
21.7
FY14
24.3
FY15
17.7
24.6
21.4
EPS
Growth (%)
14.4
28.7
FY16
35.7
FY17E
43.3
FY18E
FY12
FY13
FY14
FY15
FY16
FY17E
FY18E
FY12
Source: Company, MOSL
Exhibit 13: FCF to turn positive in FY16E-18E
CFO
Capex
FCF
Exhibit 14: Return ratios to remain strong
RoCE (%)
25.5
28.0
28.0
25.3
RoE (%)
24.2
24.5
24.3
-809
-1,463
-434
-3,986
-5,454
FY16
-5,000
FY17E
-5,000
FY18E
29.3
31.1
30.6
27.2
25.8
25.9
25.4
FY12
FY13
FY14
FY15
FY12
FY13
FY14
FY15
FY16
FY17E
FY18E
Source: Company, MOSL
25 May 2016
5
 Motilal Oswal Financial Services
Amara Raja Batteries
Financials and Valuations
Income Statement
Y/E Mar
Net Sales
Change (%)
EBITDA
EBITDA Margin (%)
Depreciation
EBIT
Interest
Other Income
Extraordinary items
PBT
Tax
Tax Rate (%)
Min. Int. & Assoc. Share
Reported PAT
Adjusted PAT
Change (%)
2011
17,611
20.3
2,574
14.6
417
2,157
31
78
0
2,204
723
32.8
0
1,481
1,481
-11.3
2012
23,645
34.3
3,396
14.4
465
2,931
25
280
0
3,186
1,036
32.5
0
2,151
2,151
45.2
2013
29,614
25.2
4,515
15.2
661
3,854
10
466
-92
4,218
1,351
32.0
0
2,867
2,929
36.2
2014
34,367
16.0
5,603
16.3
646
4,957
7
455
-39
5,367
1,692
31.5
0
3,674
3,701
26.3
2015
42,113
22.5
7,091
16.8
1,340
5,751
2
423
-73
6,098
1,990
32.6
0
4,108
4,158
12.3
2016
46,907
11.4
8,169
17.4
1,399
6,770
5
457
0
7,222
2,328
32.2
0
4,894
4,894
17.7
2017E
54,534
16.3
9,749
17.9
1,779
7,971
9
750
0
8,712
2,613
30.0
0
6,098
6,098
24.6
(INR Million)
2018E
63,748
16.9
11,400
17.9
2,179
9,221
9
1,000
0
10,212
2,808
27.5
0
7,404
7,404
21.4
Balance Sheet
Million)
(INR
2011
171
6,289
6,459
1,000
205
7,664
5,388
2,237
3,151
375
161
7,472
2,847
3,057
451
1,117
3,496
2,028
1,468
3,977
7,664
2012
171
8,064
8,235
855
220
9,310
6,213
2,667
3,546
315
161
9,493
2,666
3,197
2,292
1,339
4,206
2,145
2,061
5,288
9,310
2013
171
10,427
10,598
881
195
11,674
6,803
3,214
3,589
1,030
161
12,925
2,929
3,807
4,108
2,082
6,030
3,537
2,493
6,895
11,674
2014
171
13,456
13,627
843
301
14,772
9,955
3,860
6,096
1,447
161
13,691
3,350
4,528
2,946
2,867
6,623
3,435
3,188
7,068
14,771
2015
171
16,825
16,996
741
368
18,106
14,414
4,970
9,444
863
161
13,414
4,181
5,541
2,222
1,469
5,775
4,136
1,639
7,638
18,106
2016
171
20,846
21,016
725
588
22,330
19,731
6,369
13,362
1,000
161
14,560
6,017
5,922
1,503
1,120
6,754
5,771
983
7,806
22,330
2017E
171
25,925
26,096
773
588
27,458
24,731
8,148
16,584
1,000
161
17,143
6,275
6,884
2,682
1,302
7,430
5,412
2,018
9,713
27,458
2018E
171
32,120
32,291
773
588
33,653
29,731
10,326
19,405
1,000
161
21,493
6,462
8,047
5,462
1,521
8,407
6,327
2,080
13,086
33,653
Y/E Mar
Share Capital
Reserves
Net Worth
Debt
Deferred Tax
Total Capital Employed
Gross Fixed Assets
Less: Acc Depreciation
Net Fixed Assets
Capital WIP
Investments
Current Assets
Inventory
Debtors
Cash & Bank
Loans & Adv, Others
Curr Liabs & Provns
Curr. Liabilities
Provisions
Net Current Assets
Total Assets
25 May 2016
6
 Motilal Oswal Financial Services
Amara Raja Batteries
Financials and Valuations
Ratios
Y/E Mar
Basic (INR)
EPS
Cash EPS
Book Value
DPS
Payout (incl. Div. Tax.)
Valuation(x)
P/E
Price / Book Value
EV/Sales
EV/EBITDA
Dividend Yield (%)
Profitability Ratios (%)
RoE
RoCE
RoIC
Turnover Ratios (%)
Asset Turnover (x)
Debtors (No. of Days)
Inventory (No. of Days)
Creditors (No. of Days)
Leverage Ratios (%)
Net Debt/Equity (x)
2011
8.7
11.1
37.8
2.3
30.9
2012
12.6
15.3
48.2
1.9
17.4
2013
17.2
21.0
62.0
2.5
17.6
2014
21.7
25.4
79.8
3.6
19.3
2015
24.3
32.2
99.5
3.6
18.0
35.0
8.6
3.4
20.3
0.4
24.9
21.1
23.7
2.3
59
57
23
0.1
29.3
25.5
29.9
2.5
41
45
15
-0.2
31.1
28.0
40.6
2.5
36
42
19
-0.3
30.6
28.0
40.9
2.3
36
43
17
-0.2
27.2
25.3
30.9
2.3
36
43
23
-0.1
2016
28.7
36.8
123.0
4.3
17.8
29.7
6.9
3.1
17.7
0.5
25.8
24.2
26.6
2.1
47
41
26
0.0
2017E
35.7
46.1
152.8
5.0
16.7
23.8
5.6
2.6
14.7
0.6
25.9
24.5
25.8
2.0
42
40
17
-0.1
2018E
43.3
56.1
189.1
5.9
16.3
19.6
4.5
2.2
12.3
0.7
25.4
24.3
26.4
1.9
37
40
17
-0.2
Cash Flow Statement
Y/E Mar
Adjusted EBITDA
Non cash opr. exp (inc)
(Inc)/Dec in Wkg. Cap.
Tax Paid
Other operating activities
CF from Op. Activity
(Inc)/Dec in FA & CWIP
Free cash flows
(Pur)/Sale of Invt
Others
CF from Inv. Activity
Inc/(Dec) in Net Worth
Inc / (Dec) in Debt
Interest Paid
Divd Paid (incl Tax) & Others
CF from Fin. Activity
Inc/(Dec) in Cash
Add: Opening Balance
Closing Balance
2011
2,574
56
-1,138
-776
146
861
0
861
0
-612
-612
0
17
-21
-419
-422
-174
625
451
2012
3,396
233
120
-1,026
262
2,985
0
2,985
0
-727
-727
0
-271
84
-222
-409
1,848
444
2,292
2013
4,578
108
-94
-1,366
129
3,355
0
3,355
0
-1,194
-1,194
0
3
-17
-323
-336
1,825
2,283
4,108
2014
5,629
-435
-1,315
-1,606
514
2,788
0
2,788
-3,314
-134
-3,448
0
-87
-14
-430
-531
-1,192
4,138
2,946
2015
7,140
174
-1,475
-1,922
-35
3,882
0
3,882
0
-3,810
-3,810
0
-112
-84
-552
-748
-675
2,897
2,221
2016
8,169
0
-887
-2,328
0
4,954
0
4,954
0
-4,998
-4,998
0
203
-5
-871
-673
-716
2,221
1,505
2017E
9,749
0
-727
-2,613
0
6,409
0
6,409
0
-4,250
-4,250
0
48
-9
-1,018
-979
1,179
1,505
2,685
(INR Million)
2018E
11,400
0
-593
-2,808
0
7,998
0
7,998
0
-4,000
-4,000
0
0
-9
-1,209
-1,218
2,780
2,685
5,465
25 May 2016
7
 Motilal Oswal Financial Services
Amara Raja Batteries
Corporate profile
Company description
Exhibit 1: Sensex rebased
Commencing operations in 1992, AMRJ has become
battery
India’s
second-largest
lead-acid
manufacturer (next to market leader EXID), with
market leadership in telecom and UPS segments. It
is reckoned as one of the pioneers in VRLA (valve
regulated lead acid) batteries. Johnson Control USA
(JC) is an equal partner and acquired 26% equity in
AMRJ in 1997.
Source: MOSL/Bloomberg
Exhibit 2: Shareholding pattern (%)
Dec-15
52.1
9.3
19.5
19.1
Promoter
DII
FII
Others
Sep-15
52.1
8.7
20.2
19.0
Dec-14
52.1
8.7
18.2
21.0
Source: Capitaline
Exhibit 3: Top holders
Holder Name
Franklin Templeton Investment Funds
ICICI Prudential Value Discovery Fund
Smallcap World Fund INC
NA
NA
% Holding
2.4
1.8
1.3
0.0
0.0
Source: Capitaline
Note: FII Includes depository receipts
Exhibit 4: Top management
Name
Ramachandra N Galla
Jayadev Galla
M R Rajaram
Designation
Chairman
Vice Chairman & M.D.
Company Secretary
Exhibit 5: Directors
Name
N Sri Vishnu Raju
Raymond J Brown
T R Narayanaswamy
Raphael John Shemanski
Name
Nagarjun Valluripalli
Shu Qing Yang
Bhairavi Tushar Jain
Source: Capitaline
*Independent
Exhibit 6: Auditors
Name
Brahmayya & Co
Chevuturi Associates
Deloitte Haskins & Sells LLP
E Phalguna Kumar & Co
Sagar & Associates
Type
Statutory
Statutory
Statutory
Statutory
Cost Auditor
Source: Capitaline
Exhibit 7: MOSL forecast v/s consensus
EPS
(INR)
FY17
FY18
MOSL forecast
35.7
43.3
Consensus
forecast
36.9
44.0
Variation
(%)
-3.3
-1.5
Source: Bloomberg
25 May 2016
8
 Motilal Oswal Financial Services
AMARA RAJA BATTERIES GALLERY
AMRJ
AMRJ
SECTOR UPDATES
 Motilal Oswal Financial Services
Disclosures
Amara Raja Batteries
This document has been prepared by Motilal Oswal Securities Limited (hereinafter referred to as Most) to provide information about the company (ies) and/sector(s), if any, covered in the report and may be distributed by it and/or its
affiliated company(ies). This report is for personal information of the selected recipient/s and does not construe to be any investment, legal or taxation advice to you. This research report does not constitute an offer, invitation or
inducement to invest in securities or other investments and Motilal Oswal Securities Limited (hereinafter referred as MOSt) is not soliciting any action based upon it. This report is not for public distribution and has been furnished to
you solely for your general information and should not be reproduced or redistributed to any other person in any form. This report does not constitute a personal recommendation or take into account the particular investment
objectives, financial situations, or needs of individual clients. Before acting on any advice or recommendation in this material, investors should consider whether it is suitable for their particular circumstances and, if necessary, seek
professional advice. The price and value of the investments referred to in this material and the income from them may go down as well as up, and investors may realize losses on any investments. Past performance is not a guide for
future performance, future returns are not guaranteed and a loss of original capital may occur.
MOSt and its affiliates are a full-service, integrated investment banking, investment management, brokerage and financing group. We and our affiliates have investment banking and other business relationships with a some
companies covered by our Research Department. Our research professionals may provide input into our investment banking and other business selection processes. Investors should assume that MOSt and/or its affiliates are
seeking or will seek investment banking or other business from the company or companies that are the subject of this material and that the research professionals who were involved in preparing this material may educate investors
on investments in such business . The research professionals responsible for the preparation of this document may interact with trading desk personnel, sales personnel and other parties for the purpose of gathering, applying and
interpreting information. Our research professionals are paid on twin parameters of performance & profitability of MOSt.
MOSt generally prohibits its analysts, persons reporting to analysts, and members of their households from maintaining a financial interest in the securities or derivatives of any companies that the analysts cover. Additionally, MOSt
generally prohibits its analysts and persons reporting to analysts from serving as an officer, director, or advisory board member of any companies that the analysts cover. Our salespeople, traders, and other professionals or affiliates
may provide oral or written market commentary or trading strategies to our clients that reflect opinions that are contrary to the opinions expressed herein, and our proprietary trading and investing businesses may make investment
decisions that are inconsistent with the recommendations expressed herein. In reviewing these materials, you should be aware that any or all of the foregoing among other things, may give rise to real or potential conflicts of interest.
MOSt and its affiliated company(ies), their directors and employees and their relatives may; (a) from time to time, have a long or short position in, act as principal in, and buy or sell the securities or derivatives thereof of companies
mentioned herein. (b) be engaged in any other transaction involving such securities and earn brokerage or other compensation or act as a market maker in the financial instruments of the company(ies) discussed herein or act as an
advisor or lender/borrower to such company(ies) or may have any other potential conflict of interests with respect to any recommendation and other related information and opinions.; however the same shall have no bearing
whatsoever on the specific recommendations made by the analyst(s), as the recommendations made by the analyst(s) are completely independent of the views of the affiliates of MOSt even though there might exist an inherent
conflict of interest in some of the stocks mentioned in the research report Reports based on technical and derivative analysis center on studying charts company's price movement, outstanding positions and trading volume, as
opposed to focusing on a company's fundamentals and, as such, may not match with a report on a company's fundamental analysis. In addition MOST has different business segments / Divisions with independent research
separated by Chinese walls catering to different set of customers having various objectives, risk profiles, investment horizon, etc, and therefore may at times have different contrary views on stocks sectors and markets.
Unauthorized disclosure, use, dissemination or copying (either whole or partial) of this information, is prohibited. The person accessing this information specifically agrees to exempt MOSt or any of its affiliates or employees from,
any and all responsibility/liability arising from such misuse and agrees not to hold MOSt or any of its affiliates or employees responsible for any such misuse and further agrees to hold MOSt or any of its affiliates or employees free
and harmless from all losses, costs, damages, expenses that may be suffered by the person accessing this information due to any errors and delays. The information contained herein is based on publicly available data or other
sources believed to be reliable. Any statements contained in this report attributed to a third party represent MOSt’s interpretation of the data, information and/or opinions provided by that third party either publicly or through a
subscription service, and such use and interpretation have not been reviewed by the third party. This Report is not intended to be a complete statement or summary of the securities, markets or developments referred to in the
document. While we would endeavor to update the information herein on reasonable basis, MOSt and/or its affiliates are under no obligation to update the information. Also there may be regulatory, compliance, or other reasons that
may prevent MOSt and/or its affiliates from doing so. MOSt or any of its affiliates or employees shall not be in any way responsible and liable for any loss or damage that may arise to any person from any inadvertent error in the
information contained in this report. MOSt or any of its affiliates or employees do not provide, at any time, any express or implied warranty of any kind, regarding any matter pertaining to this report, including without limitation the
implied warranties of merchantability, fitness for a particular purpose, and non-infringement. The recipients of this report should rely on their own investigations.
This report is intended for distribution to institutional investors. Recipients who are not institutional investors should seek advice of their independent financial advisor prior to taking any investment decision based on this report or for
any necessary explanation of its contents.
Most and it’s associates may have managed or co-managed public offering of securities, may have received compensation for investment banking or merchant banking or brokerage services, may have received any compensation
for products or services other than investment banking or merchant banking or brokerage services from the subject company in the past 12 months.
Most and it’s associates have not received any compensation or other benefits from the subject company or third party in connection with the research report.
Subject Company may have been a client of Most or its associates during twelve months preceding the date of distribution of the research report
MOSt and/or its affiliates and/or employees may have interests/positions, financial or otherwise of over 1 % at the end of the month immediately preceding the date of publication of the research in the securities mentioned in this
report. To enhance transparency, MOSt has incorporated a Disclosure of Interest Statement in this document. This should, however, not be treated as endorsement of the views expressed in the report.
Motilal Oswal Securities Limited is registered as a Research Analyst under SEBI (Research Analyst) Regulations, 2014. SEBI Reg. No. INH000000412
Pending Regulatory inspections against Motilal Oswal Securities Limited:
SEBI pursuant to a complaint from client Shri C.R. Mohanraj alleging unauthorized trading, issued a letter dated 29th April 2014 to MOSL notifying appointment of an Adjudicating Officer as per SEBI regulations to hold inquiry and
adjudge violation of SEBI Regulations; MOSL replied to the Show Cause Notice whereby SEBI granted us an opportunity of Inspection of Documents. Since all the documents requested by us were not covered we have requested to
SEBI vide our letter dated June 23, 2015 to provide pending list of documents for inspection.
List of associate companies of Motilal Oswal Securities Limited -Click
here to access detailed report
Analyst Certification
The views expressed in this research report accurately reflect the personal views of the analyst(s) about the subject securities or issues, and no part of the compensation of the research analyst(s) was, is, or will be directly or
indirectly related to the specific recommendations and views expressed by research analyst(s) in this report. The research analysts, strategists, or research associates principally responsible for preparation of MOSt research receive
compensation based upon various factors, including quality of research, investor client feedback, stock picking, competitive factors and firm revenues
Disclosure of Interest Statement
Analyst ownership of the stock
Served as an officer, director or employee
AMARA RAJA BATTERIES
No
No
A graph of daily closing prices of securities is available at www.nseindia.com and http://economictimes.indiatimes.com/markets/stocks/stock-quotes
Regional Disclosures (outside India)
This report is not directed or intended for distribution to or use by any person or entity resident in a state, country or any jurisdiction, where such distribution, publication, availability or use would be contrary to law, regulation or which
would subject MOSt & its group companies to registration or licensing requirements within such jurisdictions.
For Hong Kong:
This report is distributed in Hong Kong by Motilal Oswal capital Markets (Hong Kong) Private Limited, a licensed corporation (CE AYY-301) licensed and regulated by the Hong Kong Securities and Futures
Commission (SFC) pursuant to the Securities and Futures Ordinance (Chapter 571 of the Laws of Hong Kong) “SFO”. As per SEBI (Research Analyst Regulations) 2014 Motilal Oswal Securities (SEBI Reg No. INH000000412) has
an agreement with Motilal Oswal capital Markets (Hong Kong) Private Limited for distribution of research report in Kong Kong. This report is intended for distribution only to “Professional Investors” as defined in Part I of Schedule 1 to
SFO. Any investment or investment activity to which this document relates is only available to professional investor and will be engaged only with professional investors.” Nothing here is an offer or solicitation of these securities,
products and services in any jurisdiction where their offer or sale is not qualified or exempt from registration. The Indian Analyst(s) who compile this report is/are not located in Hong Kong & are not conducting Research Analysis in
Hong Kong.
Motilal Oswal Securities Limited (MOSL) is not a registered broker - dealer under the U.S. Securities Exchange Act of 1934, as amended (the"1934 act") and under applicable state laws in the United States. In addition MOSL is not a
registered investment adviser under the U.S. Investment Advisers Act of 1940, as amended (the "Advisers Act" and together with the 1934 Act, the "Acts), and under applicable state laws in the United States. Accordingly, in the
absence of specific exemption under the Acts, any brokerage and investment services provided by MOSL, including the products and services described herein are not available to or intended for U.S. persons.
This report is intended for distribution only to "Major Institutional Investors" as defined by Rule 15a-6(b)(4) of the Exchange Act and interpretations thereof by SEC (henceforth referred to as "major institutional investors"). This
document must not be acted on or relied on by persons who are not major institutional investors. Any investment or investment activity to which this document relates is only available to major institutional investors and will be
engaged in only with major institutional investors. In reliance on the exemption from registration provided by Rule 15a-6 of the U.S. Securities Exchange Act of 1934, as amended (the "Exchange Act") and interpretations thereof by
the U.S. Securities and Exchange Commission ("SEC") in order to conduct business with Institutional Investors based in the U.S., MOSL has entered into a chaperoning agreement with a U.S. registered broker-dealer, Motilal Oswal
Securities International Private Limited. ("MOSIPL"). Any business interaction pursuant to this report will have to be executed within the provisions of this chaperoning agreement.
The Research Analysts contributing to the report may not be registered /qualified as research analyst with FINRA. Such research analyst may not be associated persons of the U.S. registered broker-dealer, MOSIPL, and therefore,
may not be subject to NASD rule 2711 and NYSE Rule 472 restrictions on communication with a subject company, public appearances and trading securities held by a research analyst account.
For Singapore
Motilal Oswal Capital Markets Singapore Pte Limited is acting as an exempt financial advisor under section 23(1)(f) of the Financial Advisers Act(FAA) read with regulation 17(1)(d) of the Financial Advisors Regulations and is a
subsidiary of Motilal Oswal Securities Limited in India. This research is distributed in Singapore by Motilal Oswal Capital Markets Singapore Pte Limited and it is only directed in Singapore to accredited investors, as defined in the
Financial Advisers Regulations and the Securities and Futures Act (Chapter 289), as amended from time to time.
In respect of any matter arising from or in connection with the research you could contact the following representatives of Motilal Oswal Capital Markets Singapore Pte Limited:
Varun Kumar
Varun.kumar@motilaloswal.com
Contact : (+65) 68189232
Office Address:21 (Suite 31),16 Collyer Quay,Singapore 04931
Kadambari Balachandran
kadambari.balachandran@motilaloswal.com
(+65) 68189233 / 65249115
For U.S
25 May 2016
Motilal Oswal Tower, Level 9, Sayani Road, Prabhadevi, Mumbai 400 025
Phone: +91 22 3982 5500 E-mail: reports@motilaloswal.com
Motilal Oswal Securities Ltd
10