United Spirits
BSE SENSEX
26,714
S&P CNX
8,180
6 June 2016
Update
| Sector:
Consumer
CMP: INR2,474
TP: INR3,200(+29%)
Buy
Management maintains mid teen margin guidance
We attended the analyst meet of United Spirits. Following are the key takeaways from
the meet:
Continuing with the identified strategic priorities: a) Power brands b) Strengthen
route to consumer c) Drive out costs d) Transform USL and Industry reputation e)
Building a future ready organization.
Demographic fundamentals strong; Long term opportunity intact.
Strong premiumization trend continues.
Aspiration of mid-teens EBITDA margin in medium term remains.
Business is now being run in a very transparent and compliant manner.
Not much from a near term catalyst perspective apart from the price hike received in
its largest state – Karnataka – 25% of volumes. Andhra Pradesh and Telangana, two
other large markets could also grant price hikes in the next few months.
FY17 should see enhanced momentum both from brands which have been
relaunched in FY16 viz Royal Challenge, McDowell No 1 and Signature as well as the
Diageo portfolio.
While we are strong believers in the long term potential we believe a trend of
quarterly improvements in operating metrics (volumes/margins/ debt/working
capital), albeit small, is necessary for premium valuations to sustain. Speculation
around potential open offer may provide cushion to stock price. Maintain BUY and
DCF based TP of INR3,200.
Stock Info
Bloomberg
Equity Shares (m)
52-Week Range (INR)
1, 6, 12 Rel. Per (%)
M.Cap. (INR b)
M.Cap. (USD b)
12M Avg Val (INR M)
Free float (%)
UNSP IN
145.3
3,838/2,232
-10/-26/-31
359.5
5.2
841
41.5
Financials Snapshot (INR b)
Y/E Mar
2016 2017E
Net Sales
92.4
104.0
EBITDA
9.2
11.9
PAT
3.2
6.0
EPS (INR)
21.7
41.0
Gr. (%)
LP
88.9
BV/Sh .INR
123.1
164.1
RoE (%)
25.8
28.6
RoCE (%)
10.7
13.8
P/E (x)
114.0
60.5
P/BV (x)
20.1
15.1
Shareholding pattern (%)
As On
Promoter
DII
FII
Others
2018E
117.8
15.7
8.9
61.5
49.9
222.7
27.6
17.6
40.4
11.2
Mar-16 Dec-15 Mar-15
58.5
5.3
23.8
12.4
58.8
4.6
24.1
12.5
58.9
4.2
24.5
12.4
FII Includes depository receipts
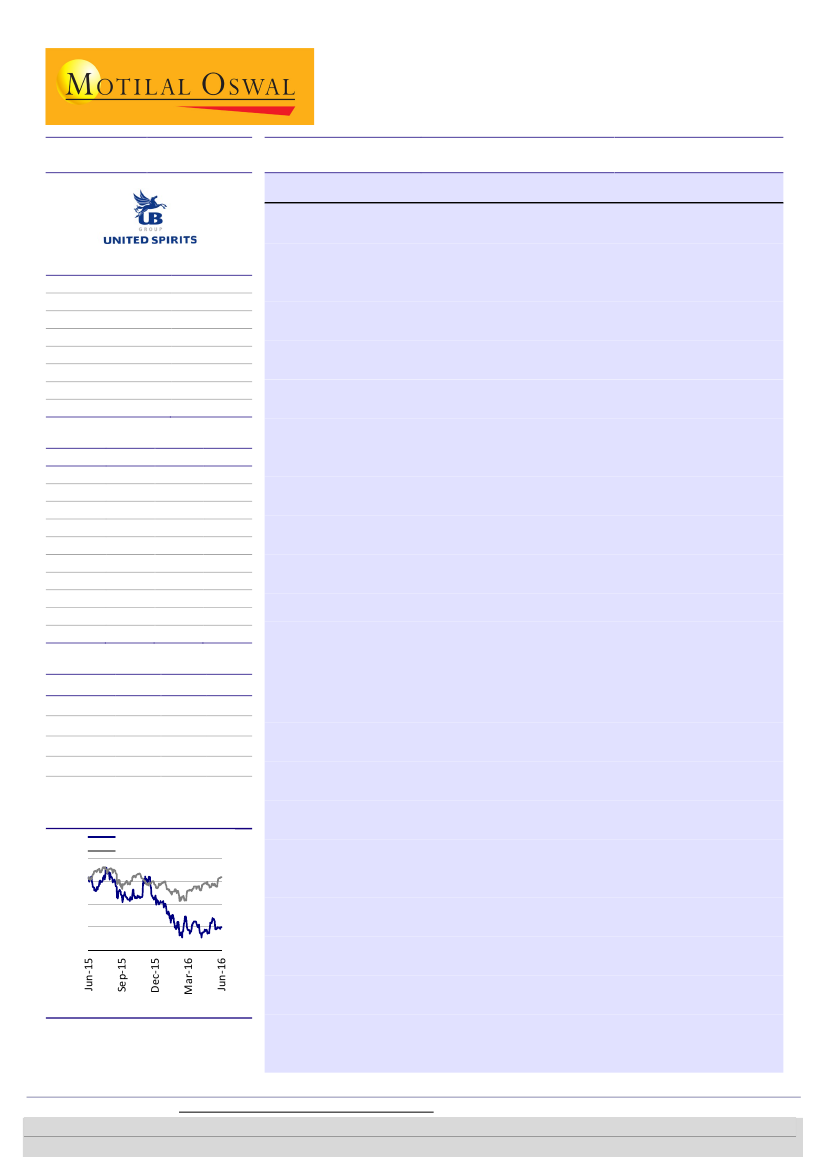
Stock Performance (1-year)
United Spirits
Sensex - Rebased
4,000
3,500
3,000
2,500
2,000
UNSP’s ambition and strategy: To create one of the best performing most trusted
and respected consumer products companies in India. UNSP continues with its
five point strategy:
1) Strengthen and accelerate core brands to win across each of the 3 Indias
Continue to invest behind brands. Renovate and rejuvenate existing
brands. Innovate and introduce new to market brands.
Renovated three brands – Royal Challenge, McDowell’s No.1 (Core variant
growing in double digits, already reached 88% of market) and Signature.
Believe USL was underinvesting in brands earlier.
2) Strengthen Route to consumer
Leverage outlet as a media to build brand imagery.
Create a sell-out culture and leverage stores in a media dark market [20%
of India’s alcobev outlets made into “Perfect Stores”] – QDVP3 focus
[Quality, Distribution, Visibility, Price, Promotion, Persuasion].
De-focused on lower end – changed the mindset of sales force towards
value vs. volume earlier.
3) Drive out costs
Mitigate
pricing
shortfall
and
improve
margins
through
productivity. Productivity program launched in FY15. While management
did not mention quantum they did state that FY16 gains were higher than
FY15 and FY17 gains would be higher than FY16.
Big wins in cost saving were in Glass light weighting, procurement
efficiency and network optimization.
Gautam Duggad
(Gautam.Duggad@MotilalOswal.com); +91 22 3982 5404
Krishnan Sambamoorthy
(Krishnan.sambamoorthy@motilaloswal.com); /
Vishal Punmiya
(Vishal.Punmiya@motilaloswal.com)
Investors are advised to refer through important disclosures made at the last page of the Research Report.
Motilal Oswal research is available on www.motilaloswal.com/Institutional-Equities, Bloomberg, Thomson Reuters, Factset and S&P Capital.

United Spirits
4) Transform USL and Industry reputation
Influencing public policy: White papers created on topics of interest to
states to build symbiotic relationship. Broader partnerships with states,
address overlapping impacts of center and state policies.
Alcohol in society: Road to safety etc.
Project SHE: Grass root community outreach program.
5) Building a future ready organization
Right sizing organization by reducing layers and improving spans.
Bring in new capabilities.
Created performance culture focused on value delivery.
Demographic fundamentals strong; Long term opportunity intact:
Indian liquor
market remains attractive given its favorable demographics (rising income,
changing consumption dynamics) and increasing income segments (Aspiring,
Middle, Affluent – pyramid turning to diamond). Total alcohol market grew at a
5-year CAGR of 11% moving from an INR240b market in 2010 to INR410b
market in 2015. In the same period the spirits market grew at 13% CAGR from
INR160b to an INR290b market while the beer market grew at 9% CAGR from
INR 70b to INR 110b. The wine /RTD market which is currently small in India
grew at a CAGR of 20%. 25m people come into the drinking age in India every
year of which around one third drink. Between CY15 to CY2025, the
management believes that the affluent segment share will double from 1% to
2%. The top end of the middle segment will grow from 1% to 9% and the lower
end of the middle segment from 19% to 32% over this period while the
aspirational segment proportion will decline. With sharper growth in the middle
the demand pyramid will convert to a diamond.
Premiumization trend has been strong:
Between FY10 and FY15 prestige and
above segments grew from 33% to 42% of Net Sales Value while the share of
PAT from these premium segments moved from 52% to 61%. While total IMFL
sales grew by 12% CAGR over this period, luxury grew by 33% CAGR off a low
base, premium and prestige by 21% CAGR each while popular segment grew by
9% CAGR
Other points
6% of global TBA (Total Beverage Alcohol) growth driven by India despite
India being only 1% of industry.
Per Capita Consumption: Currently <2 alcohol LPA/head, Increase to 3-4
alcohol LPA/head.
IMFL Spirits = 70% of India TBA, lower taxes compared to beer. 11% of
global spirits growth will come from India.
Industry has seen slowdown in last 2-3 years. Strategic investments in
industry have gone down to near zero due to issues facing company in the
past. Investment shifted from strategic to tactical spending to drive short
term performance.
Demographic fundamentals are strong and should get industry back to
healthy growth rates. Expect double digit growth for industry.
Change in the way UNSP does business – faced some barriers
6 June 2016
2

United Spirits
GST impact- Commissioned work on GST six months back to understand the
business model implications. GST has been Inflationary globally for first 2
years. Worst case could be input material taxed and not allowed to claim
benefits. Nevertheless, management believes that the centre wants to
include alcohol in GST or states will have rates specific to end use. If worst
case pans out then all players will pass on and state will suffer.
Free pricing is not really free pricing – one has to jump the slab and then
eventual impact on end consumer is much higher.
In the past 2 years consumer prices have gone up in line with inflation but
duties went up too – thus, manufacturers suffered as the price increase
benefits were taken away by government.
Talking to government of Maharashtra on developing Model Excise policy –
to demonstrate the benefit of free pricing, optimal duties and then use that
as an example for other states to follow.
Karnataka: Allowed price hikes but it will be effective 1st July. However,
excise duties hiked w.e.f. from 1st April. Slabs have been raised by INR
35/case for all players. Question is how much of this will be retained by
manufacturers and how much will be passed on to trade.
Management believes that if state governments are not looking at
prohibition then their motive is revenue maximization. Uttar Pradesh lost
market share to neighbouring states when they increased excise 3 years in a
row. Now reduced excise by 22-23% in the current financial year.
Aim to convince at least 1 state to reduce excise and UP could be a very
good example.
Management gave the example of HUL’s Fair and Lovely brand which paid
115% excise at one time. Every year excise duty came down and excise
earnings to government went up as volumes went up.
The management is using neuro science tests to check improvement
including eye movement impact of packaging in comparison with older
packs and benchmark competition. Believe product improvement is a
continuous process.
Net working capital was around 37% of sales. Management believes that
there could be savings going forward on inventory days
Royalty is paid to Diageo only on Smirnoff. Other Diageo brands are either
bottled in origin in which case transfer pricing happens in case of finished
product or bottled in India in which case transfer pricing happens on
imported materials
The longer term aim is for popular segment products to be manufactured by
third party manufacturers and prestige and above segments will be own
manufacture. The company had 90 units earlier which have been now
reduced to 80. While they believe they need at least 1 site in every state,
the number of units can be reduced substantially.
6 June 2016
3

United Spirits
Exhibit 1: Alcohol demand growing in double digits
Exhibit 2: Spirits are growing at a faster pace….
Source: Company, MOSL
Exhibit 3: ….compared to beer
Exhibit 4: Premium segments growing much faster
Source: Company, MOSL
Exhibit 5: Components contributing/ detracting from sales growth in FY16
Source: Company, MOSL
6 June 2016
4

United Spirits
Exhibit 6: Components contributing to/ detracting from EBITDA in FY16
Source: Company, MOSL
Exhibit 7: Components affecting EBITDA margin
Source: Company, MOSL
Exhibit 8: Movement of cash
Source: Company, MOSL
6 June 2016
5

United Spirits
Exhibit 9: Movement of debt
Source: Company, MOSL
6 June 2016
6

United Spirits
Financials and valuations
Income Statement
Y/E March
Total Revenue
Change (%)
Total Expenditure
EBITDA
Change (%)
Margin (%)
Depreciation
Int. and Fin. Charges
Other Income - Recurring
Profit before Taxes
Change (%)
Margin (%)
Tax
Tax Rate (%)
Minority Interest
Adjusted PAT
Change (%)
Margin (%)
Non-rec. (Exp)/Income
Reported PAT
Balance Sheet
Y/E March
Share Capital
Reserves
Minority Interest
Net Worth
Loans
Deffered Tax Liabilities
Capital Employed
Gross Block
Less: Accum. Depn.
Net Fixed Assets
Capital WIP
Goodwill
Investments
Curr. Assets, L&A
Inventory
Account Receivables
Cash and Bank
Bank Deposit
Others
Curr. Liab. and Prov.
Account Payables
Other Liabilities
Provisions
Net Current Assets
Application of Funds
E: MOSL Estimates
2011
73,762
15.9
-63,109
10,653
-4.2
14.4
-1,023
-4,985
904
5,549
12.1
7.5
2,098
37.8
-11.9
3,463
14.5
4.7
2,238
5,701
2012
91,865
24.5
-81,262
10,603
-0.5
11.5
-1,474
-7,773
2,106
3,461
-37.6
3.8
1,481
42.8
-7.2
1,988
-42.6
2.2
-108
1,880
2013
104,115
13.3
-94,078
10,037
-5.3
9.6
-1,784
-8,861
1,446
838
-75.8
0.8
1,781
212.4
-38.3
-904
-145.5
-0.9
-108
-1,012
2014
105,009
0.9
-96,298
8,711
-13.2
8.3
-2,026
-12,771
1,912
-4,174
-597.9
-4.0
2,762
-66.2
3.1
-6,940
667.8
-6.6
-37,951
-44,891
2015
91,594
-12.8
-84,761
6,833
-21.6
7.5
-2,229
-6,528
2,222
297
-107.1
0.3
520
175.1
3.8
-227
-96.7
-0.2
-16,650
-16,877
2016
92,401
0.9
-83,199
9,202
34.7
9.9
-1,577
-4,558
1,684
4,750
1,498.0
5.1
1,583
33.3
11.9
3,155
-1,490.2
3.4
6,522
9,678
(INR Million)
2017E
2018E
103,961
117,785
12.5
13.3
-92,020
11,940
29.8
11.5
-1,884
-3,236
2,077
8,897
87.3
8.6
2,936
33.0
0
5,961
88.9
5.7
0
5,961
-102,095
15,690
31.4
13.3
-2,195
-2,654
2,493
13,334
49.9
11.3
4,400
33.0
0
8,934
49.9
7.6
0
8,934
(INR Million)
2018E
1,453
30,890
17
32,360
31,500
-878
62,982
35,404
-14,950
20,455
1,141
5,262
1,989
68,876
20,975
20,459
6,871
1,208
19,362
34,741
13,553
13,876
7,312
34,135
62,982
2011
1,259
40,527
175
41,961
67,107
-325
108,743
26,972
-7,573
19,399
1,291
44,320
1,544
61,842
21,168
14,825
4,944
1,426
19,479
20,102
13,304
5,026
1,771
41,741
108,742
2012
1,259
45,359
146
46,764
75,231
-592
121,403
29,620
-9,432
20,188
1,080
58,618
2,358
75,729
27,548
17,737
2,690
942
26,812
36,570
16,792
17,328
2,451
39,159
121,403
2013
1,259
46,614
111
47,984
72,517
-589
119,911
31,026
-10,721
20,305
1,312
58,386
2,179
82,059
25,112
24,170
1,115
1,701
29,960
44,330
15,653
24,864
3,812
37,729
119,911
2014
1,453
28,869
7
30,330
81,563
-967
110,927
35,317
-13,413
21,905
1,097
35,099
2,380
87,129
29,351
22,652
1,063
5,984
28,078
36,683
14,267
16,275
6,141
50,447
110,927
2015
1,453
5,141
8
6,603
50,569
-878
56,293
23,404
-8,952
14,452
1,141
4,757
2,162
55,493
17,581
17,515
1,166
2,463
16,768
21,714
7,582
8,128
6,004
33,779
56,293
2016
1,453
16,426
17
17,896
42,500
-878
59,518
27,404
-10,870
16,534
1,141
5,262
2,162
58,861
17,948
24,516
1,620
1,208
13,569
24,442
7,383
10,692
6,367
34,419
59,518
2017E
1,453
22,383
17
23,854
35,500
-878
58,476
31,404
-12,755
18,650
1,141
5,262
1,989
61,966
19,368
21,476
2,825
1,208
17,089
30,533
11,963
12,247
6,323
31,433
58,476
6 June 2016
7

United Spirits
Financials and valuations
Ratios
Y/E March
Basic (INR)
EPS
Cash EPS
BV/Share
DPS
Payout %
Valuation (x)
P/E
Cash P/E
EV/Sales
EV/EBITDA
P/BV
Dividend Yield (%)
Return Ratios (%)
RoE
RoCE
RoIC
Working Capital Ratios
Debtor (Days)
Asset Turnover (x)
Leverage Ratio
Debt/Equity (x)
Cash Flow Statement
Y/E March
OP/(loss) before Tax
Int./Div. Received
Interest Paid
Direct Taxes Paid
Incr/Decr in WC
CF from Operations
Extraordinary Items
(Incr)/Decr in FA
Free Cash Flow
(Pur)/Sale of Investments
Msc Exp
CF from Invest.
Issue of Shares
(Incr)/Decr in Debt
Dividend Paid
Others
CF from Fin. Activity
Incr/Decr of Cash
Add: Opening Balance
Closing Balance
E: MOSL Estimates
2011
28.3
36.7
342.8
2.5
8.8
2012
16.2
28.3
382.0
2.5
15.4
2013
-7.4
7.2
392.0
2.5
-33.9
2014
-47.8
-33.8
208.7
2.5
-5.2
2015
-1.6
13.8
45.4
0.0
0.0
2016
21.7
32.6
123.1
0.0
0.0
2017E
41.0
54.0
164.1
0.0
0.0
2018E
61.5
76.6
222.7
2.5
4.1
-1,584.2
179.6
4.0
54.3
54.5
0.0
114.0
76.0
3.9
39.4
20.1
0.0
60.5
46.0
3.4
29.8
15.1
0.0
40.4
32.4
2.9
22.1
11.2
0.1
8.7
6.4
6.3
73
0.7
4.5
5.6
4.8
70
0.8
-1.9
-9.0
-8.0
85
0.9
-17.7
12.4
10.0
79
0.9
-1.2
-6.1
-4.4
70
1.6
25.8
10.7
9.6
97
1.6
28.6
13.8
12.6
75
1.8
27.6
17.6
17.1
63
1.9
1.6
1.6
1.5
2.7
7.7
2.4
1.5
1.0
(INR Million)
2018E
13,334
-2,493
2,654
-4,400
1,344
10,439
0
-4,000
6,439
0
0
2,439
-4
-4,000
-424
-4,405
-8,832
4,046
4,033
8,079
2011
5,549
-904
4,985
-2,098
-11,211
-3,679
2,238
-5,452
-6,893
-279
0
-3,493
-1,179
8,603
-381
-1,186
5,856
-1,316
7,686
6,370
2012
3,461
-2,106
7,773
-1,481
-156
7,492
-108
-16,736
-9,352
-814
-448
-18,106
3,303
8,124
-379
-3,172
7,876
-2,738
6,370
3,632
2013
838
-1,446
8,861
-1,781
614
7,086
-108
-1,406
5,572
179
0
-1,335
2,611
-2,714
-379
-6,085
-6,568
-816
3,632
2,816
2014
-4,174
-1,912
12,771
-2,762
-8,487
-4,564
-37,951
19,211
-23,304
-201
-1
-18,942
27,278
9,047
-41
-8,547
27,737
4,231
2,816
7,048
2015
297
-2,222
6,528
-520
13,249
17,333
-16,650
42,210
42,892
218
1
25,778
-6,850
-30,995
0
-8,684
-46,529
-3,419
7,047
3,629
2016
4,750
-1,684
4,558
-1,583
-1,440
4,601
6,522
-4,504
6,619
0
0
2,018
1,616
-8,069
0
-967
-7,420
-801
3,629
2,828
2017E
8,897
-2,077
3,236
-2,936
4,191
11,311
0
-4,000
7,311
173
0
-3,827
-4
-7,000
0
725
-6,279
1,205
2,828
4,033
6 June 2016
8

United Spirits
NOTES
6 June 2016
9

Disclosures
This document has been prepared by Motilal Oswal Securities Limited (hereinafter referred to as Most) to provide information about the company (ies) and/sector(s), if any, covered in the report and may be distributed by it and/or its
United Spirits
affiliated company(ies). This report is for personal information of the selected recipient/s and does not construe to be any investment, legal or taxation advice to you. This research report does not constitute an offer, invitation or
inducement to invest in securities or other investments and Motilal Oswal Securities Limited (hereinafter referred as MOSt) is not soliciting any action based upon it. This report is not for public distribution and has been furnished to
you solely for your general information and should not be reproduced or redistributed to any other person in any form. This report does not constitute a personal recommendation or take into account the particular investment
objectives, financial situations, or needs of individual clients. Before acting on any advice or recommendation in this material, investors should consider whether it is suitable for their particular circumstances and, if necessary, seek
professional advice. The price and value of the investments referred to in this material and the income from them may go down as well as up, and investors may realize losses on any investments. Past performance is not a guide for
future performance, future returns are not guaranteed and a loss of original capital may occur.
MOSt and its affiliates are a full-service, integrated investment banking, investment management, brokerage and financing group. We and our affiliates have investment banking and other business relationships with a some
companies covered by our Research Department. Our research professionals may provide input into our investment banking and other business selection processes. Investors should assume that MOSt and/or its affiliates are
seeking or will seek investment banking or other business from the company or companies that are the subject of this material and that the research professionals who were involved in preparing this material may educate investors
on investments in such business . The research professionals responsible for the preparation of this document may interact with trading desk personnel, sales personnel and other parties for the purpose of gathering, applying and
interpreting information. Our research professionals are paid on twin parameters of performance & profitability of MOSt.
MOSt generally prohibits its analysts, persons reporting to analysts, and members of their households from maintaining a financial interest in the securities or derivatives of any companies that the analysts cover. Additionally, MOSt
generally prohibits its analysts and persons reporting to analysts from serving as an officer, director, or advisory board member of any companies that the analysts cover. Our salespeople, traders, and other professionals or affiliates
may provide oral or written market commentary or trading strategies to our clients that reflect opinions that are contrary to the opinions expressed herein, and our proprietary trading and investing businesses may make investment
decisions that are inconsistent with the recommendations expressed herein. In reviewing these materials, you should be aware that any or all of the foregoing among other things, may give rise to real or potential conflicts of interest.
MOSt and its affiliated company(ies), their directors and employees and their relatives may; (a) from time to time, have a long or short position in, act as principal in, and buy or sell the securities or derivatives thereof of companies
mentioned herein. (b) be engaged in any other transaction involving such securities and earn brokerage or other compensation or act as a market maker in the financial instruments of the company(ies) discussed herein or act as an
advisor or lender/borrower to such company(ies) or may have any other potential conflict of interests with respect to any recommendation and other related information and opinions.; however the same shall have no bearing
whatsoever on the specific recommendations made by the analyst(s), as the recommendations made by the analyst(s) are completely independent of the views of the affiliates of MOSt even though there might exist an inherent
conflict of interest in some of the stocks mentioned in the research report Reports based on technical and derivative analysis center on studying charts company's price movement, outstanding positions and trading volume, as
opposed to focusing on a company's fundamentals and, as such, may not match with a report on a company's fundamental analysis. In addition MOST has different business segments / Divisions with independent research
separated by Chinese walls catering to different set of customers having various objectives, risk profiles, investment horizon, etc, and therefore may at times have different contrary views on stocks sectors and markets.
Unauthorized disclosure, use, dissemination or copying (either whole or partial) of this information, is prohibited. The person accessing this information specifically agrees to exempt MOSt or any of its affiliates or employees from,
any and all responsibility/liability arising from such misuse and agrees not to hold MOSt or any of its affiliates or employees responsible for any such misuse and further agrees to hold MOSt or any of its affiliates or employees free
and harmless from all losses, costs, damages, expenses that may be suffered by the person accessing this information due to any errors and delays. The information contained herein is based on publicly available data or other
sources believed to be reliable. Any statements contained in this report attributed to a third party represent MOSt’s interpretation of the data, information and/or opinions provided by that third party either publicly or through a
subscription service, and such use and interpretation have not been reviewed by the third party. This Report is not intended to be a complete statement or summary of the securities, markets or developments referred to in the
document. While we would endeavor to update the information herein on reasonable basis, MOSt and/or its affiliates are under no obligation to update the information. Also there may be regulatory, compliance, or other reasons that
may prevent MOSt and/or its affiliates from doing so. MOSt or any of its affiliates or employees shall not be in any way responsible and liable for any loss or damage that may arise to any person from any inadvertent error in the
information contained in this report. MOSt or any of its affiliates or employees do not provide, at any time, any express or implied warranty of any kind, regarding any matter pertaining to this report, including without limitation the
implied warranties of merchantability, fitness for a particular purpose, and non-infringement. The recipients of this report should rely on their own investigations.
This report is intended for distribution to institutional investors. Recipients who are not institutional investors should seek advice of their independent financial advisor prior to taking any investment decision based on this report or for
any necessary explanation of its contents.
Most and it’s associates may have managed or co-managed public offering of securities, may have received compensation for investment banking or merchant banking or brokerage services, may have received any compensation
for products or services other than investment banking or merchant banking or brokerage services from the subject company in the past 12 months.
Most and it’s associates have not received any compensation or other benefits from the subject company or third party in connection with the research report.
Subject Company may have been a client of Most or its associates during twelve months preceding the date of distribution of the research report
MOSt and/or its affiliates and/or employees may have interests/positions, financial or otherwise of over 1 % at the end of the month immediately preceding the date of publication of the research in the securities mentioned in this
report. To enhance transparency, MOSt has incorporated a Disclosure of Interest Statement in this document. This should, however, not be treated as endorsement of the views expressed in the report.
Motilal Oswal Securities Limited is registered as a Research Analyst under SEBI (Research Analyst) Regulations, 2014. SEBI Reg. No. INH000000412
Pending Regulatory inspections against Motilal Oswal Securities Limited:
SEBI pursuant to a complaint from client Shri C.R. Mohanraj alleging unauthorized trading, issued a letter dated 29th April 2014 to MOSL notifying appointment of an Adjudicating Officer as per SEBI regulations to hold inquiry and
adjudge violation of SEBI Regulations; MOSL replied to the Show Cause Notice whereby SEBI granted us an opportunity of Inspection of Documents. Since all the documents requested by us were not covered we have requested to
SEBI vide our letter dated June 23, 2015 to provide pending list of documents for inspection.
List of associate companies of Motilal Oswal Securities Limited -Click
here to access detailed report
Analyst Certification
The views expressed in this research report accurately reflect the personal views of the analyst(s) about the subject securities or issues, and no part of the compensation of the research analyst(s) was, is, or will be directly or
indirectly related to the specific recommendations and views expressed by research analyst(s) in this report. The research analysts, strategists, or research associates principally responsible for preparation of MOSt research receive
compensation based upon various factors, including quality of research, investor client feedback, stock picking, competitive factors and firm revenues
Disclosure of Interest Statement
Analyst ownership of the stock
Served as an officer, director or employee
UNITED SPIRITS
No
No
A graph of daily closing prices of securities is available at www.nseindia.com and http://economictimes.indiatimes.com/markets/stocks/stock-quotes
Regional Disclosures (outside India)
This report is not directed or intended for distribution to or use by any person or entity resident in a state, country or any jurisdiction, where such distribution, publication, availability or use would be contrary to law, regulation or which
would subject MOSt & its group companies to registration or licensing requirements within such jurisdictions.
For Hong Kong:
This report is distributed in Hong Kong by Motilal Oswal capital Markets (Hong Kong) Private Limited, a licensed corporation (CE AYY-301) licensed and regulated by the Hong Kong Securities and Futures
Commission (SFC) pursuant to the Securities and Futures Ordinance (Chapter 571 of the Laws of Hong Kong) “SFO”. As per SEBI (Research Analyst Regulations) 2014 Motilal Oswal Securities (SEBI Reg No. INH000000412) has
an agreement with Motilal Oswal capital Markets (Hong Kong) Private Limited for distribution of research report in Kong Kong. This report is intended for distribution only to “Professional Investors” as defined in Part I of Schedule 1 to
SFO. Any investment or investment activity to which this document relates is only available to professional investor and will be engaged only with professional investors.” Nothing here is an offer or solicitation of these securities,
products and services in any jurisdiction where their offer or sale is not qualified or exempt from registration. The Indian Analyst(s) who compile this report is/are not located in Hong Kong & are not conducting Research Analysis in
Hong Kong.
For U.S
Motilal Oswal Securities Limited (MOSL) is not a registered broker - dealer under the U.S. Securities Exchange Act of 1934, as amended (the"1934 act") and under applicable state laws in the United States. In addition MOSL is not a
registered investment adviser under the U.S. Investment Advisers Act of 1940, as amended (the "Advisers Act" and together with the 1934 Act, the "Acts), and under applicable state laws in the United States. Accordingly, in the
absence of specific exemption under the Acts, any brokerage and investment services provided by MOSL, including the products and services described herein are not available to or intended for U.S. persons.
This report is intended for distribution only to "Major Institutional Investors" as defined by Rule 15a-6(b)(4) of the Exchange Act and interpretations thereof by SEC (henceforth referred to as "major institutional investors"). This
document must not be acted on or relied on by persons who are not major institutional investors. Any investment or investment activity to which this document relates is only available to major institutional investors and will be
engaged in only with major institutional investors. In reliance on the exemption from registration provided by Rule 15a-6 of the U.S. Securities Exchange Act of 1934, as amended (the "Exchange Act") and interpretations thereof by
the U.S. Securities and Exchange Commission ("SEC") in order to conduct business with Institutional Investors based in the U.S., MOSL has entered into a chaperoning agreement with a U.S. registered broker-dealer, Motilal Oswal
Securities International Private Limited. ("MOSIPL"). Any business interaction pursuant to this report will have to be executed within the provisions of this chaperoning agreement.
The Research Analysts contributing to the report may not be registered /qualified as research analyst with FINRA. Such research analyst may not be associated persons of the U.S. registered broker-dealer, MOSIPL, and therefore,
may not be subject to NASD rule 2711 and NYSE Rule 472 restrictions on communication with a subject company, public appearances and trading securities held by a research analyst account.
For Singapore
Motilal Oswal Capital Markets Singapore Pte Limited is acting as an exempt financial advisor under section 23(1)(f) of the Financial Advisers Act(FAA) read with regulation 17(1)(d) of the Financial Advisors Regulations and is a
subsidiary of Motilal Oswal Securities Limited in India. This research is distributed in Singapore by Motilal Oswal Capital Markets Singapore Pte Limited and it is only directed in Singapore to accredited investors, as defined in the
Financial Advisers Regulations and the Securities and Futures Act (Chapter 289), as amended from time to time.
In respect of any matter arising from or in connection with the research you could contact the following representatives of Motilal Oswal Capital Markets Singapore Pte Limited:
Varun Kumar
Varun.kumar@motilaloswal.com
Contact : (+65) 68189232
Office Address:21 (Suite 31),16 Collyer Quay,Singapore 04931
Kadambari Balachandran
kadambari.balachandran@motilaloswal.com
(+65) 68189233 / 65249115
6 June 2016
Motilal Oswal Tower, Level 9, Sayani Road, Prabhadevi, Mumbai 400 025
Phone: +91 22 3982 5500 E-mail: reports@motilaloswal.com
Motilal Oswal Securities Ltd
10