KPIT Technologies
BSE SENSEX
27,916
S&P CNX
8,566
20 July 2016
1QFY17 Results Update | Sector: Technology
CMP: INR133
TP: INR160(+20%)
Neutral
Motilal Oswal values your support in
the Asiamoney Brokers Poll 2016 for
India Research, Sales and Trading
team. We
request your ballot.
Multiple pressure points impact revenue growth…
…and consequently profitability
Bloomberg
Equity Shares (m)
M.Cap.(INRb)/(USDb)
52-Week Range (INR)
1, 6, 12 Rel. Per (%)
Avg Val, INRm
Free float (%)
KPIT IN
197.5
26.6 / 0.4
197 / 98
-33/-21/21
153
83.2
2018E
Financials & Valuations (INR b)
2016 2017E
Y/E Mar
32.2
33.4
Net Sales
4.4
4.5
EBITDA
3.0
2.7
NP
14.1
13.7
EPS (INR)
19.0
-2.4
EPS Gr. (%)
69.0
83.4
BV/Sh. (INR)
21.0
18.0
RoE (%)
24.3
21.4
RoCE (%)
9.3
9.5
Payout (%)
1.9
1.6
Div. Yield
37.4
5.2
3.2
16.0
16.4
99.4
17.5
21.7
8.2
1.3
Estimate change
TP change
Rating change
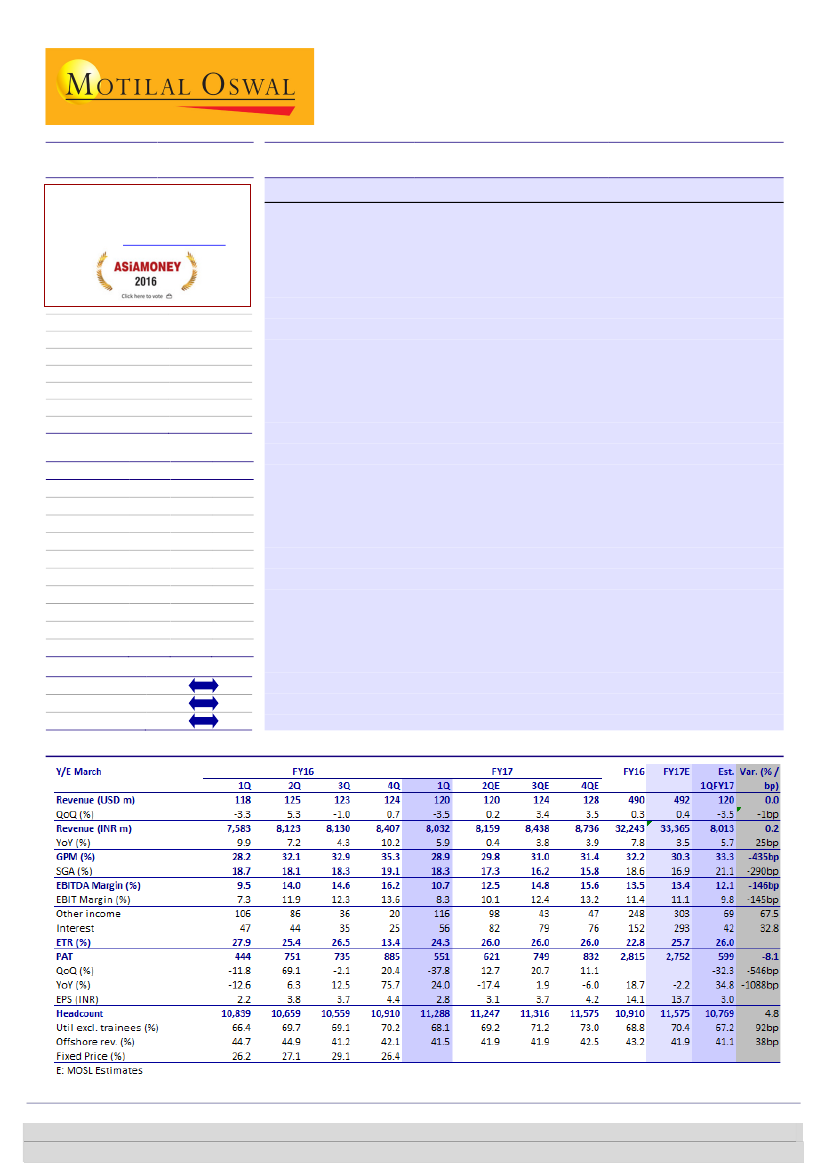
Quarterly Performance (Consolidated)
Revenue decline led by multiple factors:
KPIT’s 1QFY17 revenue of USD120m
(-3.5% QoQ) came in line with our estimate, post management’s guidance of a
weak quarter. The revenue decline was led by aggravated weakness at its top
client (-12% QoQ), pressure in Product Engineering and Energy verticals, and
ERP implementation. The revenue decline, along with wage hikes and
investments, resulted in a margin decline of 550bp QoQ to 10.7%.
Growth recovery not imminent:
Revenue growth recovery in FY17 appears
difficult, especially with the Product Engineering business under pressure.
Moreover, volatility in SAP, ERP pressure in IES and severe weakness at its top
client add to uncertainty around revenue growth revival. Margin resurrection
seen through FY16 fell apart in the absence of revenue growth, which we
believe challenges margin turnaround in FY17.
Cash generation weak as well:
Cash generation too faltered in 1QFY17, with
negative cash flow from operations of INR532m. FCF was at negative INR930m
in the quarter, offsetting FCF improvement seen through FY16. DSO at the end
of the quarter was higher by 7 days at 82.
Revenue revival key to re-rating:
Amid sluggish revenue growth momentum,
upcoming investments and multiple pressure points, we are conservative on
the margins front. We expect margins to decline 30bp in FY17 and expand 50bp
in FY18. Inconsistent revenue performance and consequent volatility in profits
are key drags on KPIT’s valuation multiples. Consequently, we maintain our
Neutral
rating, with a one-year price target of INR160—discounting forward
EPS by 10x.
Investors are advised to refer through important disclosures made at the last page of the Research Report.
Motilal Oswal research is available on www.motilaloswal.com/Institutional-Equities, Bloomberg, Thomson Reuters, Factset and S&P Capital.
Ashish Chopra
(Ashish.Chopra@MotilalOswal.com); +91 22 6129 1530
Sagar Lele
(Sagar.Lele@MotilalOswal.com); +91 22 6129 1531

KPIT Technologies
1QFY17: Revenue growth bogged down by multiple pressure points
KPIT’s 1QFY17 revenue declined by 3.5% QoQ to USD120m, in line with our
expectation, and the guidance provided by the management at the end of the
quarter.
Growth during the quarter was dragged lower by decline in top client, reduced
spend on ERP implementations and pressures in the Product Engineering
business.
In Rupee terms, revenue was INR8,032m, down 4.5% QoQ, v/s our estimate of
INR8,013m (-4.7% QoQ).
Exhibit 1: Revenue decline on pressures in top account and Product Engineering
USD revenue - m
Growth - QoQ (%)
119.8
118.3
115.2
8.5%
5.3%
3.1% 3.1%
109.7
3.6% 1.4%
1.2%
-1.0% 0.7%
-2.3%
-3.2% -3.3%
-3.5%
113.6
112.2
108.8
125.0 126.4
122.4
124.6 123.3 124.2
Source: MOSL, Company
Margin impact greater than anticipated
Gross profit margin declined by 640bp QoQ to 23.2%. And, EBITDA margins
expanded by 550bp QoQ to 10.7%, below our expectation of 12%.
Margins were impacted because of [1] 3.5% revenue decline, [2] Wage hikes (-
250bp), and [3] Higher investments in the form of addition of 30 account
managers.
Utilization declined during the quarter to 68.1% from 70.2% in the previous
quarter. Onsite utilization declined to 89% in 1QFY17, from 90.5% in 4QFY16.
Other expenses during the quarter declined to 18.3% of revenue, from 19.1% in
the previous quarter.
Exhibit 2: Revenue decline and wage hike impact margins
EBITDA margin (%)
18.1
17.4
15.9
16.1
16.4
13.3
17.2
20.7
SGA (%)
18.7
18.1
18.3
19.1
18.3
15.7
15.9
14.4
12.1
15.5
15.4
13.9
4.5
9.5
13.9
14.5
15.7
10.7
Source: MOSL, Company
20 July 2016
2

KPIT Technologies
Other income was at INR116m in 1Q, versus our estimate of INR69m.
Consequently, PAT declined by 41% QoQ to INR551m, against our expectation of
INR599m (-32% QoQ).
Segment-wise performance: Decline significant in Product Engineering and
IES
Growth declined in both America (-6.5% QoQ) and Europe (-2.6% QoQ), while it
grew in APAC to the tune of 3.4% QoQ.
Among SBU’s, the decline in Product Engineering Services was the most
pronounced (-6.6% QoQ), followed by IES (-3.6% QoQ). At the end of the
quarter, the company had indicated there would be pressure in both product
engineering and in ERP implementations. Revenue from Products & Platforms
(telematics solution) declined by 45.6% QoQ.
Amongst verticals, Manufacturing was the only one to grow (2.2% QoQ).
Automotive & Transportation and Energy & Utilities declined by 5.7% and 14.4%
QoQ respectively.
Exhibit 3: Decline seen in both America and Europe
Geographies
America
Europe
APAC
Contr. to
1Q Rev. (%)
67.5
18.4
14.1
Growth –
QoQ (%)
-6.5
-2.6
3.4
Growth –
YoY (%)
2.5
16.0
10.1
Source: Company, MOSL
Exhibit 4: Quarter impacted by Product Engineering and ERP implementation
Lines of Business
IES
Product Engineering Services
Products & Platforms
SAP
BTU
Contr. to
1Q Rev. (%)
35.8
29.4
2.2
24.0
8.6
Growth –
QoQ (%)
-3.6
-6.6
-45.6
2.0
0.9
Growth –
YoY (%)
-2.5
13.3
-17.2
20.6
-7.6
Source: Company, MOSL
Exhibit 5: Energy vertical subdued
Verticals
Automotive & Transportation
Manufacturing
Energy & Utilities
Others
Contr. to
1Q Rev. (%)
38.6
37.5
16.1
7.8
Growth –
QoQ (%)
-5.7
2.2
-14.4
-5.7
Growth –
YoY (%)
11.0
6.5
-8.7
13.2
Source: MOSL, Company
Revenues from the top client declined by 12.3% QoQ during the quarter. The
account has been under pressure for the last five quarters now, although bulk of
the decline has been in 1Q. The outlook for growth in the top client remains
subdued given the difficulties Cummins is facing in multiple areas.
However, the top 2-4 customers grew by 15.1% QoQ and top 6-10 customers
declined by 5.8% QoQ – showing mixed trends in the top 10 customers.
20 July 2016
3

KPIT Technologies
Exhibit 6: Weakness aggravates in top client
Top Clients
Top Client - Cummins
Top 2-5 Clients
Top 6-10 Clients
Contr. to
1Q Rev. (%)
12.8
15.3
12.2
Growth –
QoQ (%)
-11.4
15.1
-5.8
Growth –
YoY (%)
-8.6
-6.4
7.5
Source: Company, MOSL
Exhibit 7: Cummins continues to be under pressure
Top Client (USD m)
4.2
1.6
6.1
3.6 1.9
-1.1 -0.8
-8.2
QoQ Gr (%)
5.4
-1.9 -0.2
-11.4
Exhibit 8: SAP rebound after weak 4Q
SAP (USD m)
-1.4 0.5
3.6
-8.7
8.7
-3.4
4.5
21.3
-27.9
28.3 28.4 26.0 26.9 26.0 28.2 29.5
25.0 27.3 31.9 27.9 28.8
QoQ Gr (%)
17.4
16.8
9.5
-12.5
3.0
-10.2
18.2 18.5 19.6 17.6 18.3 18.6 18.4 18.3 16.8 17.7 17.3 17.3 15.3
Source: MOSL, Company
Change in estimates
Bulk of our estimate revision took place after the management guided for a
weak quarter. Considering our estimates were largely aligned with the update,
revenue growth was in-line, and our revenue estimates have hence seen no
material change over the next two years.
We were however expecting 12% EBITDA margin, factoring in the revenue
decline, wage hike and continued investments in the business. Profitability
though was impacted to a larger extent and we’ve accounted for that.
The major driver for change in estimates is the finance cost resulting out of
additional borrowings. Consequently, we have cut our earnings estimates for
FY17/18E by 0.8/4.4%.
Exhibit 9: Change in estimates
Revised
FY16 FY17E
65.8
67.8
490 492.3
0.3
0.4
13.5
13.4
14.1
13.7
19
-2.4
FY18E
70.0
533.8
8.4
13.9
16
16.4
FY16
65.8
490
0.3
13.5
14.1
19
Earlier
FY17E FY18E
67.7
70.0
492.9 534.7
0.5
8.5
13.4
14.2
13.9
16.7
-1.6
20.7
Change
FY16 FY17E
0.00% 0.10%
0.00% -0.10%
0bp
-10bp
0bp
0bp
0.00% -0.80%
0bp
-80bp
FY18E
0.00%
-0.20%
-10bp
-30bp
-4.40%
-430bp
INR/USD
USD Revenue (m)
USD revenue growth (%)
EBITDA Margin (%)
EPS (INR)
EPS Growth (%)
Source: MOSL, Company
20 July 2016
4

KPIT Technologies
Valuation and view
KPIT has a sharp focus on Automotive Engineering Services, where it has seen
sustained growth over the last few years. Its leadership position in the segment,
and healthy growth potential in the foreseeable future auger well for overall
performance.
However, KPIT’s SAP segment has continued to elude stability – with a
significant slump (28% QoQ) in 4QFY15 revenues, and a strong rebound of 15%
YoY growth in FY16. The shift to cloud through SuccessFactors has hit deal sizes
in the segment and KPIT continues to grapple with the same. It has also started
facing similar issues in IES, leading to tepid growth expectations for both these
segments. As a result, Product Engineering Services remains the sole growth
segment (which is also currently under pressure because of client-specific
issues).
4QFY15’s profitability miss was significant as margins plummeted to the lowest
levels in history. While this was marred by multiple one-offs, the company took
up the objective of profitability improvement and successfully managed to
regain lost ground through FY16. However, this has not sustained and reversed
in 1QFY17 as the company faced revenue growth pressures.
With multiple pressure points on revenue, and the increasing need for
investments, both revenue growth and profitability are expected to be muted.
This dual pressure results in expectations of earnings CAGR of 6.6% over FY16-
18E.
KPIT trades at 9.5xFY17E and 8.2xFY18E EPS. We expect the company to grow its
USD revenues at a CAGR of 4.3% over FY16-18E and EPS at a CAGR of 6.6%
during this period. Contribution to our EPS CAGR comes from EBITDA margin
expansion of 20bp from FY16 to FY18 to 13.9%.
Relatively inferior performance and missing consistency are likely to keep
valuations suppressed, especially in the absence of revenue growth.
Consequently, we maintain our NEUTRAL rating, with a revised one-year price
target of INR160, which discounts forward earnings by 10x.
Key triggers
Improved revenue growth outlook and consistency from segments
Progress on and acceleration in performance in ITS and Revolo
Reflection of growth measures in financial performance
Key risk factors
Continued sluggishness in revenue growth
Risk from increasing adoption of cloud based Oracle services
Failure to resurrect profitability
20 July 2016
5

KPIT Technologies
Exhibit 10: 1-year forward PE band
25
20
15
10
5
0
2.0
10.6
9.9
PE (x)
Peak(x)
Avg(x)
23.1
Min(x)
Exhibit 11: 1-year forward PB band
6.0
5.0
4.0
3.0
2.0
1.0
0.0
2.2
0.5
1.7
PB (x)
Peak(x)
Avg(x)
5.5
Min(x)
Source: Company, MOSL
Exhibit 12: Comparative valuation
Company
Mkt cap
(USD b)
Mphasis
1.7
Mindtree
0.7
KPIT Tech
0.4
Cyient
0.8
Hexaware
1.0
NIIT Tech
0.4
Persistent Sys.
0.8
Zensar
0.7
Rating TP (INR) Upside
(%)
Neutral 560
3.1
Neutral 600
5.3
Neutral 160
20.3
Buy
550
12.9
Neutral 230
5.0
Neutral 530
13.5
Neutral 775
21.1
Buy
1,300 29.4
EPS (INR)
FY16 FY17E FY18E
34.5 37.8 42.4
35.9 32.5 42.5
14.1 13.7 16.0
30.7 34.2 41.6
12.9 13.3 14.9
45.8 41.3 53.4
37.2 39.4 49.4
68.2 77.6 98.2
FY16
15.8
15.9
9.4
15.9
16.9
10.2
17.2
14.7
P/E (x)
FY17E
14.4
17.5
9.7
14.2
16.5
11.3
16.2
13.0
FY18E
12.8
13.4
8.3
11.7
14.7
8.7
13.0
10.2
FY16
12.3
27.4
21.0
16.5
28.9
19.0
19.5
24.0
RoE (%)
FY16-18E CAGR (%)
EPS
FY17E FY18E USD rev.
12.8 14.1
5.8
10.9
21.4 24.3
14.5
8.9
18.0 17.5
4.3
6.6
16.2 17.4
12.9
16.4
27.3 28.8
10.1
7.2
15.2 17.4
7.8
8.0
18.1 21.0
19.5
15.3
22.5 23.9
6.9
20.0
Source: Company, MOSL
20 July 2016
6

KPIT Technologies
Story in charts
Exhibit 13: Offerings focused on select verticals, with mix of
IT and Engg
Automotive &
Transportation
38.6
Manufacturing
Energy & Utilities
37.5
Others
59.1
FY11
Source: Company, MOSL
79.6
FY12
99.0
FY13
Exhibit 14: Auto Engg to be the key growth driver going
forward
Auto & Engg Revenues (USD)
34.6%
24.4%
11.1%
110.1
FY14
147.7
FY15
4.6%
154.5
FY16
YoY growth
34.2%
7.8
16.1
Source: Company, MOSL
Exhibit 15: SAP remains extremely volatile
SAP (USD m)
Exhibit 16: Revenue growth revival not expected in FY17
9.5
16.8
3.0
-12.5
38.6
USD revenue (m)
33.6
YoY growth (%)
-1.4 0.5
3.6
-8.7
8.7
-3.4
17.4
4.5
QoQ Gr (%)
-27.9
28.3 28.4 26.0 26.9 26.0 28.2 29.5 21.3 25.0 27.3 31.9 27.9 28.8
307
FY12
Source: Company, MOSL
410
FY13
8.3
444
FY14
10.1
489
FY15
0.3
490
FY16
0.4
492
FY17E
8.4
534
FY18E
Source: Company, MOSL
Exhibit 17: Margin recovery to be a function of revenue
growth
EBITDA margin
16.3%
13.9%
10.9%
15.7%
13.5%
13.4%
13.9%
Exhibit 18: PAT growth largely a function of margin
expansion
PAT (INR m)
2,976
2,371
3,201
1,996
1,315
2,489
2,749
FY12
FY13
FY14
FY15
FY16
FY17E
FY18E
FY12
FY13
FY14
FY15
FY16
FY17E
FY18E
Source: Company, MOSL
20 July 2016
7

KPIT Technologies
Operating metrics
Exhibit 19: Operating metrics
1QFY15
Geography Analysis (%)
USA
Europe
ROW
LOB Analysis (%)
Integrated Enterprise Solutions
Auto & Engg
SAP
Business Transformation Unit
Customer Details
No. of Customers Added
No. of Active Customers
Customers with a runrate of > $1m
Top Customer - Cummins
Top 5 Customers (%)
Top 10 Customer (%)
Revenue Split (%)
Onsite Revenues
Offshore Revenues
Contract Type (%)
T&M
FP
Debtor Days
HR - Details
Development Team:
Onsite (Avg)
Offshore (Avg)
Onsite FTE
Offshore FTE
Total FTE
Development
Support
Marketing
Total
Utilization (%)
Onsite
Offshore (Incl. Trainees)
69.1
15.8
15.1
2QFY15
66.5
13.7
19.8
3QFY15
67.3
15.5
17.2
4QFY15
64.5
16.9
18.6
1QFY16
69.7
16.7
13.6
2QFY16
67.0
18.2
14.8
3QFY16
69.6
17.5
13.0
4QFY16
68.9
18.0
13.1
1QFY17
67.5
18.4
14.1
40.4
26.3
22.6
10.7
38.0
30.0
22.6
9.4
38.7
29.1
23.3
8.9
38.3
35.1
17.4
9.2
39.0
30.2
21.1
9.7
35.1
31.8
21.9
11.1
34.0
30.2
25.9
9.9
33.8
33.8
22.5
9.9
35.8
31.5
24.0
8.6
3
201
83
15.9
34.3
45.1
3
204
84
14.9
32.1
42.8
3
206
87
14.6
28.6
39.4
2
208
90
14.9
30.1
41.6
2
210
87
14.2
30.7
42.2
2
212
88
14.2
29.7
41.5
3
215
94
14.1
27.2
39.4
3
218
94
13.9
26.8
39.3
2
220
88
12.8
28.1
40.3
57.2
42.8
51.1
48.9
53.5
46.5
52.4
47.6
55.3
44.7
55.1
44.9
58.8
41.2
57.9
42.1
58.5
41.5
71.6
28.4
82
65.1
29.6
80
62.9
33.8
83
63.7
31.3
82
72.9
26.2
85
72.1
27.1
82
70.6
29.1
77
72.9
26.4
75
71.2
28.5
82
1,423
7,224
1,293
5,068
6,361
8,757
568
165
9,490
90.8
70.2
1,456
7,518
1,327
5,383
6,710
9,191
572
170
9,933
91.1
71.6
1,494
7,868
1,348
5,519
6,867
9,541
575
175
10,291
90.2
70.2
1,534
8,317
1,316
5,456
6,772
10,213
586
181
10,980
85.8
65.6
1,564
8,514
1,362
5,654
7,016
10,062
585
192
10,839
87.1
66.4
1,568
8,416
1,430
5,870
7,300
9,883
578
198
10,659
91.2
69.7
1,635
8,190
1,474
5,655
7,129
9,768
586
205
10,559
90.2
69.1
1,643
8,279
1,486
5,813
7,299
10,095
592
223
10,910
90.5
70.2
1,651
8,553
1,470
5,826
7,296
10,450
604
234
11,288
89.0
68.1
Source: Company, MOSL
20 July 2016
8

KPIT Technologies
Financials and Valuations
Key assumption
INR/USD Rate
Revenues (USD m)
Offshore Revenue (%)
Total Headcount
Net Addition
Per capita productivity (USD)
Offshore Utilization (%)
Onsite Utilization (%)
2011
45.7
221.7
57.2
6,514
1,596
34,031
68.5
89.8
2012
48.5
307.3
52.1
7,719
1,205
39,808
72.6
91.9
2013
54.5
410.4
46.2
8,321
602
49,326
73.9
94.1
2014
60.6
444.3
46.0
9,296
975
47,798
72.1
91.1
2015
61.1
489.0
46.5
10,980
1,684
44,536
69.3
89.5
2016
65.8
490.3
43.2
10,910
(70)
44,942
68.8
89.7
2017E
67.8
492.3
41.9
11,575
665
42,533
70.4
90.3
2018E
70.0
533.8
42.5
12,311
736
43,362
73.0
91.5
Income Statement
Y/E Mar
Net Sales
Change (%)
EBITDA
EBITDA Margin (%)
Depreciation
EBIT
2011
10,120
38.3
1,522
15.0
411
1,111
26
18
0
1,103
155
14.0
0
948
948
10.5
2012
14,897
47.2
2,078
13.9
445
1,633
78
128
100
1,784
437
24.5
31
1,315
1,215
28.2
2013
22,386
50.3
3,650
16.3
466
3,184
154
-170
-13
2,847
766
26.9
86
1,996
2,009
65.3
2014
26,940
20.3
4,233
15.7
540
3,693
287
-74
98
3,430
941
27.4
0
2,489
2,391
19.1
2015
29,899
11.0
3,271
10.9
851
2,420
279
345
0
2,486
114
4.6
0
2,371
2,371
-0.8
2016
32,243
7.8
4,402
13.7
691
3,710
152
248
0
3,806
830
21.8
0
2,976
2,976
25.5
2017E
33,365
3.5
4,483
13.4
795
3,689
(INR Million)
2018E
37,368
12.0
5,194
13.9
911
4,284
Interest
Other Income
Extraordinary items
PBT
Tax
Tax Rate (%)
Min. Int. & Assoc. Share
Reported PAT
Adjusted PAT
Change (%)
293
303
0
3,700
951
25.7
0
2,749
2,749
-7.6
273
316
0
4,327
1,126
26.0
0
3,201
3,201
16.4
Balance Sheet
Y/E Mar
Share Capital
Reserves
Net Worth
Minority Interest
Debt
Total Capital Employed
Net Fixed Assets
Investments
Current Assets
Debtors
Cash & Bank
Loans & Adv, Others
Curr Liabs & Provns
Net Current Assets
Total Assets
2011
340
5,692
6,032
64
1,105
7,201
1,581
477
5,719
2,525
2,096
1,097
1,875
3,844
7,201
2012
356
6,769
7,125
334
1,189
8,649
1,853
0
6,983
4,380
1,838
766
4,714
2,269
8,649
2013
386
9,976
10,362
270
1,602
12,235
2,005
2,036
8,005
4,673
1,921
1,412
5,597
2,409
12,235
2014
377
12,360
12,736
0
1,549
14,285
2,161
2,957
10,122
6,743
1,908
1,471
6,949
3,173
14,285
2015
377
12,577
12,954
0
1,211
14,165
2,328
2,136
13,149
6,979
4,228
1,942
8,536
4,613
14,165
2016
383
13,424
13,807
0
2,189
15,996
2,850
2,300
12,777
6,861
4,333
1,583
5,956
6,821
15,996
(INR Million)
2017E
384
16,308
16,692
0
1,754
18,446
3,321
2,524
17,037
7,860
7,239
1,938
8,323
8,715
18,446
2018E
384
19,513
19,897
0
1,154
21,051
3,610
2,732
20,083
8,746
9,180
2,156
9,261
10,822
21,051
20 July 2016
9

KPIT Technologies
Financials and Valuations
Ratios
Y/E Mar
Basic (INR)
EPS
Cash EPS
Book Value
DPS
Payout (incl. Div. Tax.)
Valuation(x)
P/E
Cash P/E
Price / Book Value
EV/Sales
EV/EBITDA
Dividend Yield (%)
Profitability Ratios (%)
RoE
RoCE
RoIC
Turnover Ratios (%)
Fixed Asset Turnover (x)
Debtors (No. of Days)
Leverage Ratios (%)
Net Debt/Equity (x)
2011
5.7
7.7
34.4
0.7
12.3
2012
8.0
9.1
39.0
0.7
8.7
2013
10.6
12.5
52.2
0.9
8.5
2014
12.9
14.9
64.6
1.1
8.6
2015
11.8
16.3
65.7
1.2
10.1
2016
14.1
17.5
69.0
1.5
10.6
2017E
13.7
17.7
83.4
2.0
14.5
2018E
16.0
20.6
99.4
2.0
12.5
0.0
0.0
0.0
0.0
0.0
0.0
19.1
18.2
21.0
6.5
91.1
-0.2
2011
1,522
-305
-574
0
643
-882
-239
207
0
-675
1,203
-96
50
1,158
1,126
970
2,096
16.3
14.4
3.4
1.5
10.9
0.5
18.5
20.6
20.3
8.8
107.3
-0.1
2012
1,978
-103
-870
0
1,005
-3,002
-1,998
174
0
-2,828
65
1,091
405
1,561
-263
2,100
1,838
12.4
10.5
2.5
1.1
6.8
0.7
23.0
30.5
27.2
11.5
76.2
0.0
2013
3,663
-1,377
-1,083
0
1,204
-1,730
-526
-1,769
0
-3,499
1,706
1,192
-148
2,749
454
1,467
1,921
10.2
8.8
2.0
0.9
5.8
0.8
20.5
27.5
23.0
12.9
91.4
0.0
2014
4,135
-1,375
-1,730
0
1,030
-2,023
-994
112
0
-1,912
75
951
-140
886
4
1,904
1,908
11.1
8.0
2.0
0.7
6.7
0.9
18.4
16.8
20.4
13.5
85.2
-0.2
2015
3,271
-121
880
0
4,029
-1,184
2,845
85
0
-1,099
0
-610
-184
-794
2,136
2,092
4,228
9.3
7.5
1.9
0.7
5.2
1.1
21.0
24.3
26.2
12.6
77.7
-0.2
2016
4,402
-1,004
-2,103
0
1,295
-1,214
81
0
0
-1,214
0
318
-2,970
-2,652
-2,571
6,904
4,333
9.5
7.4
1.6
0.6
4.2
1.5
18.0
21.4
24.0
10.9
86.0
-0.3
2017E
4,483
-1,166
1,012
0
4,329
8.2
6.4
1.3
0.4
3.2
1.5
17.5
21.7
27.5
10.9
85.4
-0.4
2018E
5,194
-1,078
-166
0
3,950
-1,200
2,750
0
0
-1,200
0
-873
-2,975
-3,847
-1,097
10,277
9,180
Cash Flow Statement
Y/E Mar
Adjusted EBITDA
Non cash opr. exp (inc)
(Inc)/Dec in Wkg. Cap.
Other operating activities
CF from Op. Activity
(Inc)/Dec in FA & CWIP
Free cash flows
(Pur)/Sale of Invt
Others
CF from Inv. Activity
Inc/(Dec) in Net Worth
Inc / (Dec) in Debt
Divd Paid (incl Tax) & Others
CF from Fin. Activity
(INR Million)
-1,265
3,064
0
0
-1,265
0
-820
-2,376
-3,196
-132
7,371
7,239
Inc/(Dec) in Cash
Add: Opening Balance
Closing Balance
20 July 2016
10

KPIT Technologies
Corporate profile
Company description
KPIT Cummins is a leading technology solutions
partner for global manufacturing corporations, with
special focus on automotive, energy & utilities,
industrial
equipments
and
semiconductor
industries. With over USD463m revenue (LTM) and
9,933 employees, company continues to focus on
its chosen areas to grow, with equal thrust on
organic and inorganic approaches.
Exhibit 1: Sensex rebased
Source: MOSL/Bloomberg
Exhibit 2: Shareholding pattern (%)
Mar-16
16.8
1.7
54.8
26.7
Promoter
DII
FII
Others
Dec-15
17.3
1.9
53.1
27.7
Mar-15
21.7
11.2
31.2
36.0
Source: Capitaline
Exhibit 3: Top holders
Holder Name
Van Dyck
New Horizon Opportunites Master Fund
Acacia Partners, LP
Smallcap World Fund, INC
CX Partners Fund 1 Limited
% Holding
3.9
3.3
3.1
3.0
2.6
Source: Capitaline
Note: FII Includes depository receipts
Exhibit 4: Top management
Name
S B Ravi Pandit
Kishor Patil
R Swaminathan
Designation
Chairman & Group
CEO
Managing Director &
CEO
Company Secretary
Exhibit 5: Directors
Name
Adi Engineer
B V R Subbu
R A Mashelkar
Sachin Tikekar
Name
Alberto Sangiovanni Vincentelli
Lila Poonawalla
Sanjay Kukreja
Anant Talaulicar
*Independent
Source: Capitaline
Exhibit 6: Auditors
Name
BSR & Co LLP
Type
Statutory
Exhibit 7: MOSL forecast v/s consensus
EPS
(INR)
FY17
FY18
MOSL
forecast
13.7
16.0
Consensus
forecast
14.9
17.0
Variation (%)
-7.9
-5.9
Source: Bloomberg
Source: Capitaline
20 July 2016
11

PRODUCT GALLERY
Our recent reports on
KPIT Technologies
Our recent reports on Technology sector
Our recent reports on other Technology companies

KPIT Technologies
NOTES
20 July 2016
13

Disclosures
KPIT
be distributed by it and/or
This document has been prepared by Motilal Oswal Securities Limited (hereinafter referred to as Most) to provide information about the company (ies) and/sector(s), if any, covered in the report and may
Technologies
its
affiliated company(ies). This report is for personal information of the selected recipient/s and does not construe to be any investment, legal or taxation advice to you. This research report does not constitute an offer, invitation or
inducement to invest in securities or other investments and Motilal Oswal Securities Limited (hereinafter referred as MOSt) is not soliciting any action based upon it. This report is not for public distribution and has been furnished to
you solely for your general information and should not be reproduced or redistributed to any other person in any form. This report does not constitute a personal recommendation or take into account the particular investment
objectives, financial situations, or needs of individual clients. Before acting on any advice or recommendation in this material, investors should consider whether it is suitable for their particular circumstances and, if necessary, seek
professional advice. The price and value of the investments referred to in this material and the income from them may go down as well as up, and investors may realize losses on any investments. Past performance is not a guide for
future performance, future returns are not guaranteed and a loss of original capital may occur.
MOSt and its affiliates are a full-service, integrated investment banking, investment management, brokerage and financing group. We and our affiliates have investment banking and other business relationships with a some
companies covered by our Research Department. Our research professionals may provide input into our investment banking and other business selection processes. Investors should assume that MOSt and/or its affiliates are
seeking or will seek investment banking or other business from the company or companies that are the subject of this material and that the research professionals who were involved in preparing this material may educate investors
on investments in such business . The research professionals responsible for the preparation of this document may interact with trading desk personnel, sales personnel and other parties for the purpose of gathering, applying and
interpreting information. Our research professionals are paid on twin parameters of performance & profitability of MOSt.
MOSt generally prohibits its analysts, persons reporting to analysts, and members of their households from maintaining a financial interest in the securities or derivatives of any companies that the analysts cover. Additionally, MOSt
generally prohibits its analysts and persons reporting to analysts from serving as an officer, director, or advisory board member of any companies that the analysts cover. Our salespeople, traders, and other professionals or affiliates
may provide oral or written market commentary or trading strategies to our clients that reflect opinions that are contrary to the opinions expressed herein, and our proprietary trading and investing businesses may make investment
decisions that are inconsistent with the recommendations expressed herein. In reviewing these materials, you should be aware that any or all of the foregoing among other things, may give rise to real or potential conflicts of interest.
MOSt and its affiliated company(ies), their directors and employees and their relatives may; (a) from time to time, have a long or short position in, act as principal in, and buy or sell the securities or derivatives thereof of companies
mentioned herein. (b) be engaged in any other transaction involving such securities and earn brokerage or other compensation or act as a market maker in the financial instruments of the company(ies) discussed herein or act as an
advisor or lender/borrower to such company(ies) or may have any other potential conflict of interests with respect to any recommendation and other related information and opinions.; however the same shall have no bearing
whatsoever on the specific recommendations made by the analyst(s), as the recommendations made by the analyst(s) are completely independent of the views of the affiliates of MOSt even though there might exist an inherent
conflict of interest in some of the stocks mentioned in the research report Reports based on technical and derivative analysis center on studying charts company's price movement, outstanding positions and trading volume, as
opposed to focusing on a company's fundamentals and, as such, may not match with a report on a company's fundamental analysis. In addition MOST has different business segments / Divisions with independent research
separated by Chinese walls catering to different set of customers having various objectives, risk profiles, investment horizon, etc, and therefore may at times have different contrary views on stocks sectors and markets.
Unauthorized disclosure, use, dissemination or copying (either whole or partial) of this information, is prohibited. The person accessing this information specifically agrees to exempt MOSt or any of its affiliates or employees from,
any and all responsibility/liability arising from such misuse and agrees not to hold MOSt or any of its affiliates or employees responsible for any such misuse and further agrees to hold MOSt or any of its affiliates or employees free
and harmless from all losses, costs, damages, expenses that may be suffered by the person accessing this information due to any errors and delays. The information contained herein is based on publicly available data or other
sources believed to be reliable. Any statements contained in this report attributed to a third party represent MOSt’s interpretation of the data, information and/or opinions provided by that third party either publicly or through a
subscription service, and such use and interpretation have not been reviewed by the third party. This Report is not intended to be a complete statement or summary of the securities, markets or developments referred to in the
document. While we would endeavor to update the information herein on reasonable basis, MOSt and/or its affiliates are under no obligation to update the information. Also there may be regulatory, compliance, or other reasons that
may prevent MOSt and/or its affiliates from doing so. MOSt or any of its affiliates or employees shall not be in any way responsible and liable for any loss or damage that may arise to any person from any inadvertent error in the
information contained in this report. MOSt or any of its affiliates or employees do not provide, at any time, any express or implied warranty of any kind, regarding any matter pertaining to this report, including without limitation the
implied warranties of merchantability, fitness for a particular purpose, and non-infringement. The recipients of this report should rely on their own investigations.
This report is intended for distribution to institutional investors. Recipients who are not institutional investors should seek advice of their independent financial advisor prior to taking any investment decision based on this report or for
any necessary explanation of its contents.
Most and it’s associates may have managed or co-managed public offering of securities, may have received compensation for investment banking or merchant banking or brokerage services, may have received any compensation
for products or services other than investment banking or merchant banking or brokerage services from the subject company in the past 12 months.
Most and it’s associates have not received any compensation or other benefits from the subject company or third party in connection with the research report.
Subject Company may have been a client of Most or its associates during twelve months preceding the date of distribution of the research report
MOSt and/or its affiliates and/or employees may have interests/positions, financial or otherwise of over 1 % at the end of the month immediately preceding the date of publication of the research in the securities mentioned in this
report. To enhance transparency, MOSt has incorporated a Disclosure of Interest Statement in this document. This should, however, not be treated as endorsement of the views expressed in the report.
Motilal Oswal Securities Limited is registered as a Research Analyst under SEBI (Research Analyst) Regulations, 2014. SEBI Reg. No. INH000000412
Pending Regulatory inspections against Motilal Oswal Securities Limited:
SEBI pursuant to a complaint from client Shri C.R. Mohanraj alleging unauthorized trading, issued a letter dated 29th April 2014 to MOSL notifying appointment of an Adjudicating Officer as per SEBI regulations to hold inquiry and
adjudge violation of SEBI Regulations; MOSL replied to the Show Cause Notice whereby SEBI granted us an opportunity of Inspection of Documents. Since all the documents requested by us were not covered we have requested to
SEBI vide our letter dated June 23, 2015 to provide pending list of documents for inspection.
List of associate companies of Motilal Oswal Securities Limited -Click
here to access detailed report
Analyst Certification
The views expressed in this research report accurately reflect the personal views of the analyst(s) about the subject securities or issues, and no part of the compensation of the research analyst(s) was, is, or will be directly or
indirectly related to the specific recommendations and views expressed by research analyst(s) in this report. The research analysts, strategists, or research associates principally responsible for preparation of MOSt research receive
compensation based upon various factors, including quality of research, investor client feedback, stock picking, competitive factors and firm revenues
Disclosure of Interest Statement
Analyst ownership of the stock
Served as an officer, director or employee
KPIT Technologies
No
No
A graph of daily closing prices of securities is available at www.nseindia.com and http://economictimes.indiatimes.com/markets/stocks/stock-quotes
Regional Disclosures (outside India)
This report is not directed or intended for distribution to or use by any person or entity resident in a state, country or any jurisdiction, where such distribution, publication, availability or use would be contrary to law, regulation or which
would subject MOSt & its group companies to registration or licensing requirements within such jurisdictions.
For Hong Kong:
This report is distributed in Hong Kong by Motilal Oswal capital Markets (Hong Kong) Private Limited, a licensed corporation (CE AYY-301) licensed and regulated by the Hong Kong Securities and Futures
Commission (SFC) pursuant to the Securities and Futures Ordinance (Chapter 571 of the Laws of Hong Kong) “SFO”. As per SEBI (Research Analyst Regulations) 2014 Motilal Oswal Securities (SEBI Reg No. INH000000412) has
an agreement with Motilal Oswal capital Markets (Hong Kong) Private Limited for distribution of research report in Kong Kong. This report is intended for distribution only to “Professional Investors” as defined in Part I of Schedule 1 to
SFO. Any investment or investment activity to which this document relates is only available to professional investor and will be engaged only with professional investors.” Nothing here is an offer or solicitation of these securities,
products and services in any jurisdiction where their offer or sale is not qualified or exempt from registration. The Indian Analyst(s) who compile this report is/are not located in Hong Kong & are not conducting Research Analysis in
Hong Kong.
For U.S
Motilal Oswal Securities Limited (MOSL) is not a registered broker - dealer under the U.S. Securities Exchange Act of 1934, as amended (the"1934 act") and under applicable state laws in the United States. In addition MOSL is not a
registered investment adviser under the U.S. Investment Advisers Act of 1940, as amended (the "Advisers Act" and together with the 1934 Act, the "Acts), and under applicable state laws in the United States. Accordingly, in the
absence of specific exemption under the Acts, any brokerage and investment services provided by MOSL, including the products and services described herein are not available to or intended for U.S. persons.
This report is intended for distribution only to "Major Institutional Investors" as defined by Rule 15a-6(b)(4) of the Exchange Act and interpretations thereof by SEC (henceforth referred to as "major institutional investors"). This
document must not be acted on or relied on by persons who are not major institutional investors. Any investment or investment activity to which this document relates is only available to major institutional investors and will be
engaged in only with major institutional investors. In reliance on the exemption from registration provided by Rule 15a-6 of the U.S. Securities Exchange Act of 1934, as amended (the "Exchange Act") and interpretations thereof by
the U.S. Securities and Exchange Commission ("SEC") in order to conduct business with Institutional Investors based in the U.S., MOSL has entered into a chaperoning agreement with a U.S. registered broker-dealer, Motilal Oswal
Securities International Private Limited. ("MOSIPL"). Any business interaction pursuant to this report will have to be executed within the provisions of this chaperoning agreement.
The Research Analysts contributing to the report may not be registered /qualified as research analyst with FINRA. Such research analyst may not be associated persons of the U.S. registered broker-dealer, MOSIPL, and therefore,
may not be subject to NASD rule 2711 and NYSE Rule 472 restrictions on communication with a subject company, public appearances and trading securities held by a research analyst account.
For Singapore
Motilal Oswal Capital Markets Singapore Pte Limited is acting as an exempt financial advisor under section 23(1)(f) of the Financial Advisers Act(FAA) read with regulation 17(1)(d) of the Financial Advisors Regulations and is a
subsidiary of Motilal Oswal Securities Limited in India. This research is distributed in Singapore by Motilal Oswal Capital Markets Singapore Pte Limited and it is only directed in Singapore to accredited investors, as defined in the
Financial Advisers Regulations and the Securities and Futures Act (Chapter 289), as amended from time to time.
In respect of any matter arising from or in connection with the research you could contact the following representatives of Motilal Oswal Capital Markets Singapore Pte Limited:
Varun Kumar
Varun.kumar@motilaloswal.com
Contact : (+65) 68189232
Office Address:21 (Suite 31),16 Collyer Quay,Singapore 04931
Kadambari Balachandran
kadambari.balachandran@motilaloswal.com
(+65) 68189233 / 65249115
20 July 2016
Motilal Oswal Tower, Level 9, Sayani Road, Prabhadevi, Mumbai 400 025
Phone: +91 22 3982 5500 E-mail: reports@motilaloswal.com
Motilal Oswal Securities Ltd
14