22 July 2016
1QFY17 Results Update | Sector:
Financials
BSE SENSEX
27,711
S&P CNX
8,510
CMP: INR764
Bharat Financial Inclusion
TP: INR945 (+24%)
Buy
Bloomberg
Equity Shares (m)
M.Cap. (INR b) / (USD b)
52-Week Range (INR)
1, 6, 12 Rel. Per (%)
12M Avg Val (INR M)
Free float (%)
BHAFIN IN
126.3
96.5/1.4
800 / 369
7/45/46
1010
97.4
Financials & Valuation (INR Billion)
Y/E March
NII
PPP
PAT
EPS (INR)
BV/Sh. (INR)
RoE (%)
Valuations
P/E (x)
P/BV (x)
32.1
7.0
15.7
4.9
14.6
3.6
2016 2017E 2018E
5,796 8,116 12,665
4,325 6,056 9,660
3,030 6,214 6,684
23.8
48.8
52.5
108.6 157.4 209.9
6.3
4.5
RoA on AUM (%)
5.1
24.9
36.7
28.6
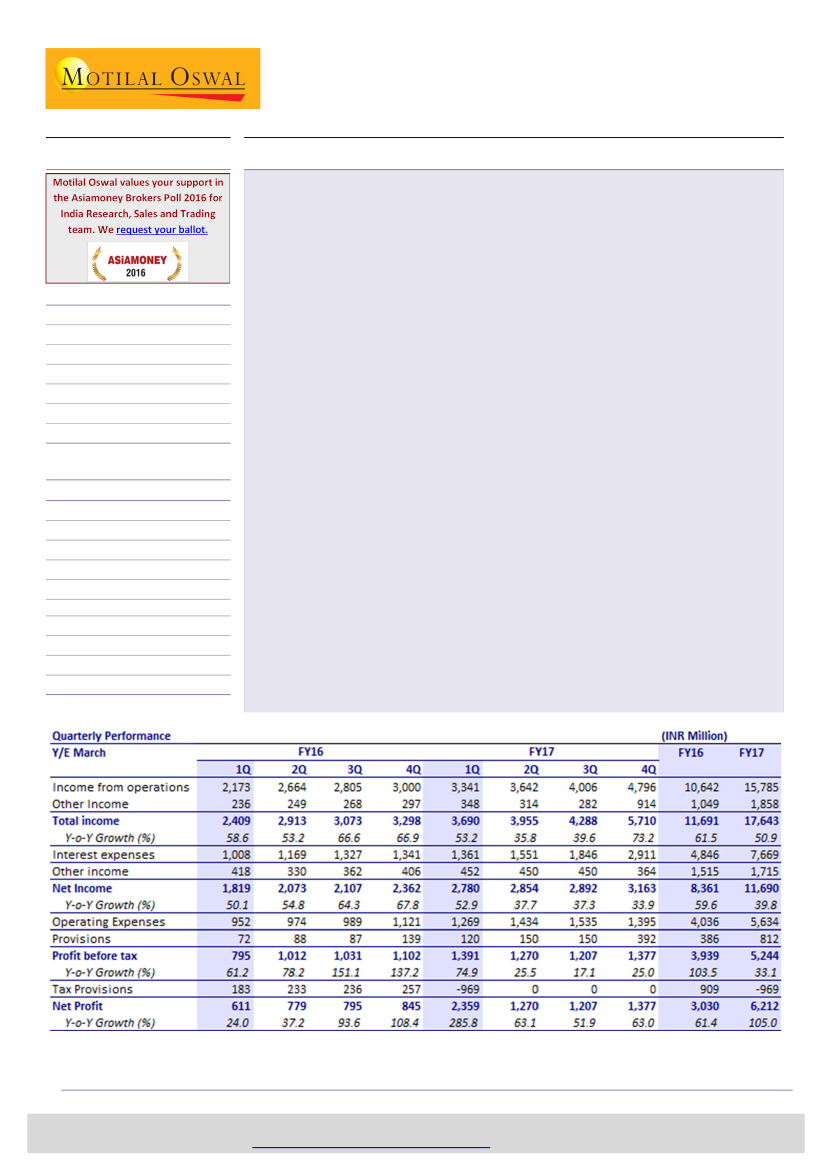
Bharat Financial’s (BHAFIN) 1QFY17 PAT grew 286% YoY and 180% QoQ to INR2.4b
(v/s est. of INR2.0b). Strong AUM growth (76%YoY), improving funding cost
(marginal CoF of 9.7%), lower cost-to-income ratio (down 670p YoY at 45.7%) and
MAT credit entitlement (INR1.3b) were the key highlights for the quarter.
AUM during the quarter grew at a notable pace of 76% YoY and 10% QoQ, driven
by 38% YoY growth in customer additions, coupled with a 25% increase in ticket
size (INR17k) to income generating loans (IGL). Notably, the RBI revised the
regulation allowing for higher ticket sizes, which led to BHAFIN focusing on short-
term loans. Long-term loans constituted 11% of disbursement in the quarter
compared to 24% in 1QFY16. Disbursements continued to grow at a robust pace of
59% YoY to INR37b.
Reported NIM increased 20bp QoQ, but was down 60bp YoY to 10.8% due to a cut
in interest rates last fiscal. However, marginal cost of borrowings now stands at
9.9% v/s 11.5% for 1QFY16. Asset quality improved as absolute GNPA declined
from INR41m to INR35m sequentially. % GNPA stood at 10bp (stable YoY) and
NNPA at 3bp. Strong PAT performance was also driven by operating leverage—
evident from the C/I ratio, which reduced 670bp YoY to 45.7%.
Valuation and view:
Large unmet demand, low competitive intensity, supportive
regulations, a strong balance sheet and best-in-class operating metrics have put
BHAFIN on a high-growth path. BHAFIN trades at 4.8x FY17E and 3.5x FY18E BV.
While valuations appear high, we believe they are justified, given its high medium-
term growth visibility, superior profitability and robust asset quality. Current
valuations should sustain and even improve, given its strong profitability (49% PAT
CAGR over FY16-18), healthy asset quality and capitalization. We increase our
FY17/FY18 estimates by 6.5%/10.5% to account for higher growth. Maintain
Buy
with a target price of INR945 (4.5x FY18E BV).
Sunesh Khanna
(Sunesh.Khanna@MotilalOswal.com); +91 22 3982 5521
Piran Engineer
(Piran.Engineer@MotilalOswal.com); +91 22 3980 4393
Investors are advised to refer through important disclosures made at the last page of the Research Report.
Motilal Oswal research is available on
www.motilaloswal.com/Institutional-Equities,
Bloomberg, Thomson Reuters, Factset and S&P Capital.

Bharat Financial Inclusion
Exhibit 1: Quarterly performance and reason for deviations
Particulars
Net Income
Operating Expenses
PPOP
Provisions
Profit before Tax
Tax Provisions
Net Profit
Int Exp/ operating inc (%)
Other Income / Total Income (%)
Cost to Income Ratio (%)
Tax Rate (%)
E: MOSt Estimates
1QFY17E
2,396
1,234
1,162
140
1,022
-970
1,992
47.6
7.6
51.5
-94.9
1QFY17A
2,780
1,269
1,511
120
1,391
-969
2,359
40.7
9.4
45.7
-69.6
v/s Est.
16
3
30
-14
36
0
18
Comments
Strong AUM growth led to NII beat
Significant improvement in C/I ratio
Lower provision charge
Healthy growth and lower opex led to PAT beat
5.8
Source: Company, MOSL
AUM growth of 76% YoY led by customer addition & increase in ticket size
AUM during the quarter grew at a scorching pace of 76% YoY and 10% QoQ,
driven by 38% YoY growth in customer additions coupled with higher
disbursements in Income Generating Loans (IGL).
Notably, RBI revised the regulation allowing for higher ticket sizes, which led to
BHAFIN focusing on the IGL product. As a result, the share of disbursement of
longer tenure loans decreased to 11% of the total loan book v/s 24% in
1QFY16.
Disbursement grew +59% YoY to INR37.7b, in line with the trend witnessed in
the past few quarters. This was driven by increase in number of customers as
well as a 25% YoY increase in the average incremental ticket size.
Operating leverage led to 670bp reduction in CI to 45.7%
BHAFIN has managed to rein in operating costs. Cost-to-income ratio has
sustained below 50% consistently over the past few quarters.
Cost-income ratio declined 180bps sequentially and 670bp YoY to 45.7%. This
was despite opening of 44 branches in the quarter as compared to 24 branches
in the prior quarter. BHAFIN has a medium-term target of reducing this ratio to
40%.
NIM broadly stable; Marginal cost of funds sub 10%
Reported NIM increased 20bps QoQ, but was down 60bp YoY to 10.8%. YoY
decline was on account of cut in interest rates last fiscal. BHAFIN is now the
lowest interest rate lender among all the MFIs. However, it also commands the
lowest cost of borrowings among all MFIs. Marginal cost of borrowings for the
quarter stood at 9.9% v/s 11.5% for 1QFYFY16. Notably post grant of SFB license,
BHAFIN is the only sizable player amongst MFIs, this resulted in bargaining
power and BHAFIN is able to sell down portfolio at 8%.
Asset quality improved as absolute GNPA declined from INR41m to INR35m
sequentially. %GNPA stood at 10bps (stable YoY) and NNPA at 3bps. Collection
efficiency (Non-AP portfolio) remains a robust 99.8%.
Other highlights:
BHAFIN benefited from a MAT credit entitlement of INR1.29b
during the quarter. Excluding this, the normalized tax rate was 23% c) RoE/RoA
2
22 July 2016

Bharat Financial Inclusion
for 1QFY17 stands at 28.5%/4.3% (adj. for MAT credit); CAR at 23.2% with
leverage of 3.3x.
Valuation and view
The AP-crisis had resulted in a sharp decline in AUM and concurrent increase in
GNPA for the MFI industry, leading to huge losses for the participants. However,
timely RBI intervention led to stable and uniform regulations across the country.
This de-risked the sector and provided a new lease of life to MFI companies,
especially BHAFIN (it had the largest AP portfolio at the time of crisis).
The government has clarified that RBI would continue to be the sole regulator of
the MFI sector and MUDRA, earlier envisaged as the regulator of MFIs, would
now only provide refinancing. The regulatory clarity and continuity bodes well
for the overall sector.
BHAFIN has since witnessed an impressive turnaround, led by strong
performance across operating parameters. The stock has also re-rated in the last
two years. We expect it to continue to grow at a healthy pace, driven by vast
geographic presence, experienced management and efficient operating metrics.
We believe BHAFIN will be a prime beneficiary of underlying growth in the
industry.
With most of its peers busy turning themselves into SFBs, we expect +40% CAGR
in BHAFIN’s AUM over the next 3 years. It would be the fastest growing
company in our Financials coverage – our 3-year PAT CAGR estimate is 46%.
Low competitive intensity, supportive regulations, strong balance sheet, and
best-in class operating metrics have put BHAFIN on a high growth path.
Currently, BHAFIN quotes at 4.8x FY17E and 3.5x FY18E BV. While these
valuations appear high, we note that it has traded at much higher multiples
before the Andhra Pradesh crisis. We believe current valuations are justified,
given high medium-term growth visibility, strong profitability, and superior asset
quality. Current valuations should sustain and could improve, given strong
profitability (49% PAT CAGR over FY16-18), and healthy asset quality and
capitalization. We increase our FY17/FY18 estimates by 6.5%/10.5% to account
for higher growth. Maintain Buy with target price of INR945 (4.5x FY18E BV).
Exhibit 2: We upgrade our estimates to factor in higher growth
INR B
NII
Other Income
Net Income
Operating Expenses
Operating Profits
Provisions
PBT
Tax
PAT
Spreads (%)
RoAA (%)
RoAE (%)
Old Est
FY17
7.4
3.4
10.8
5.3
5.5
0.6
4.9
-1.0
5.8
10.5
6.3
35.5
FY18
11.6
4.1
15.6
6.9
8.8
0.9
7.9
1.8
6.0
11.2
4.7
27.1
Revised Est.
FY17
FY18
8.1
12.7
3.6
4.2
11.7
16.9
5.6
7.3
6.1
9.7
0.8
1.0
5.2
8.7
-1.0
2.0
6.2
6.7
10.3
11.2
6.3
4.5
36.7
28.6
% Change
FY17
FY18
9.9
9.6
8.0
6.0
9.9
7.8
0.0
6.5
8.2
5.4
10.4
10.5
10.5
10.5
22 July 2016
3

Bharat Financial Inclusion
Exhibit 3: Quarterly Snapshot
FY15
FY16
FY17
1QFY15 2QFY15 3QFY15 4QFY15 1QFY16 2QFY16 3QFY16 4QFY16 1QFY17
Profit and Loss (INR m)
Income from operations
Other operating income
Total operating income
Other Income
Total Income
Interest expenses
Net income
Total Opex
Employees
Depreciation and Amrt
Others
Operating profits
Provisions and write offs
Profit before tax
Taxes
Profit after tax
Asset quality (Overall)
Gross NPA
Net NPA
GNPA (%)
NNPA (%)
AUM related
Overall AUM
On balance sheet
1,272
246
1,518
171
1,690
478
1,211
737
539
12
186
475
-19
493
0
493
1,658
243
1,901
109
2,010
671
1,339
780
548
11
220
560
-8
568
0
568
1,635
209
1,844
225
2,069
787
1,282
852
631
11
209
430
20
411
0
411
1,767
209
1,976
286
2,262
854
1,408
836
600
11
225
571
107
464
59
405
2,173
236
2,409
418
2,826
1,008
1,819
952
709
10
233
867
72
795
183
611
2,664
249
2,913
330
3,243
1,169
2,073
974
699
18
257
1,099
88
1,012
233
779
2,805
268
3,073
362
3,434
1,327
2,107
989
715
27
246
1,118
87
1,031
236
795
3,000
297
3,298
406
3,703
1,341
2,362
1,121
801
28
292
1,241
139
1,102
257
845
3,341
348
3,690
452
4,141
1,361
2,780
1,269
949
22
299
1,511
120
1,391
-969
2,359
Variation (%)
QoQ
YoY
11
17
12
11
12
1
18
13
18
-23
2
22
-14
26
-477
179
54
48
53
8
47
35
53
33
34
120
28
74
67
75
-628
286
40
34
0
0
30
19
0.10
0.10
26
18
0.10
0.10
24
13
0.10
0.05
46
22
0
0
75
39
0.20
0.10
63
30
0.10
0.10
41
19
0.10
0.04
35
16
0
0
-15
-16
-24
-27
27,830
20,410
30,430
27,930
31,950
27,250
41,710
29,110
47,970
38,520
54,620
47,530
61,770
50,350
76,770
49,650
84,630
62,270
10
25
76
62
Other details
CAR
Branches
Centers (Sangam)
Loan officers
40
33
35
32
27
25
24
23
23
1,268
1,268
1,268
1,268
1,268
1,268
1,300
1,324
1,368
226,856 228,494 229,172 227,125 220,485 216,723 227,214 246,647 226,307
5,124
5,094
5,104
5,286
5,656
6,066
6,415
6,884
7,914
Source: Company, MOSL
22 July 2016
4

Bharat Financial Inclusion
Story in charts
Exhibit 4: AUM grew at stellar 76% YoY
Gross loan portfolio (INR bn)
YoY Growth (%)
Exhibit 5: Client additions were also strong at 38%
Clients (mn)
YoY Growth (%)
72
49
37
41
19
30
35
47
79
93
84 76
22
24
28
26
22
27
16
12
17
10
7
27
38
28
23.5 23.5 23.6 28.4 27.8 30.4 32.0 41.7 48.0 54.6 61.8 76.8 84.6
2.7 2.8 3.0 3.3 3.3 3.6 3.5 3.6 3.7 3.8 4.2 4.6 5.1
Source: Company, MOSL
Exhibit 6: Ticket size spiked following RBI regulation
Avg Tkt Size (INR)
YoY Growth (%)
Exhibit 7: Cost of borrowing declined to 10.6%
Cost of borrowing (%)
26
14
(4)
(2)
6
(5)
10
1
14
11
29
27
25
Source: Company, MOSL
Exhibit 8: Operating efficiency kicking in; C/I ratio at <50%
79
75 76
Cost/Income Ratio (%)
Exhibit 9: Asset quality remains healthy
GNPA (%)
NNPA (%)
69
61 58
66
59
52
47 47 47 46
0.2
0.2
0.06
0.04
0.1
0.1
0.2
0.2
0.16
0.1 0.1 0.1
0.1 0.1
0.05
0.1
0.2
0.1 0.1 0.1
0.1 0.1
0.04
0.03
Source: Company, MOSL
22 July 2016
5

Bharat Financial Inclusion
Exhibit 10:
Financials:
Valuation metrics
66
Rating
ICICIBC*
HDFCB
AXSB
KMB*
YES
IIB
IDFC Bk
FB
DCBB
JKBK
SIB
Private Aggregate
SBIN (cons)*
PNB
BOI
BOB
CBK
UNBK
OBC
INBK
ANDB
Public Aggregate
Banks Aggregate
HDFC*
LICHF
IHFL
GRHF
REPCO
DEWH
Housing Finance
RECL
POWF
Infra Finance
SHTF
MMFS
BAF
MUTH
SKSM
Asset Finance
NBFC Aggregate
Financials
Buy
Buy
Buy
Buy
Buy
1,168
317
8,710
275
764
Neutral
Neutral
199
207
Buy
Buy
Buy
Buy
Buy
Buy
1,332
503
714
291
835
218
Buy
Neutral
Neutral
Buy
Neutral
Buy
Neutral
UR
Buy
226
124
107
152
252
131
112
148
58
Buy
Buy
Buy
Buy
Buy
Buy
Buy
Neutral
Buy
Neutral
Buy
CMP
(INR)
262
1,228
538
761
1,155
1,136
50
61
100
68
21
Mcap
(USDb)
23.1
47.1
19.4
21.1
7.4
10.2
2.6
1.6
0.4
0.5
0.4
133.9
26.5
3.7
1.4
5.3
2.1
1.4
0.5
1.1
1.8
43.8
177.6
31.9
3.8
4.6
1.6
0.8
1.0
43.6
3.0
4.1
7.1
4.0
2.7
7.1
1.7
1.5
16.9
67.7
245.3
75.5
15.5
24.9
46.2
94.2
18.8
32.0
47.9
59.2
46.8
68.6
49.1
40.1
39.5
68.2
8.3
30.3
29.4
46.3
47.3
84.0
10.7
39.0
36.2
19.3
15.7
9.3
14.7
33.1
26.8
22.1
22.2
2.9
24.3
19.9
23.5
18.7
42.4
36.7
27.9
29.1
8.2
EPS (INR)
FY17
18.1
58.4
35.0
26.1
78.9
50.5
3.0
3.7
7.4
17.6
3.1
P/E (x)
BV (INR)
FY18
159
386
285
239
468
389
46
53
78
162
33
259
220
356
173
537
351
494
320
136
P/BV (x)
RoA (%)
RoE (%)
FY18 FY17 FY18 FY17
20.8
70.3
41.0
33.7
97.3
63.8
4.1
4.5
8.6
21.2
3.7
10.7
8.0
145
332
251
207
391
334
42
50
69
146
30
240
200
337
159
505
318
473
298
129
21.0 17.5
15.4 13.1
29.1 22.6
14.6 11.9
22.5 17.8
16.9 12.2
16.3 13.6
13.5 11.6
3.8
7.0
11.7
7.9
11.6
10.4
7.6
4.9
5.1
6.7
19.8
11.5
3.2
5.8
9.3
6.2
4.6
8.2
5.9
3.6
4.0
5.1
7.1
8.5
194
213
280
28
179
194
336
72
507
119
157
153
FY17 FY18 FY17 FY18 FY17 FY18
1.25
3.70
2.14
3.68
2.96
3.40
1.19
1.22
1.45
0.46
0.72
2.59
1.00
0.62
0.32
0.96
0.50
0.41
0.24
0.50
0.45
0.75
1.61
1.05 1.19 1.22 11.1 11.8
3.18 1.89 1.86 18.9 19.6
1.89 1.45 1.43 14.7 15.2
3.18 1.50 1.70 14.2 15.4
2.47 1.81 1.83 22.0 22.7
2.92 1.92 1.96 16.2 17.6
1.10 1.09 1.12
1.14 0.64 0.65
7.2
7.7
9.4
8.7
1.29 0.98 0.93 11.3 11.7
0.42 0.99 1.05 12.7 13.7
0.66 0.61 0.64 10.7 11.7
2.29
0.92 0.49 0.54
0.56 0.44 0.50
0.30 0.12 0.27
0.88 0.48 0.54
0.47 0.31 0.36
0.37 0.43 0.53
0.23 0.28 0.32
0.46 0.49 0.56
0.43 0.15 0.39
0.70
1.47
3.53 1.89 2.10 20.0 22.1
2.00 1.49 1.51 20.1 20.9
2.27 3.84 3.78 23.4 28.2
3.90 2.14 2.17 18.2 19.8
0.99 1.18 1.20 16.1 17.4
3.67
0.51 2.63 2.55 18.9 18.9
1.94 2.69 2.35 85.1 55.0
0.90
2.01 2.17 2.27 15.7 17.1
2.39 2.14 2.26 13.7 15.0
4.45 3.14 3.02 20.6 21.2
1.55 3.29 3.47 16.7 19.2
3.80 6.28 4.69 35.5 27.1
2.78
2.62
1.67
8.3
8.2
2.8
9.6
6.7
8.7
4.8
7.7
2.3
9.7
9.5
6.8
11.2
8.1
11.0
5.8
9.4
6.2
19.1 16.0
16.5 13.2
23.0 18.4
12.7 10.6
10.5
8.5
35.0 27.3
27.6 21.4
7.4
3.4
4.4
3.9
6.0
2.9
4.2
3.5
581
133
177
201
20.6 17.4
389
107
221
251
315
35
214
221
4.39
2.36
2.55
4.65
1.12
4.16
0.59
2.89
1.11
2.30
2.66
5.34
1.75
4.99
3.08
3.02
1.85
10.25 8.24 2.33 2.34 32.4 33.5
15.5 12.4
20.4 16.9
11.0
8.6
308.1 380.8 28.3 22.9 1,631 1,956
16.5 16.0
19.2 15.7
14.0 12.1
15.7 12.9
*Multiples adj. for value of key ventures/Investments; For ICICI Bank and HDFC Ltd BV is adjusted for investments in subsidiaries
22 July 2016
6

Bharat Financial Inclusion
Financials and valuations
INCOME STATEMENT
Y/E MARCH
Interest Income on books Port.
Interest Expense
Net Financing income
Change (%)
Income from assignment of loans
Net Income (Incl Secur)
Change (%)
Other operating income
Other Income
Net Income
Change (%)
Operating Expenses
Change (%)
Operating Profits
Change (%)
Total Provisions
% to operating income
PBT
Tax
Tax Rate (%)
PAT
Change (%)
Proposed Dividend
BALANCE SHEET
Y/E MARCH
Equity Share Capital
Reserves & Surplus
Networth
Borrowings
Change (%)
Other liabilities
Change (%)
Total Liabilities
Loans
Change (%)
Investments
Net Fixed Assets
Other assets
Total Assets
Assumptions
AUM (INR b)
AUM Growth
Borrowings Growth
Dividend per share
E: MOSL Estimates
2011
10,309
3,495
6,813
44.2
1,194
8,007
40.8
252
941
9,200
37.3
5,129
46.1
4,071
27.6
2,362
58.0
1,709
593
34.7
1,116
-35.8
0
2012
3,589
2,001
1,587
-76.7
346
1,933
-75.9
422
366
2,722
-70.4
4,224
-17.6
-1,503
-136.9
11,735
-781.0
-13,237
369
-2.8
-13,606
-1,318.9
0
2013
2,200
1,427
773
-51.3
580
1,353
-30.0
542
204
2,098
-22.9
2,626
-37.8
-527
-64.9
2,444
-463.7
-2,971
0
0.0
-2,971
-78.2
0
2014
3,930
2,142
1,788
131.4
557
2,345
73.4
702
258
3,306
57.6
2,462
-6.2
844
-260.1
146
17.3
699
0
0.0
699
-123.5
0
2015
5,665
2,790
2,874
60.7
668
3,542
51.0
907
791
5,240
58.5
3,204
30.1
2,036
141.2
100
4.9
1,936
59
3.0
1,877
168.7
0
2016
9,539
4,846
4,693
63.3
1,103
5,796
63.7
1,049
1,515
8,361
59.6
4,036
26.0
4,325
112.4
386
8.9
3,939
909
23.1
3,030
61.4
0
(INR Million)
2017E
2018E
14,173
21,472
7,669
11,070
6,504
10,401
38.6
59.9
1,612
2,263
8,116
12,665
40.0
56.0
1,858
2,432
1,715
1,815
11,690
16,913
39.8
44.7
5,634
7,252
39.6
28.7
6,056
9,660
40.0
59.5
812
979
13.4
10.1
5,244
8,681
-970
1,997
-18.5
23.0
6,214
6,684
105.1
7.6
0
0
2011
723
17,085
17,808
22,359
-17.0
3,097
-23.1
43,264
36,510
22.7
38
311
6,405
43,264
2012
724
3,623
4,347
10,213
-54.3
2,245
-27.5
16,805
9,496
-74.0
2
206
7,101
16,805
2012
16,689
-59.4
-54.3
0.0
2013
1,082
2,822
3,904
16,186
58.5
5,024
123.8
25,115
15,654
64.8
2
113
9,346
25,115
2013
23,590
41.4
58.5
0.0
2014
1,082
3,510
4,592
15,313
-5.4
5,067
0.9
24,972
17,528
12.0
2
112
7,330
24,972
2014
31,128
32.0
-5.4
0.0
2015
1,263
9,202
10,465
32,800
114.2
3,722
-26.5
46,987
29,584
68.8
2
102
17,299
46,987
2015
41,710
34.0
114.2
0.0
2016
1,273
12,557
13,830
51,297
56.4
6,410
72.2
71,537
50,216
69.7
2
165
21,155
71,537
2016
76,770
84.1
56.4
0.0
2017E
1,273
18,771
20,044
94,781
84.8
11,040
72.2
125,865
87,199
73.6
0
265
38,400
125,865
2017E
123,984
61.5
84.8
0.0
2018E
1,273
25,455
26,728
126,624
33.6
19,012
72.2
172,364
116,494
33.6
0
428
55,442
172,364
2018E
169,114
36.4
33.6
10.5
22 July 2016
7

Bharat Financial Inclusion
Financials and valuations
RATIOS
Y/E MARCH
Spreads Analysis (%)
Avg. Yield - on Financing portfolio
Avg. Cost of funds
Interest Spread on Financing portfolio
Net Interest Margin (incl Securitization)
Net Interest Margin (Excl Securitization)
Profitability Ratios (%)
RoE
RoA
Op. Exps./Net Income
Empl. Cost/Op. Exps.
Asset-Liability Profile (%)
Net NPAs to Adv.
Debt/Equity (x)
Average leverage
CAR
Valuations
Book Value (INR)
Price-BV (x)
EPS (INR)
EPS Growth (%)
Price-Earnings (x)
E: MOSL Estimates
2011
32.1
14.2
18.0
19.0
21.2
2012
16.9
12.3
4.6
6.7
7.5
2013
22.0
10.8
11.2
6.7
7.7
2014
29.2
13.6
15.6
8.6
13.3
2015
25.9
12.8
13.1
9.7
13.2
2016
24.2
12.8
11.4
9.8
11.9
2017E
20.8
10.5
10.3
8.1
9.5
2018E
21.2
10.0
11.2
8.6
10.3
8.2
2.7
55.7
63.6
-122.8
-45.3
155.2
61.8
-72.0
-14.2
125.1
65.8
16.4
2.8
74.5
67.2
24.9
5.2
61.1
72.4
24.9
5.1
48.3
72.4
36.7
6.3
48.2
70.1
28.6
4.5
42.9
70.7
1.3
1.3
1.8
45.4
2011
246.2
3.1
15.4
-43.0
49.5
32.1
2.3
1.5
35.4
2012
60.1
12.7
-188.0
-1,318.3
-4.1
0.4
4.1
3.2
33.9
2013
36.1
21.2
-27.5
-85.4
-27.8
0.1
3.3
3.7
27.2
2014
42.4
18.0
6.5
-123.5
118.4
0.1
3.1
3.2
31.7
2015
82.9
9.2
14.9
130.2
51.4
0.0
3.7
3.5
23.1
2016
108.6
7.0
23.8
60.2
32.1
0.0
4.7
4.3
20.9
2017E
157.4
4.9
48.8
105.1
15.7
0.0
4.7
4.7
20.9
2018E
209.9
3.6
52.5
7.6
14.6
22 July 2016
8

Bharat Financial Inclusion
Corporate profile
Company description
Bharat Financial Inclusion (BHAFIN) is the largest
microfinance company in India in terms of gross
loan portfolio. Its core business is providing small
value loans and other basic financial services to its
customers, who are predominantly located in rural
areas. The company extends loans to them mainly
for use in small businesses or for other income
generating activities and not for personal
consumption. As of 3QFY16, BHAFIN had an
overall AUM of over INR60, with active customer
base of 4.2m spread across 1,268 branches.
Exhibit 11: Sensex rebased
Exhibit 12: Shareholding pattern (%)
Mar-16
Promoter
DII
FII
Others
2.7
20.4
56.7
20.3
Dec-15
2.7
17.1
59.5
20.7
Mar-15
9.3
14.4
47.1
29.2
Exhibit 13: Top holders
Holder Name
IDFC Premier Equity Fund
Amansa Holdings Pvt Ltd
Sandstone Investment Partners I
Vinod Khosla
Tree Line Asia Master Fund (Singapore) Pte Ltd
%
Holding
5.3
4.3
4.1
3.3
3.0
Note: FII Includes depository receipts
Exhibit 14: Top management
Name
P H Ravi Kumar
M R Rao
Designation
Chairman (Non-Executive)
Managing Director & CEO
Exhibit 15: Directors
Name
Sumir Chadha
Tarun Khanna*
Paresh D Patel
Geoffrey Tanner Woolley*
P Krishnamurthy*
*Independent
Name
S Balachandran*
Punita Kumar Sinha*
Exhibit 16: Auditors
Name
S R Batliboi & Co LLP
Type
Statutory
Exhibit 17: MOSL forecast v/s consensus
EPS
(INR)
FY17
FY18
MOSL
forecast
48.7
52.5
Consensus
forecast
-
-
Variation
(%)
-
-
22 July 2016
9

SKS MICROFINANCE GALLERY
SKS MICROFINANCE
SKS MICROFINANCE
SECTOR UPDATES

Bharat Financial Inclusion
NOTES
22 July 2016
11

Disclosures
This document has been prepared by Motilal Oswal Securities Limited (hereinafter referred to as Most) to provide information about the company (ies) and/sector(s), if any, covered
Bharat Financial Inclusion
in the report and may be distributed by it and/or its
affiliated company(ies). This report is for personal information of the selected recipient/s and does not construe to be any investment, legal or taxation advice to you. This research report does not constitute an offer, invitation or
inducement to invest in securities or other investments and Motilal Oswal Securities Limited (hereinafter referred as MOSt) is not soliciting any action based upon it. This report is not for public distribution and has been furnished to
you solely for your general information and should not be reproduced or redistributed to any other person in any form. This report does not constitute a personal recommendation or take into account the particular investment
objectives, financial situations, or needs of individual clients. Before acting on any advice or recommendation in this material, investors should consider whether it is suitable for their particular circumstances and, if necessary, seek
professional advice. The price and value of the investments referred to in this material and the income from them may go down as well as up, and investors may realize losses on any investments. Past performance is not a guide for
future performance, future returns are not guaranteed and a loss of original capital may occur.
MOSt and its affiliates are a full-service, integrated investment banking, investment management, brokerage and financing group. We and our affiliates have investment banking and other business relationships with a some
companies covered by our Research Department. Our research professionals may provide input into our investment banking and other business selection processes. Investors should assume that MOSt and/or its affiliates are
seeking or will seek investment banking or other business from the company or companies that are the subject of this material and that the research professionals who were involved in preparing this material may educate investors
on investments in such business . The research professionals responsible for the preparation of this document may interact with trading desk personnel, sales personnel and other parties for the purpose of gathering, applying and
interpreting information. Our research professionals are paid on twin parameters of performance & profitability of MOSt.
MOSt generally prohibits its analysts, persons reporting to analysts, and members of their households from maintaining a financial interest in the securities or derivatives of any companies that the analysts cover. Additionally, MOSt
generally prohibits its analysts and persons reporting to analysts from serving as an officer, director, or advisory board member of any companies that the analysts cover. Our salespeople, traders, and other professionals or affiliates
may provide oral or written market commentary or trading strategies to our clients that reflect opinions that are contrary to the opinions expressed herein, and our proprietary trading and investing businesses may make investment
decisions that are inconsistent with the recommendations expressed herein. In reviewing these materials, you should be aware that any or all of the foregoing among other things, may give rise to real or potential conflicts of interest.
MOSt and its affiliated company(ies), their directors and employees and their relatives may; (a) from time to time, have a long or short position in, act as principal in, and buy or sell the securities or derivatives thereof of companies
mentioned herein. (b) be engaged in any other transaction involving such securities and earn brokerage or other compensation or act as a market maker in the financial instruments of the company(ies) discussed herein or act as an
advisor or lender/borrower to such company(ies) or may have any other potential conflict of interests with respect to any recommendation and other related information and opinions.; however the same shall have no bearing
whatsoever on the specific recommendations made by the analyst(s), as the recommendations made by the analyst(s) are completely independent of the views of the affiliates of MOSt even though there might exist an inherent
conflict of interest in some of the stocks mentioned in the research report
Reports based on technical and derivative analysis center on studying charts company's price movement, outstanding positions and trading volume, as opposed to focusing on a company's fundamentals and, as such, may not
match with a report on a company's fundamental analysis. In addition MOST has different business segments / Divisions with independent research separated by Chinese walls catering to different set of customers having various
objectives, risk profiles, investment horizon, etc, and therefore may at times have different contrary views on stocks sectors and markets.
Unauthorized disclosure, use, dissemination or copying (either whole or partial) of this information, is prohibited. The person accessing this information specifically agrees to exempt MOSt or any of its affiliates or employees from,
any and all responsibility/liability arising from such misuse and agrees not to hold MOSt or any of its affiliates or employees responsible for any such misuse and further agrees to hold MOSt or any of its affiliates or employees free
and harmless from all losses, costs, damages, expenses that may be suffered by the person accessing this information due to any errors and delays. The information contained herein is based on publicly available data or other
sources believed to be reliable. Any statements contained in this report attributed to a third party represent MOSt’s interpretation of the data, information and/or opinions provided by that third party either publicly or through a
subscription service, and such use and interpretation have not been reviewed by the third party. This Report is not intended to be a complete statement or summary of the securities, markets or developments referred to in the
document. While we would endeavor to update the information herein on reasonable basis, MOSt and/or its affiliates are under no obligation to update the information. Also there may be regulatory, compliance, or other reasons that
may prevent MOSt and/or its affiliates from doing so. MOSt or any of its affiliates or employees shall not be in any way responsible and liable for any loss or damage that may arise to any person from any inadvertent error in the
information contained in this report. MOSt or any of its affiliates or employees do not provide, at any time, any express or implied warranty of any kind, regarding any matter pertaining to this report, including without limitation the
implied warranties of merchantability, fitness for a particular purpose, and non-infringement. The recipients of this report should rely on their own investigations.
This report is intended for distribution to institutional investors. Recipients who are not institutional investors should seek advice of their independent financial advisor prior to taking any investment decision based on this report or for
any necessary explanation of its contents.
Most and it’s associates may have managed or co-managed public offering of securities, may have received compensation for investment banking or merchant banking or brokerage services, may have received any compensation
for products or services other than investment banking or merchant banking or brokerage services from the subject company in the past 12 months.
Most and it’s associates have not received any compensation or other benefits from the subject company or third party in connection with the research report.
Subject Company may have been a client of Most or its associates during twelve months preceding the date of distribution of the research report
MOSt and/or its affiliates and/or employees may have interests/positions, financial or otherwise of over 1 % at the end of the month immediately preceding the date of publication of the research in the securities mentioned in this
report. To enhance transparency, MOSt has incorporated a Disclosure of Interest Statement in this document. This should, however, not be treated as endorsement of the views expressed in the report.
Motilal Oswal Securities Limited is registered as a Research Analyst under SEBI (Research Analyst) Regulations, 2014. SEBI Reg. No. INH000000412
Pending Regulatory inspections against Motilal Oswal Securities Limited:
SEBI pursuant to a complaint from client Shri C.R. Mohanraj alleging unauthorized trading, issued a letter dated 29th April 2014 to MOSL notifying appointment of an Adjudicating Officer as per SEBI regulations to hold inquiry and
adjudge violation of SEBI Regulations; MOSL replied to the Show Cause Notice whereby SEBI granted us an opportunity of Inspection of Documents. Since all the documents requested by us were not covered we have requested to
SEBI vide our letter dated June 23, 2015 to provide pending list of documents for inspection.
List of associate companies of Motilal Oswal Securities Limited -Click
here to access detailed report
Analyst Certification
The views expressed in this research report accurately reflect the personal views of the analyst(s) about the subject securities or issues, and no part of the compensation of the research analyst(s) was, is, or will be directly or
indirectly related to the specific recommendations and views expressed by research analyst(s) in this report. The research analysts, strategists, or research associates principally responsible for preparation of MOSt research receive
compensation based upon various factors, including quality of research, investor client feedback, stock picking, competitive factors and firm revenues
Disclosure of Interest Statement
Bharat Financial Inclusion
Analyst ownership of the stock
No
Served as an officer, director or employee -
No
A graph of daily closing prices of securities is available at www.nseindia.com and http://economictimes.indiatimes.com/markets/stocks/stock-quotes
Regional Disclosures (outside India)
This report is not directed or intended for distribution to or use by any person or entity resident in a state, country or any jurisdiction, where such distribution, publication, availability or use would be contrary to law, regulation or which
would subject MOSt & its group companies to registration or licensing requirements within such jurisdictions.
For Hong Kong:
This report is distributed in Hong Kong by Motilal Oswal capital Markets (Hong Kong) Private Limited, a licensed corporation (CE AYY-301) licensed and regulated by the Hong Kong Securities and Futures
Commission (SFC) pursuant to the Securities and Futures Ordinance (Chapter 571 of the Laws of Hong Kong) “SFO”. As per SEBI (Research Analyst Regulations) 2014 Motilal Oswal Securities (SEBI Reg No. INH000000412) has
an agreement with Motilal Oswal capital Markets (Hong Kong) Private Limited for distribution of research report in Kong Kong. This report is intended for distribution only to “Professional Investors” as defined in Part I of Schedule 1 to
SFO. Any investment or investment activity to which this document relates is only available to professional investor and will be engaged only with professional investors.” Nothing here is an offer or solicitation of these securities,
products and services in any jurisdiction where their offer or sale is not qualified or exempt from registration. The Indian Analyst(s) who compile this report is/are not located in Hong Kong & are not conducting Research Analysis in
Hong Kong.
For U.S.
Motilal Oswal Securities Limited (MOSL) is not a registered broker - dealer under the U.S. Securities Exchange Act of 1934, as amended (the"1934 act") and under applicable state laws in the United States. In addition MOSL is not a
registered investment adviser under the U.S. Investment Advisers Act of 1940, as amended (the "Advisers Act" and together with the 1934 Act, the "Acts), and under applicable state laws in the United States. Accordingly, in the
absence of specific exemption under the Acts, any brokerage and investment services provided by MOSL, including the products and services described herein are not available to or intended for U.S. persons.
This report is intended for distribution only to "Major Institutional Investors" as defined by Rule 15a-6(b)(4) of the Exchange Act and interpretations thereof by SEC (henceforth referred to as "major institutional investors"). This
document must not be acted on or relied on by persons who are not major institutional investors. Any investment or investment activity to which this document relates is only available to major institutional investors and will be
engaged in only with major institutional investors. In reliance on the exemption from registration provided by Rule 15a-6 of the U.S. Securities Exchange Act of 1934, as amended (the "Exchange Act") and interpretations thereof by
the U.S. Securities and Exchange Commission ("SEC") in order to conduct business with Institutional Investors based in the U.S., MOSL has entered into a chaperoning agreement with a U.S. registered broker-dealer, Motilal Oswal
Securities International Private Limited. ("MOSIPL"). Any business interaction pursuant to this report will have to be executed within the provisions of this chaperoning agreement.
The Research Analysts contributing to the report may not be registered /qualified as research analyst with FINRA. Such research analyst may not be associated persons of the U.S. registered broker-dealer, MOSIPL, and therefore,
may not be subject to NASD rule 2711 and NYSE Rule 472 restrictions on communication with a subject company, public appearances and trading securities held by a research analyst account.
For Singapore
Motilal Oswal Capital Markets Singapore Pte Limited is acting as an exempt financial advisor under section 23(1)(f) of the Financial Advisers Act(FAA) read with regulation 17(1)(d) of the Financial Advisors Regulations and is a
subsidiary of Motilal Oswal Securities Limited in India. This research is distributed in Singapore by Motilal Oswal Capital Markets Singapore Pte Limited and it is only directed in Singapore to accredited investors, as defined in the
Financial Advisers Regulations and the Securities and Futures Act (Chapter 289), as amended from time to time.
In respect of any matter arising from or in connection with the research you could contact the following representatives of Motilal Oswal Capital Markets Singapore Pte Limited:
Varun Kumar
Varun.kumar@motilaloswal.com
Contact : (+65) 68189232
Office Address:21 (Suite 31),16 Collyer Quay,Singapore 04931
Kadambari Balachandran
kadambari.balachandran@motilaloswal.com
(+65) 68189233 / 65249115
22 July 2016
Motilal Oswal Tower, Level 9, Sayani Road, Prabhadevi, Mumbai 400 025
Phone: +91 22 3982 5500 E-mail: reports@motilaloswal.com
Motilal Oswal Securities Ltd
12