21 July 2016
1QFY17 Results Update | Sector:
Financials
BSE SENSEX
27,711
S&P CNX
8,510
CMP: INR218
TP: INR331 (+52%)
Dewan Housing
Buy
Lower operating expenses sustains robust performance
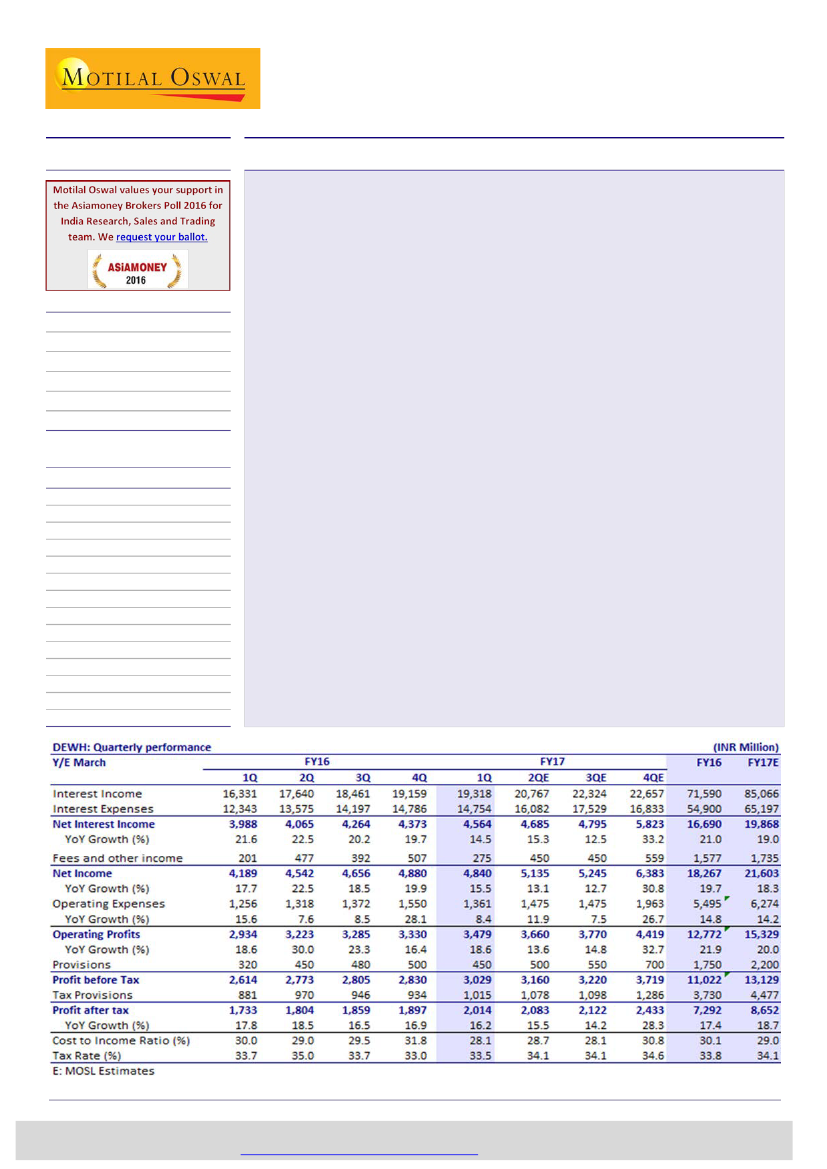
Dewan Housing Finance’s (DEWH) 1QFY17 PAT grew 16.2% YoY to INR2b (inline).
Reduction in cost to income ratio by 190bp YoY to 28.1% - a 33 quarter low. AUM
and disbursements growth remains healthy at +20/26% YoY.
Reduction in cost of funds coupled with shift in the portfolio towards high yielding
segment helped DEWH to maintain margins at 2.9% despite high competitive
intensity in core home loan segment. Cost of funds declined 40bp+ YoY to ~9.5%
Asset quality remained broadly stable, with GNPLs of 98bp v/s 93bp in 1QFY16.
Coverage ratio remains healthy at ~100%.
Annualized repayments rate of 24% v/s run-rate of 18% were due to higher pre-
payments and the changing loan mix toward the non-housing portfolio (which
formed 28% of AUM v/s 25% a year ago).
Other highlights:
(1) There was a negative impact on net worth of INR200m due to
treatment of DTL, and of another INR200m due to amortization of discount of zero
coupon bonds. (2) Average ticket size stood at INR1.29m.
Valuation and view:
DEWH continues to capitalize on its mortgage lending
expertise in an underpenetrated market. We expect AUM growth to remain higher
than industry average at 20%+. In an environment where most of the financials
facing asset quality pressure, mortgage financiers (including DEWH) asset quality
remains impeccable. Margins can improve further with a rating upgrade, reduction
in base/wholesale rates and change in mix towards high yielding loans. Moreover,
management’s commitment to lower cost can provide delta to earnings and
further reduction in C/I ratio will lead to re-rating (key concern for investors). The
stock trades at 1x FY18E P/B and 6.0x P/E, a steep discount compared with other
HFCs. Maintain
Buy
with a TP of INR331 (1.5x FY18E ABV).
Bloomberg
Equity Shares (m)
M.Cap. (INR b) / (USD b)
52-Week Range (INR)
1, 6, 12 Rel. Per (%)
Avg Val (INR m)
DEWH IN
291.4
63.5/0.9
268/141
3/3/-2
341
Financials & Valuation (INR Billion)
Y/E MAR
NII
PPP
Adj. PAT
EPS (INR)
EPS Gr. (%)
BV (INR)
RoAA (%)
RoE (%)
Payout (%)
Valuations
P/E (x)
P/BV (x)
P/ABV (x)
Div. Yld (%)
2016 2017E 2018E
16.6
12.8
7.3
25.0
17.2
171.9
1.2
15.1
37.1
8.7
1.3
1.3
3.7
19.9
15.3
8.7
29.7
18.7
194.1
1.2
16.2
23.2
7.4
1.1
1.1
2.7
24.1
18.8
10.6
36.4
22.7
220.9
1.2
17.5
23.2
6.0
1.0
1.0
3.3
Sunesh Khanna
(Sunesh.Khanna@MotilalOswal.com); +91 22 3982 5521
Piran Engineer
(Piran.Engineer@MotilalOswal.com); +91 22 3980 4393
Investors are advised to refer through important disclosures made at the last page of the Research Report.
Motilal Oswal research is available on
www.motilaloswal.com/Institutional-Equities,
Bloomberg, Thomson Reuters, Factset and S&P Capital.