21 July 2016
1QFY17 Results Update | Sector:
Financials
BSE SENSEX
S&P CNX
27,711
8,510
Motilal Oswal values your support in
the Asiamoney Brokers Poll 2016 for
India Research, Sales and Trading
team. We
request your ballot.
Kotak Mahindra Bank
CMP: INR761
TP: INR866 (+14%)
Buy
In-line, healthy lending business performance; stable asset quality
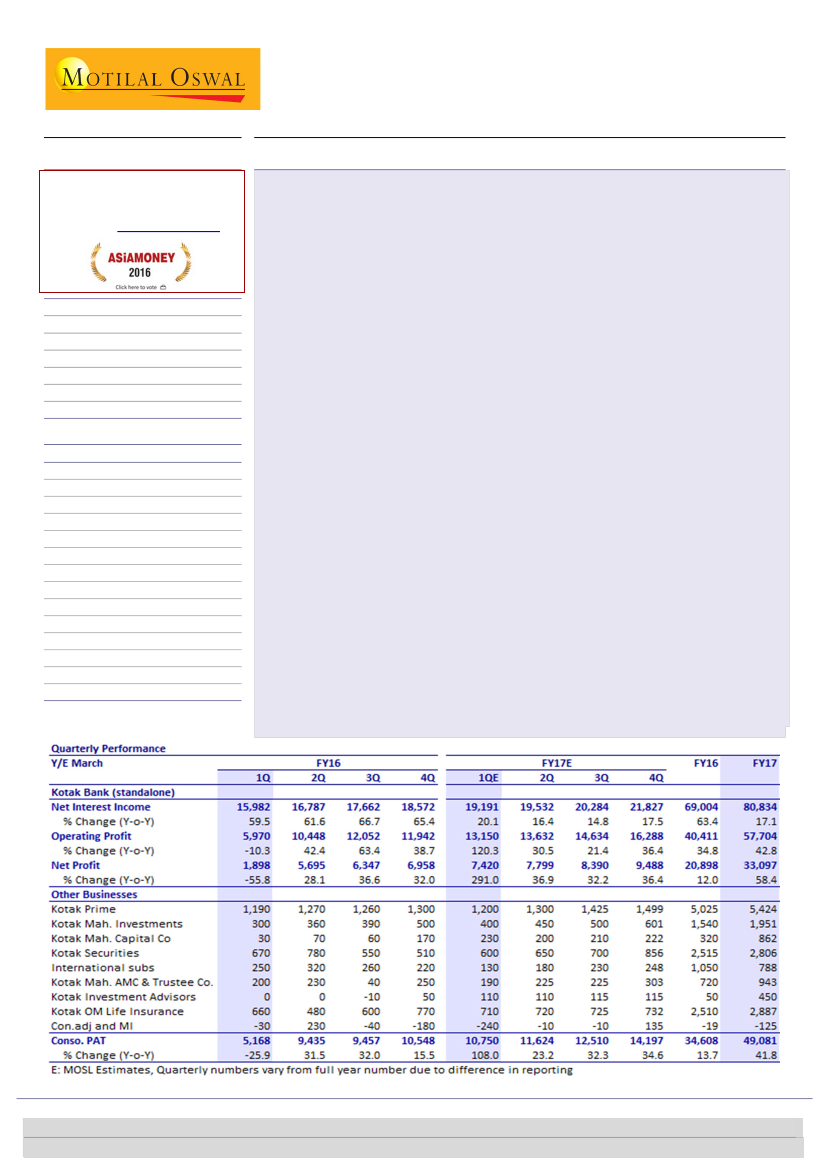
KMB’s standalone results:
PAT grew 3x YoY to INR7.4b (in line with estimates).
Strong core operating performance (+26% YoY), healthy NII growth (20% YoY) on
the back of margin improvement (4.4%), controlled opex growth (adjusted +12%
YoY), and stable asset quality (NSL at 1.3%) were the key highlights. Moderate
wealth management fee was the key drag on fee income (+12% YoY) in the
quarter.
Loans grew 17% YoY (+2% QoQ) led by robust growth in the corporate banking
(+9% QoQ, 22% YoY) and CV (+7% QoQ, 42% YoY) segments. Management
expects 20% growth for FY17.
Other highlights:
a) SMA2 at 39bp; b) SA growth of 34% YoY; c) continued
traction in CV loans (+14% QoQ) and business/personal loans (+9% QoQ).
Other businesses:
a) Profitability at its capital market businesses improved to
INR830m v/s INR680m a quarter ago, led by KMCC (INR230m v/s INR170m); b)
K-Sec market share improved 10bp QoQ to 2.4%; c) overall average AUM
increased 8% QoQ (+18% YoY) – average domestic AUM increased 7% QoQ and
31% YoY, of which equity AUM increased 7% QoQ (34% YoY).
Valuation and view:
Merger with eIVBL places KMB in a sweet spot, with strong
presence across geographies and products, and continued healthy capitalization (T1
of ~16%). The merged entity is India’s fourth largest private sector bank, with a loan
book of INR1.2t and loan market share of 1.7%+. KMB’s premium multiples are likely
to sustain, considering strong growth and operating leverage available across
businesses, and a clean loan portfolio. Comfort on asset quality remains the highest,
with no SDR/5:25, negligible SMA2 and OSRL (13bp). We cut
standalone/consolidated earnings by 3-4% over FY17/18, led by lower revenue
growth, and roll forward the target price. At our SOTP of INR866 (v/s INR863
previously), KMB will trade at 3.6x consolidated BV with cons. ROE of ~15%.
Buy.
Bloomberg
KMB IN
Equity Shares (m)
911.6
M.Cap. (INR b) / (USD b) 1,298.1/20.5
52-Week Range (INR)
790 / 587
1, 6, 12 Rel. Per (%)
-2/-2/7
12M Avg Val (INR M)
1035
Free float (%)
66.3
Financials & Valuation (INR b)
Y/E Mar
2016E 2017E 2018E
NII
69.0 80.8 97.2
OP
40.4 57.7 74.4
NP
20.9 33.1 43.5
34.6 49.1 62.3
Cons.
NP
NIM
(%)
4.1
4.4
4.5
Cons. EPS
18.9 26.8 34.0
EPSG
r. (%)
41.9 26.9
Cons. BV. (INR) 182
207
240
Cons. RoE (%) 10.9 13.8 15.2
RoA (%)
1.1
1.6
1.8
Valuations
P/E(X) (Cons.) 40.3 28.4 22.4
P/BV (X)
4.2
3.7
3.2
Div. Yield (%)
0.0
0.1
0.1
* Proforma merged (KMB+EIVBL )
Alpesh Mehta
(Alpesh.Mehta@MotilalOswal.com); +91 22 6129 1526
Krishnan ASV
(A.Krishnan@MotilalOswal.com);+91 22 6129 1571 /
Dhaval Gada
(Dhaval.Gada@MotilalOswal.com); +91 22 6129 1544
Investors are advised to refer through important disclosures made at the last page of the Research Report.
Motilal Oswal research is available on www.motilaloswal.com/Institutional-Equities, Bloomberg, Thomson Reuters, Factset and S&P Capital.

Kotak Mahindra Bank
Exhibit 1: Quarterly performance v/s our estimates and reasons for deviation (INR m)
Kotak Bank (standalone)
Net Interest Income
% Change (Q-o-Q)
Operating Profit
% Change (Q-o-Q)
Net Profit
% Change (Q-o-Q)
Other Businesses
Kotak Prime
Kotak Mah. Investments
Kotak Mah. Capital Co
Kotak Securities
International subs
Kotak Mah. AMC & Trustee Co.
Kotak Investment Advisors
Kotak OM Life Insurance
Con. adj. and MI
Consol. PAT
% Change (Q-o-Q)
1,200
400
230
600
130
190
110
710
-240
10,750
108.0
1,300
400
50
700
325
225
60
650
-25
11,034
113.5
-3
In-line performance in lending business and mixed
performance at capital market businesses led to the miss
Source: MOSL, Company
9
-8
0
360
-14
-60
-16
Profitability below estimate
In-line
Helped by several equity issuances and corporate actions
Lower trading volumes QoQ partly offset by share increase
1QFY17A
19,191
20.1
13,150
120.3
7,420
291.0
1QFY17E
18,882
18.1
12,970
117.3
7,349
287.2
1
1
v/s Est.
2
Comments
NIMs better than expected; loan growth lower than
expected
Largely in-line
Largely in-line
Lending businesses in line; mixed performance at capital market businesses
K-Sec market improved
10bp QoQ at 2.4% (-30bp
YoY)
Asset management business reported PAT of INR430m vs. INR520m in 4QFY16.
Domestic AMC business PAT decreased to INR190m v/s INR250m a quarter ago.
Overall AUM increased 7% QoQ (+31% YoY); equity AUM also increased 7% QoQ
(+34% YoY).
Capital market related business PAT was at INR8.3b v/s INR6.8b in 4QFY16
(INR7b in 1QFY16) driven by improvement in profitability in investment banking
division. In the securities business, K-sec market share improved 10bp QoQ to
2.4% (v/s 2.7% in 1QFY16).
Life insurance profit increased 8% YoY to INR710m (-8% QoQ).
21 July 2016
2

Kotak Mahindra Bank
Exhibit 2: KMPL: Overall loans grew by 13% YoY (-8% QoQ),
similar to 4QFY16
Auto Loans (INR b)
Other Loans (INR b)
Exhibit 3: Debt funds now account for 41% of overall AUMs,
similar to 1QFY16 (v/s 39% in 4QFY16)
Debt
Offshore Funds
17
16
2
5
52
Equity
Alternate assets
18
18
1
7
47
PMS
Insurance
15
25
1
14
39
8
10 10 10
16
1
5
17
1
6
18
1
6
17
18
20
9
19
19
1
9
43
9
18
22
1
10
40
9
18
7
15
23
1
14
41
6
6
15
22
1
14
42
6
11 10
21
1
14
39
19
1
15
14
14
26
1
12
36
51
48
45
41
Source: MOSL, Company
Exhibit 4: K-Sec: QoQ profitability ticked higher (INR b)
Tot. Inc.
26 26
16
19 18 28 17
8
PAT
26
PATM (%)
33
30
29
29 27
27 28
27
Exhibit 5: K-Sec market share increased 10bp QoQ (%)
2.9 2.9 2.9
2.9
2.5 2.5
2.6
2.7
2.5
2.2
2.4
2.3 2.3
2.3
2.8
2.9
2.7 2.7 2.7
2.4
21
24 23 25
2.7
Source: MOSL, Company
Exhibit 6: Investment Banking: Earnings trend (INR m)
Tot. Inc.
PAT
Exhibit 7: Kotak AMC: Equity AUMs trending higher (INR b)
Eq. AUM
PMS AUM
Offshore AUM
217
210
240
211 215 211
157
132 134 134 143
120 125
102
101 96 99 100 97 102
97
166
82
59 71
31 34 34 28 31 30 36 34 47
7 8 9 10 10 10 11
Source: MOSL, Company
21 July 2016
3

Kotak Mahindra Bank
1QFY17 Conference call highlights
Macro Related
Seeing demand pick-up in construction and road sector; expect faster growth
rate in wholesale and corporate banking business
Expect improvement in liquidity position
Expect LCV growth to be better than last year; MHCV growth is likely to
moderate
Guidance
Credit growth 20%, (b) Credit costs below 50bp and steady state credit costs
would be 30-35bp, (c) NIM 4%+
Integration Related
Technology and retail integration have been completed; 90%+ integration done
Relocating 70-75 branches which are currently at similar locations (largely in
metro market) and expect 1,400 branch network by next calendar year
Working on rationalizing / selling surplus residential apartments
Currently, overall integration costs are less than INR2b
BS Related
Commercial vehicles, construction equipment, credit cards, personal loans are
some of the key areas of growth
P& Related
Half of non-fee income (INR1.7b) is trading gains during the quarter
MF fees are flat on YoY basis – moved to amortizing trail fee income model
Insurance fee income is 4x in 4Q v/s 1Q
Asset Quality Related
GNPA position for the bank is close to peak position
One account amounting to INR1.5b was in SMA2 as of June 30 and has now
been fully recovered
One restructured account has fully paid back
Valuation and view
Buy with SoTP of INR866
(3.6x FY18E Consolidated
BV)
Merger with eIVBL places KMB in a sweet spot with strong presence across
geographies, products and healthy capitalization (tier 1 of ~16%). The merged
entity is the fourth largest private sector bank with a loan book of ~INR1.2t and
market share of ~1.7%+ of loans. Further, KMB’s conglomerate structure places
it in a very sweet position to ride the up-cycle across financial services.
Improvement in macro-economic environment coupled with healthy
capitalization leaves KMB in a strong position to lever on growth opportunities
in the economy. To leverage on its geographical expansion, the management is
focusing on product penetration, with higher emphasis on Agriculture (will help
in priority sector loans), small business loans (untapped opportunity; creating
niche for itself) and mortgage loan. CV loans have bottomed out and likely to
4
21 July 2016

Kotak Mahindra Bank
show traction in ensuing quarters. We have cut estimates by 3-4% for
standalone bank for FY17/18 led by lower than expected revenue growth.
Operating leverage is expected to kick in the expanded underutilized capacity.
We are already seeing benefit of eIVBL network on SA growth (30%+ YoY).
Higher refinancing opportunities, increased product offering on the combined
network and product penetration to eIVBL customers, will keep loan growth
healthy. On a lower base we are factoring loan CAGR of ~21% over FY16-19E.
We expect PPoP (adjusted) CAGR of ~25% over FY16-19E, largely driven by
stable margins and operating leverage. Large part of current year credit cost was
driven by eIVBL portfolio, adjusted for provisions surprised us positively. With
just 39bp of SMA2 accounts, No 5:25 and SDR on balance sheet comfort on
asset quality remains the highest. Management has guided of credit cost of 45-
50bp v/s 82bp in FY16. We expect adjusted PBT CAGR of ~38% over FY16-19E.
Post-merger with eIVBL , share of lending business in steady state profitability is
likely to increase to ~83% - providing much needed stability to earnings. Capital
light nature of capital market and asset management businesses can provide
upside to ROE if there is a strong improvement in business cycle. We expect
consolidated ROEs to improve to ~15% by FY18 on back strong improvement in
banking business ROAs to ~1.8%.
Backed by higher capitalization, diversified business loan book, strong risk
management and presence across financial services KMB historically traded at a
premium multiples to peers despite relatively lower ROE. We are positive on the
business with the expected operating leverage from eIVBL. At our SOTP of
INR866, KMB will trade at 3.6x FY18 Consolidated BV (pro-forma merged basis).
Buy.
Exhibit 8: Kotak Mahindra: SOTP Valuation (FY18-based)
Value
(INR B)
1,416
1,229
149
38
72
41
16
14
56
51
4
46
1,589
1,396
13.8
Value (USD
B)
21.0
18.2
2.2
0.6
1.1
0.6
0.2
0.2
0.8
0.8
0.1
0.7
23.6
20.7
13.8
INR per
share
772
670
81
21
39
22
8
9
30
28
2
25
866
761
13.8
% To Total
89
77
9
2
5
3
1
1
4
3
0
3
100
Rationale
4x FY18E Core NW, ~1.5% RoA and ~14% Core RoE
3x FY18E Net Worth, ~15% Core RoE
3x FY18E Net Worth
5% of FY18E Avg. AUM of INR820b
12% of FY18E AUM of INR136b
5% of FY18E AUM of INR284b
15x FY18E Earnings; Implied ~9x Core BV
1x FY18E Free Networth
Implied 3.6x PBV; ROE of ~15%
Lending Business
Kotak Mahindra Bank
Kotak Prime (Car and other loans)
Kotak Investment Company (LAS)
Asset Management Business
Domestic Mutual Fund
Alternative Assets
Offshore Funds
Capital Markets related Business
Kotak Securities
Kotak Investment Banking (KMCC)
Kotak Life Insurance
Target Value
Current market cap.
Upside (%)
Source: MOSL, Company
21 July 2016
5

Kotak Mahindra Bank
Exhibit 9: We cut standalone earnings for FY17/18E by 3-4% led by lower income growth
INR b
FY17
Net Interest Income 82.5
Other Income
34.5
Total Income
117.0
Operating Expenses 56.8
Operating Profits
60.3
Provisions
8.0
PBT
52.3
Tax
18.0
Standalone PAT
34.2
Consolidated PAT
50.8
Margins (%)
4.4
SA RoA (%)
1.6
Core RoE (%)
13.4
Old Est.
FY18
100.0
42.7
142.6
65.3
77.3
8.2
69.1
23.8
45.3
64.9
4.5
1.8
15.4
FY19
120.4
51.1
171.5
77.0
94.5
10.1
84.4
29.1
55.3
78.9
4.5
1.9
16.2
Revised Est.
FY17 FY18 FY19
80.8
97.2 116.9
32.7
41.4
51.8
113.5 138.6 168.7
55.8
64.2
75.7
57.7
74.4
92.9
7.2
7.9
9.8
50.5
66.5
83.1
17.4
22.9
28.7
33.1
43.5
54.4
49.1
62.3
76.6
4.4
4.5
4.5
1.6
1.8
1.9
13.0
14.9
16.1
FY16
-2.0
-5.4
-3.0
-1.7
-4.2
-10.0
-3.3
-3.3
-3.3
-3.4
-0.7
Change (%)
FY17
-2.8
-3.0
-2.8
-1.7
-3.8
-3.6
-3.8
-3.8
-3.8
-4.0
0.4
FY18
-3.0
1.3
-1.7
-1.7
-1.7
-3.1
-1.5
-1.5
-1.5
-2.9
0.7
Source: MOSL, Company
Exhibit 10: Lending business driving estimates lower
INR b
Old Est.
FY17 FY18 FY19
Kotak Mahindra Bank (Standalone) 34.2 45.3 55.3
Kotak Mahindra Prime
5.7
6.5
7.8
Kotak Mahindra Investments
2.0
2.4
2.9
Lending Business
41.9 54.2 66.0
International subsidiaries
1.6
2.0
2.7
Kotak Mahindra AMC & Trustee Co 0.9
1.2
1.4
Kotak Investment Advisors
0.3
0.3
0.4
Asset Management Business
2.8
3.6
4.5
Kotak Securities
3.1
3.8
4.7
Kotak Mahindra Capital Company 0.4
0.4
0.5
Capital Market Business
3.5
4.3
5.2
Consol. PAT excluding Kotak Life 48.2 62.0 75.7
Kotak OM Life Insurance
2.8
3.0
3.3
Consolidation Adjust.
-0.1 -0.1 -0.1
Consol. PAT Including Kotak Life 50.8 64.9 78.9
Revised Est.
FY17 FY18 FY19
33.1 43.5 54.4
5.4
6.2
7.1
2.0
2.4
2.9
40.5 52.1 64.5
0.8
1.0
1.3
0.9
1.2
1.4
0.5
0.5
0.6
2.2
2.7
3.3
2.8
3.4
4.2
0.9
0.9
0.9
3.7
4.3
5.1
46.3 59.1 72.9
2.9
3.3
3.8
-0.1 -0.1 -0.1
49.1 62.3 76.6
Change (%)
FY17 FY18 FY19
-3.3 -3.8 -1.5
-4.6 -5.1 -9.4
-3.4
-3.9
-2.4
-21
-23
-25
4.6
-3.8
1.0
-4.7
-1.2
-3.6
-3.4 -4.0 -2.9
Source: MOSL, Company
21 July 2016
6

Kotak Mahindra Bank
Exhibit 11: KMB Group: Earnings Estimates
KMB - Consolidated (INR M)
Lending Business
Kotak Mahindra Bank
Kotak Mahindra Prime (car finance)
Kotak Mah Investments (lending)
Capital Market
Kotak Securities
Kotak Investment Banking (KMCC)
Asset Management Business
Kotak AMC and trustee co
International Subsidiaries (AMC and IB)
KMIA (alternative assets management)
Sub Total
Growth YoY
Om Kotak Life Ins (from FY06 Onwards)
Consolidated PAT (Incl Insurance)
Growth YoY
Consolidation Adjustments
Reported PAT Per MI and AFF
Add: MI and Affiliates
Cons Profit Post MI and Affiliates
Growth YoY
*Including ING Vysya Bank
FY2011
14,786
11,367
3,179
240
2,338
1,819
519
1,009
173
509
327
18,133
22.5
1,014
19,147
23.6
269
18,878
-25
18,853
23.3
FY2012
19,415
15,414
3,849
153
1,318
1,258
59
405
154
-110
361
21,137
16.6
2,030
23,167
21.0
99
23,068
-183
22,885
21.4
FY2013
24,380
19,737
4,307
336
1,312
1,145
167
401
35
60
307
26,093
23.4
1,900
27,993
20.8
-179
28,172
-158
28,014
22.4
FY2014
26,930
21,603
4,907
420
1,743
1,603
140
660
410
70
180
29,333
12.4
2,390
31,723
13.3
30
31,693
-466
31,228
11.5
FY2015
30,914
24,776
5,077
1,060
3,030
2,900
130
480
-290
520
250
34,423
17.4
2,290
36,713
15.7
-54
36,767
-196
36,571
17.1
FY2016 FY2017E FY2018E FY2019E
27,462
40,472
52,076
64,469
20,898
33,097
43,545
54,445
5,025
5,424
6,172
7,075
1,540
1,951
2,359
2,948
2,835
3,668
4,293
5,126
2,515
2,806
3,432
4,196
320
862
862
931
1,820
2,181
2,731
3,329
720
943
1,207
1,449
1,050
788
1,024
1,331
50
450
500
550
32,117
46,320
59,100
72,924
-6.7
44.2
27.6
23.4
2,510
2,887
3,319
3,817
34,627
49,206
62,420
76,742
-5.7
42.1
26.9
22.9
316
25
25
25
34,311
49,181
62,395
76,717
278
-100
-100
-100
34,589
49,081
62,295
76,617
-5.4
41.9
26.9
23.0
Source: MOSL, Company
Exhibit 12: Kotak Group Earnings Snapshot (% of total)
% to total profit
Lending Business
Kotak Mahindra Bank
Kotak Mahindra Prime (car finance)
Kotak Mah Investments (lending)
Capital Market
Kotak Securities
Kotak Investment banking (KMCC)
Asset Management Business
Kotak AMC and trustee co
International Subsidiaries (AMC and IB)
KMIA (alternative assets management)
Sub Total
Om Kotak Life Ins
Consolidated PAT (Incl Insurance)
Less: Cons. Adj, MI and Affiliates etc.
Consolidated PAT (Post Adjustments)
*Including ING Vysya Bank
FY2011
78
60
17
1
12
10
3
5
1
3
2
96
5
102
2
100
FY2012
85
67
17
1
6
5
0
2
1
0
2
92
9
101
1
100
FY2013
87
70
15
1
5
4
1
1
0
0
1
93
7
100
0
100
FY2014
86
69
16
1
6
5
0
2
1
0
1
94
8
102
2
100
FY2015
85
68
14
3
8
8
0
1
-1
1
1
94
6
100
0
100
FY2016
79
60
15
4
8
7
1
5
2
3
0
93
7
100
0
100
FY2017E FY2018E FY2019E
82
84
84
67
70
71
11
10
9
4
4
4
7
7
7
6
6
5
2
1
1
4
4
4
2
2
2
2
2
2
1
1
1
94
95
95
6
5
5
100
100
100
0
0
0
100
100
100
Source: MOSL, Company
21 July 2016
7

Kotak Mahindra Bank
Exhibit 13: Financials: Valuation metrics
Rating
66
ICICIBC*
HDFCB
AXSB
KMB*
YES
IIB
IDFC Bk
FB
DCBB
JKBK
SIB
Private Aggregate
SBIN (cons)*
PNB
BOI
BOB
CBK
UNBK
OBC
INBK
ANDB
Public Aggregate
Banks Aggregate
HDFC*
LICHF
IHFL
GRHF
REPCO
DEWH
Housing Finance
RECL
POWF
Infra Finance
SHTF
MMFS
BAF
MUTH
SKSM
Asset Finance
NBFC Aggregate
Financials
Buy
Buy
Buy
Buy
Buy
Buy
Buy
Neutral
Buy
Neutral
Buy
Buy
Neutral
Neutral
Buy
Neutral
Buy
Neutral
UR
Buy
CMP
(INR)
262
1,228
538
761
1,155
1,136
50
61
100
68
21
226
124
107
152
252
131
112
148
58
Mcap
(USDb)
23.1
47.1
19.4
21.1
7.4
10.2
2.6
1.6
0.4
0.5
0.4
133.9
26.5
3.7
1.4
5.3
2.1
1.4
0.5
1.1
1.8
43.8
177.6
31.9
3.8
4.6
1.6
0.8
1.0
43.6
3.0
4.1
7.1
4.0
2.7
7.1
1.7
1.5
16.9
67.7
245.3
EPS (INR)
FY17
18.1
58.4
35.0
26.1
78.9
50.5
3.0
3.7
7.4
17.6
3.1
19.3
15.7
9.3
14.7
33.1
26.8
22.1
22.2
2.9
FY18
20.8
70.3
41.0
33.7
97.3
63.8
4.1
4.5
8.6
21.2
3.7
24.3
19.9
23.5
18.7
42.4
36.7
27.9
29.1
8.2
P/E (x)
FY17
10.7
21.0
15.4
29.1
14.6
22.5
16.9
16.3
13.5
3.8
7.0
19.1
11.7
7.9
11.6
10.4
7.6
4.9
5.1
6.7
19.8
11.5
16.5
23.0
12.7
10.5
35.0
27.6
7.4
20.6
3.4
4.4
3.9
15.5
20.4
28.3
11.0
16.5
19.2
14.0
15.7
FY18
8.0
17.5
13.1
22.6
11.9
17.8
12.2
13.6
11.6
3.2
5.8
16.0
9.3
6.2
4.6
8.2
5.9
3.6
4.0
5.1
7.1
8.5
13.2
18.4
10.6
8.5
27.3
21.4
6.0
17.4
2.9
4.2
3.5
12.4
16.9
22.9
8.6
16.0
15.7
12.1
12.9
BV (INR)
P/BV (x)
RoA (%)
RoE (%)
Buy
Buy
Buy
Buy
Buy
Buy
Neutral
Neutral
Buy
Buy
Buy
Buy
Buy
1,332
503
714
291
835
218
199
207
1,168
317
8,710
275
764
40.1
39.5
68.2
8.3
30.3
29.4
59.2
46.8
75.5
15.5
308.1
24.9
46.2
46.3
47.3
84.0
10.7
39.0
36.2
68.6
49.1
94.2
18.8
380.8
32.0
47.9
FY17 FY18 FY17 FY18 FY17 FY18 FY17 FY18
145 159 1.25 1.05 1.19 1.22 11.1 11.8
332 386 3.70 3.18 1.89 1.86 18.9 19.6
251 285 2.14 1.89 1.45 1.43 14.7 15.2
207 239 3.68 3.18 1.50 1.70 14.2 15.4
391 468 2.96 2.47 1.81 1.83 22.0 22.7
334 389 3.40 2.92 1.92 1.96 16.2 17.6
42
46 1.19 1.10 1.09 1.12 7.2 9.4
50
53 1.22 1.14 0.64 0.65 7.7 8.7
69
78 1.45 1.29 0.98 0.93 11.3 11.7
146 162 0.46 0.42 0.99 1.05 12.7 13.7
30
33 0.72 0.66 0.61 0.64 10.7 11.7
2.59 2.29
240 259 1.00 0.92 0.49 0.54 8.3 9.7
200 220 0.62 0.56 0.44 0.50 8.2 9.5
337 356 0.32 0.30 0.12 0.27 2.8 6.8
159 173 0.96 0.88 0.48 0.54 9.6 11.2
505 537 0.50 0.47 0.31 0.36 6.7 8.1
318 351 0.41 0.37 0.43 0.53 8.7 11.0
473 494 0.24 0.23 0.28 0.32 4.8 5.8
298 320 0.50 0.46 0.49 0.56 7.7 9.4
129 136 0.45 0.43 0.15 0.39 2.3 6.2
0.75 0.70
1.61 1.47
194 221 4.39 3.53 1.89 2.10 20.0 22.1
213 251 2.36 2.00 1.49 1.51 20.1 20.9
280 315 2.55 2.27 3.84 3.78 23.4 28.2
28
35 10.25 8.24 2.33 2.34 32.4 33.5
179 214 4.65 3.90 2.14 2.17 18.2 19.8
194 221 1.12 0.99 1.18 1.20 16.1 17.4
4.16 3.67
336 389 0.59 0.51 2.63 2.55 18.9 18.9
72
107 2.89 1.94 2.69 2.35 85.1 55.0
1.11 0.90
507 581 2.30 2.01 2.17 2.27 15.7 17.1
119 133 2.66 2.39 2.14 2.26 13.7 15.0
1,631 1,956 5.34 4.45 3.14 3.02 20.6 21.2
157 177 1.75 1.55 3.29 3.47 16.7 19.2
153 201 4.99 3.80 6.28 4.69 35.5 27.1
3.08 2.78
3.02 2.62
1.85 1.67
*Multiples adj. for value of key ventures/Investments; For ICICI Bank and HDFC Ltd BV is adjusted for investments in subsidiaries
21 July 2016
8

Kotak Mahindra Bank
Financials and valuations (KMB+EIVBL - Proforma-merged)
Income Statement
Y/E March
Interest Income
Interest Expense
Net Interest Income
Change (%)
Non Interest Income
Net Income
Change (%)
Operating Expenses
Pre Provision Profits
Change (%)
Provisions (excl tax)
PBT
Tax
Tax Rate (%)
PAT
Change (%)
Consolidated PAT (incl VYSB)
Change (%)
2011
68,838
37,798
31,040
15.5
14,355
45,395
15.3
25,793
19,602
1.1
2,887
16,715
5,347
32.0
11,367
41.5
18,853
23.3
2012
100,370
63,162
37,208
19.9
16,471
53,679
18.2
29,450
24,229
23.6
1,688
22,541
7,127
31.6
15,414
35.6
22,885
21.4
2013
129,041
81,598
47,443
27.5
18,875
66,318
23.5
34,825
31,493
30.0
2,758
28,735
8,998
31.3
19,737
28.0
28,014
22.4
2014
139,722
84,991
54,731
15.4
22,668
77,399
16.7
40,353
37,046
17.6
4,545
32,501
10,898
33.5
21,603
9.5
31,228
11.5
2015
155,677
93,876
61,800
12.9
29,119
90,919
17.5
48,711
42,208
13.9
4,723
37,486
12,710
33.9
24,776
14.7
36,571
17.1
2016
163,842
94,838
69,004
11.7
26,122
95,126
4.6
54,715
40,411
-4.3
9,174
31,237
10,339
33.1
20,898
-15.7
34,589
-5.4
2017E
181,777
100,943
80,834
17.1
32,658
113,492
19.3
55,788
57,704
42.8
7,175
50,529
17,433
34.5
33,097
58.4
49,081
41.9
(INR Million)
2018E
208,488
111,286
97,202
20.2
41,416
138,617
22.1
64,187
74,430
29.0
7,949
66,481
22,936
34.5
43,545
31.6
62,295
26.9
2019E
248,559
131,690
116,869
20.2
51,787
168,656
21.7
75,741
92,915
24.8
9,793
83,122
28,677
34.5
54,445
25.0
76,617
23.0
Balance Sheet
Y/E March
Net Worth
Deposits
Change (%)
of which CASA Dep
Change (%)
Borrowings
Other Liabilities & Prov.
Total Liabilities
Current Assets
Investments
Change (%)
Loans
Change (%)
Fixed Assets
Other Assets
Total Assets
2011
2012
2013
2014
2015
2016
2017E
98,261
123,309
144,646
197,401
220,521
239,625
270,793
594,552
737,319
923,628 1,002,891 1,240,148 1,386,430 1,594,395
19.5
24.0
25.3
8.6
23.7
11.8
15.0
192,491
244,498
283,534
325,865
412,995
527,764
644,958
21.1
27.0
16.0
14.9
26.7
27.8
22.2
158,709
222,920
269,219
225,641
205,411
209,753
230,729
47,124
43,125
47,809
54,053
67,119
86,790
104,148
898,646 1,126,673 1,385,301 1,479,986 1,733,198 1,922,598 2,200,064
49,924
58,651
65,226
118,060
97,457
108,797
131,933
281,797
342,823
471,517
422,053
513,313
512,602
538,232
22.6
21.7
37.5
-10.5
21.6
-0.1
5.0
529,314
678,159
802,410
888,565 1,069,718 1,186,653 1,400,251
34.7
28.1
18.3
10.7
20.4
10.9
18.0
9,284
9,508
9,640
16,315
16,204
15,516
15,764
28,326
37,532
36,508
34,994
36,507
99,030
113,884
898,646 1,126,673 1,385,301 1,479,986 1,733,198 1,922,598 2,200,064
(INR Million)
2018E
311,802
1,881,386
18.0
788,500
22.3
276,874
124,977
2,595,039
147,699
592,056
10.0
1,708,306
22.0
16,012
130,967
2,595,039
2019E
363,075
2,295,291
22.0
964,389
22.3
318,406
149,972
3,126,744
190,312
651,261
10.0
2,118,299
24.0
16,261
150,612
3,126,744
Asset Quality
GNPA (INR m)
NNPA (INR m)
GNPA Ratio
NNPA Ratio
PCR (Excl Tech. write off)
E: MOSL Estimates
11,567
3,029
2.15
0.57
73.8
11,771
2,899
1.71
0.43
75.4
13,283
3,205
1.63
0.40
75.9
17,037
6,756
1.90
0.76
60.3
22,884
10,722
2.12
1.00
53.1
28,381
12,620
2.36
1.06
55.5
31,862
14,338
2.25
1.02
55.0
33,120
14,904
1.92
0.87
55.0
(%)
36,955
16,630
1.73
0.79
55.0
21 July 2016
9

Kotak Mahindra Bank
Financials and valuations (KMB+EIVBL - Proforma-merged)
Ratios
Y/E March
Spreads Analysis (%)
Avg. Yield-Earning Assets
Avg. Yield on loans
Avg. Yield on Investments
Avg. Cost-Int. Bear. Liab.
Avg. Cost of Deposits
Interest Spread
Net Interest Margin
Profitability Ratios (%)
RoE
RoA
Consolidated ROE
Other Ratios (%)
Int. Expense/Int.Income
Non Int. Inc./Net Income
Cost/Income
Empl. Cost/Op. Exps.
Loans/Deposit Ratio
CASA Ratio
Investment/Deposit Ratio
2011
9.5
11.4
6.3
5.6
5.2
3.9
4.3
2012
10.8
12.8
7.3
7.4
7.0
3.4
4.0
2013
11.0
13.1
7.8
7.6
7.1
3.5
4.1
2014
10.5
12.4
7.7
7.0
6.8
3.5
4.1
2015
10.5
12.0
7.7
7.0
6.8
3.4
4.2
2016
9.8
11.1
6.7
6.2
6.0
3.5
4.1
2017E
9.8
10.8
7.0
5.9
5.6
3.9
4.4
2018E
9.7
10.5
6.8
5.6
5.3
4.1
4.5
2019E
9.6
10.4
6.8
5.5
5.3
4.1
4.5
13.5
1.4
15.5
14.0
1.5
14.8
14.8
1.6
15.0
12.7
1.5
13.4
11.9
1.5
13.0
9.1
1.1
10.9
13.0
1.6
13.8
14.9
1.8
15.2
16.1
1.9
16.1
54.9
31.6
56.8
53.9
89.0
32.4
47.4
62.9
30.7
54.9
51.7
92.0
33.2
46.5
63.2
28.5
52.5
52.4
86.9
30.7
51.1
60.8
29.3
52.1
51.4
88.6
32.5
42.1
60.3
32.0
53.6
48.9
86.3
33.3
41.4
57.9
27.5
57.5
51.5
85.6
38.1
37.0
55.5
28.8
49.2
49.1
87.8
40.5
33.8
53.4
29.9
46.3
47.8
90.8
41.9
31.5
53.0
30.7
44.9
47.8
92.3
42.0
28.4
Valuation
Standalone Book Value (INR)
Change (%)
Consolidated BV (INR)
Change (%)
Price-BV (x)
Consolidated EPS (INR)
Change (%)
Price-Earnings (x)
Dividend Per Share (INR)
Dividend Yield (%)
E: MOSL Estimates
48.6
76.9
56.1
89.6
65.8
104.6
82.2
126.3
120.4
164.5
4.6
20.1
37.9
0.4
0.0
130.6
8.5
181.6
10.4
4.2
18.9
-6.0
40.3
0.5
0.0
147.6
13.0
207.4
14.2
3.7
26.8
41.9
28.4
0.9
0.1
170.0
15.1
240.0
15.7
3.2
34.0
26.9
22.4
1.2
0.1
197.9
16.4
280.1
16.7
2.7
41.8
23.0
18.2
1.5
0.1
10.6
12.4
14.7
16.0
0.1
0.2
0.2
0.2
21 July 2016
10

Kotak Mahindra Bank
Corporate profile: Kotak Mahindra Bank
Company description
Kotak Mahindra Bank (KMB) is part of the larger
Kotak Mahindra Group led by Mr. Uday Kotak,
Founder and Managing Director of the Bank. The
group has a strong presence across financial
services value chain. Notably, KMB is the only bank
in India’s corporate history to be converted into a
bank from a non-banking finance company. The
bank has pan-India presence with 1,333 branches
and 2,032 ATMs as on March 31, 2016. In 2015,
KMB merged with EIVBL in an all-stock deal.
Exhibit 10: Sensex rebased
Exhibit 14: Shareholding pattern (%)
Mar-16
Promoter
DII
FII
Others
33.7
4.7
35.9
25.7
Dec-15
33.7
4.6
34.6
27.1
Mar-15
40.0
1.9
37.0
21.1
Exhibit 15: Top holders
Holder Name
ING MAURITIUS INVESTMENT I
EUROPACIFIC GROWTH FUND
CANADA PENSION PLAN INVESTMENT BOARD
ANURADHA MAHINDRA
SUMITOMO MITSUI BANKING CORPORATION
% Holding
6.4
5.0
4.9
2.7
1.8
Note: FII Includes depository receipts
Exhibit 16: Top management
Name
Uday Kotak
C Jayaram
Dipak Gupta
Jaimin Bhatt
Shanti Ekambaram
Designation
Executive Vice Chairman & MD
Joint Managing Director
CFO
CPresident Corporate and IB
Exhibit 17: Directors
Name
Shankar Acharya*
C Jayaram
Dipak Gupta
Asim Ghosh*
Amit Desai*
Name
Prakash Apte*
N P Sarda
Uday Kotak
S Mahendra Dev*
Farida Khambata
*Independent
Exhibit 18: Auditors
Name
S B Billimoria & Co
Type
Statutory
Exhibit 19: MOSL forecast v/s consensus
EPS
(INR)
FY17
FY18
MOSL
forecast
26.8
34.0
Consensus
forecast
25.3
32.2
Variation
(%)
5.8
5.5
21 July 2016
11

PRODUCT GALLERY
Our recent reports on Kotak Mahindra Bank
Our recent reports on Financial sector
Our recent reports on other Financial companies

Kotak Mahindra Bank
NOTES
21 July 2016
13

Disclosures
This document has been prepared by Motilal Oswal Securities Limited (hereinafter referred to as Most) to provide information about the company (ies) and/sector(s), if any, covered in the report and may be distributed by it and/or its
Kotak
constitute an offer, invitation
affiliated company(ies). This report is for personal information of the selected recipient/s and does not construe to be any investment, legal or taxation advice to you. This research report does not
Mahindra Bank
or
inducement to invest in securities or other investments and Motilal Oswal Securities Limited (hereinafter referred as MOSt) is not soliciting any action based upon it. This report is not for public distribution and has been furnished to
you solely for your general information and should not be reproduced or redistributed to any other person in any form. This report does not constitute a personal recommendation or take into account the particular investment
objectives, financial situations, or needs of individual clients. Before acting on any advice or recommendation in this material, investors should consider whether it is suitable for their particular circumstances and, if necessary, seek
professional advice. The price and value of the investments referred to in this material and the income from them may go down as well as up, and investors may realize losses on any investments. Past performance is not a guide for
future performance, future returns are not guaranteed and a loss of original capital may occur.
MOSt and its affiliates are a full-service, integrated investment banking, investment management, brokerage and financing group. We and our affiliates have investment banking and other business relationships with a some
companies covered by our Research Department. Our research professionals may provide input into our investment banking and other business selection processes. Investors should assume that MOSt and/or its affiliates are
seeking or will seek investment banking or other business from the company or companies that are the subject of this material and that the research professionals who were involved in preparing this material may educate investors
on investments in such business . The research professionals responsible for the preparation of this document may interact with trading desk personnel, sales personnel and other parties for the purpose of gathering, applying and
interpreting information. Our research professionals are paid on twin parameters of performance & profitability of MOSt.
MOSt generally prohibits its analysts, persons reporting to analysts, and members of their households from maintaining a financial interest in the securities or derivatives of any companies that the analysts cover. Additionally, MOSt
generally prohibits its analysts and persons reporting to analysts from serving as an officer, director, or advisory board member of any companies that the analysts cover. Our salespeople, traders, and other professionals or affiliates
may provide oral or written market commentary or trading strategies to our clients that reflect opinions that are contrary to the opinions expressed herein, and our proprietary trading and investing businesses may make investment
decisions that are inconsistent with the recommendations expressed herein. In reviewing these materials, you should be aware that any or all of the foregoing among other things, may give rise to real or potential conflicts of interest.
MOSt and its affiliated company(ies), their directors and employees and their relatives may; (a) from time to time, have a long or short position in, act as principal in, and buy or sell the securities or derivatives thereof of companies
mentioned herein. (b) be engaged in any other transaction involving such securities and earn brokerage or other compensation or act as a market maker in the financial instruments of the company(ies) discussed herein or act as an
advisor or lender/borrower to such company(ies) or may have any other potential conflict of interests with respect to any recommendation and other related information and opinions.; however the same shall have no bearing
whatsoever on the specific recommendations made by the analyst(s), as the recommendations made by the analyst(s) are completely independent of the views of the affiliates of MOSt even though there might exist an inherent
conflict of interest in some of the stocks mentioned in the research report
Reports based on technical and derivative analysis center on studying charts company's price movement, outstanding positions and trading volume, as opposed to focusing on a company's fundamentals and, as such, may not
match with a report on a company's fundamental analysis. In addition MOST has different business segments / Divisions with independent research separated by Chinese walls catering to different set of customers having various
objectives, risk profiles, investment horizon, etc, and therefore may at times have different contrary views on stocks sectors and markets.
Unauthorized disclosure, use, dissemination or copying (either whole or partial) of this information, is prohibited. The person accessing this information specifically agrees to exempt MOSt or any of its affiliates or employees from,
any and all responsibility/liability arising from such misuse and agrees not to hold MOSt or any of its affiliates or employees responsible for any such misuse and further agrees to hold MOSt or any of its affiliates or employees free
and harmless from all losses, costs, damages, expenses that may be suffered by the person accessing this information due to any errors and delays. The information contained herein is based on publicly available data or other
sources believed to be reliable. Any statements contained in this report attributed to a third party represent MOSt’s interpretation of the data, information and/or opinions provided by that third party either publicly or through a
subscription service, and such use and interpretation have not been reviewed by the third party. This Report is not intended to be a complete statement or summary of the securities, markets or developments referred to in the
document. While we would endeavor to update the information herein on reasonable basis, MOSt and/or its affiliates are under no obligation to update the information. Also there may be regulatory, compliance, or other reasons that
may prevent MOSt and/or its affiliates from doing so. MOSt or any of its affiliates or employees shall not be in any way responsible and liable for any loss or damage that may arise to any person from any inadvertent error in the
information contained in this report. MOSt or any of its affiliates or employees do not provide, at any time, any express or implied warranty of any kind, regarding any matter pertaining to this report, including without limitation the
implied warranties of merchantability, fitness for a particular purpose, and non-infringement. The recipients of this report should rely on their own investigations.
This report is intended for distribution to institutional investors. Recipients who are not institutional investors should seek advice of their independent financial advisor prior to taking any investment decision based on this report or for
any necessary explanation of its contents.
Most and it’s associates may have managed or co-managed public offering of securities, may have received compensation for investment banking or merchant banking or brokerage services, may have received any compensation
for products or services other than investment banking or merchant banking or brokerage services from the subject company in the past 12 months.
Most and it’s associates have not received any compensation or other benefits from the subject company or third party in connection with the research report.
Subject Company may have been a client of Most or its associates during twelve months preceding the date of distribution of the research report
MOSt and/or its affiliates and/or employees may have interests/positions, financial or otherwise of over 1 % at the end of the month immediately preceding the date of publication of the research in the securities mentioned in this
report. To enhance transparency, MOSt has incorporated a Disclosure of Interest Statement in this document. This should, however, not be treated as endorsement of the views expressed in the report.
Motilal Oswal Securities Limited is registered as a Research Analyst under SEBI (Research Analyst) Regulations, 2014. SEBI Reg. No. INH000000412
Pending Regulatory inspections against Motilal Oswal Securities Limited:
SEBI pursuant to a complaint from client Shri C.R. Mohanraj alleging unauthorized trading, issued a letter dated 29th April 2014 to MOSL notifying appointment of an Adjudicating Officer as per SEBI regulations to hold inquiry and
adjudge violation of SEBI Regulations; MOSL replied to the Show Cause Notice whereby SEBI granted us an opportunity of Inspection of Documents. Since all the documents requested by us were not covered we have requested to
SEBI vide our letter dated June 23, 2015 to provide pending list of documents for inspection.
List of associate companies of Motilal Oswal Securities Limited -Click
here to access detailed report
Analyst Certification
The views expressed in this research report accurately reflect the personal views of the analyst(s) about the subject securities or issues, and no part of the compensation of the research analyst(s) was, is, or will be directly or
indirectly related to the specific recommendations and views expressed by research analyst(s) in this report. The research analysts, strategists, or research associates principally responsible for preparation of MOSt research receive
compensation based upon various factors, including quality of research, investor client feedback, stock picking, competitive factors and firm revenues
Disclosure of Interest Statement
Kotak Mahindra Bank
Analyst ownership of the stock
No
Served as an officer, director or employee -
No
A graph of daily closing prices of securities is available at www.nseindia.com and http://economictimes.indiatimes.com/markets/stocks/stock-quotes
Regional Disclosures (outside India)
This report is not directed or intended for distribution to or use by any person or entity resident in a state, country or any jurisdiction, where such distribution, publication, availability or use would be contrary to law, regulation or which
would subject MOSt & its group companies to registration or licensing requirements within such jurisdictions.
For Hong Kong:
This report is distributed in Hong Kong by Motilal Oswal capital Markets (Hong Kong) Private Limited, a licensed corporation (CE AYY-301) licensed and regulated by the Hong Kong Securities and Futures
Commission (SFC) pursuant to the Securities and Futures Ordinance (Chapter 571 of the Laws of Hong Kong) “SFO”. As per SEBI (Research Analyst Regulations) 2014 Motilal Oswal Securities (SEBI Reg No. INH000000412) has
an agreement with Motilal Oswal capital Markets (Hong Kong) Private Limited for distribution of research report in Kong Kong. This report is intended for distribution only to “Professional Investors” as defined in Part I of Schedule 1 to
SFO. Any investment or investment activity to which this document relates is only available to professional investor and will be engaged only with professional investors.” Nothing here is an offer or solicitation of these securities,
products and services in any jurisdiction where their offer or sale is not qualified or exempt from registration. The Indian Analyst(s) who compile this report is/are not located in Hong Kong & are not conducting Research Analysis in
Hong Kong.
For U.S.
Motilal Oswal Securities Limited (MOSL) is not a registered broker - dealer under the U.S. Securities Exchange Act of 1934, as amended (the"1934 act") and under applicable state laws in the United States. In addition MOSL is not a
registered investment adviser under the U.S. Investment Advisers Act of 1940, as amended (the "Advisers Act" and together with the 1934 Act, the "Acts), and under applicable state laws in the United States. Accordingly, in the
absence of specific exemption under the Acts, any brokerage and investment services provided by MOSL, including the products and services described herein are not available to or intended for U.S. persons.
This report is intended for distribution only to "Major Institutional Investors" as defined by Rule 15a-6(b)(4) of the Exchange Act and interpretations thereof by SEC (henceforth referred to as "major institutional investors"). This
document must not be acted on or relied on by persons who are not major institutional investors. Any investment or investment activity to which this document relates is only available to major institutional investors and will be
engaged in only with major institutional investors. In reliance on the exemption from registration provided by Rule 15a-6 of the U.S. Securities Exchange Act of 1934, as amended (the "Exchange Act") and interpretations thereof by
the U.S. Securities and Exchange Commission ("SEC") in order to conduct business with Institutional Investors based in the U.S., MOSL has entered into a chaperoning agreement with a U.S. registered broker-dealer, Motilal Oswal
Securities International Private Limited. ("MOSIPL"). Any business interaction pursuant to this report will have to be executed within the provisions of this chaperoning agreement.
The Research Analysts contributing to the report may not be registered /qualified as research analyst with FINRA. Such research analyst may not be associated persons of the U.S. registered broker-dealer, MOSIPL, and therefore,
may not be subject to NASD rule 2711 and NYSE Rule 472 restrictions on communication with a subject company, public appearances and trading securities held by a research analyst account.
For Singapore
Motilal Oswal Capital Markets Singapore Pte Limited is acting as an exempt financial advisor under section 23(1)(f) of the Financial Advisers Act(FAA) read with regulation 17(1)(d) of the Financial Advisors Regulations and is a
subsidiary of Motilal Oswal Securities Limited in India. This research is distributed in Singapore by Motilal Oswal Capital Markets Singapore Pte Limited and it is only directed in Singapore to accredited investors, as defined in the
Financial Advisers Regulations and the Securities and Futures Act (Chapter 289), as amended from time to time.
In respect of any matter arising from or in connection with the research you could contact the following representatives of Motilal Oswal Capital Markets Singapore Pte Limited:
Varun Kumar
Varun.kumar@motilaloswal.com
Contact : (+65) 68189232
Office Address:21 (Suite 31),16 Collyer Quay,Singapore 04931
Kadambari Balachandran
kadambari.balachandran@motilaloswal.com
(+65) 68189233 / 65249115
21 July 2016
Motilal Oswal Tower, Level 9, Sayani Road, Prabhadevi, Mumbai 400 025
Phone: +91 22 3982 5500 E-mail: reports@motilaloswal.com
Motilal Oswal Securities Ltd
14