23 July 2016
Results Update | Sector: Technology
Mphasis
Neutral
BSE SENSEX
27,803
S&P CNX
8,541
CMP: INR540
TP: INR570 (+6%)
Motilal Oswal values your support in
the Asiamoney Brokers Poll 2016 for
India Research, Sales and Trading
team. We
request your ballot.
Sanguine deal signings…
…lend confidence to continued traction in Direct International channel
Delivering in the focus areas:
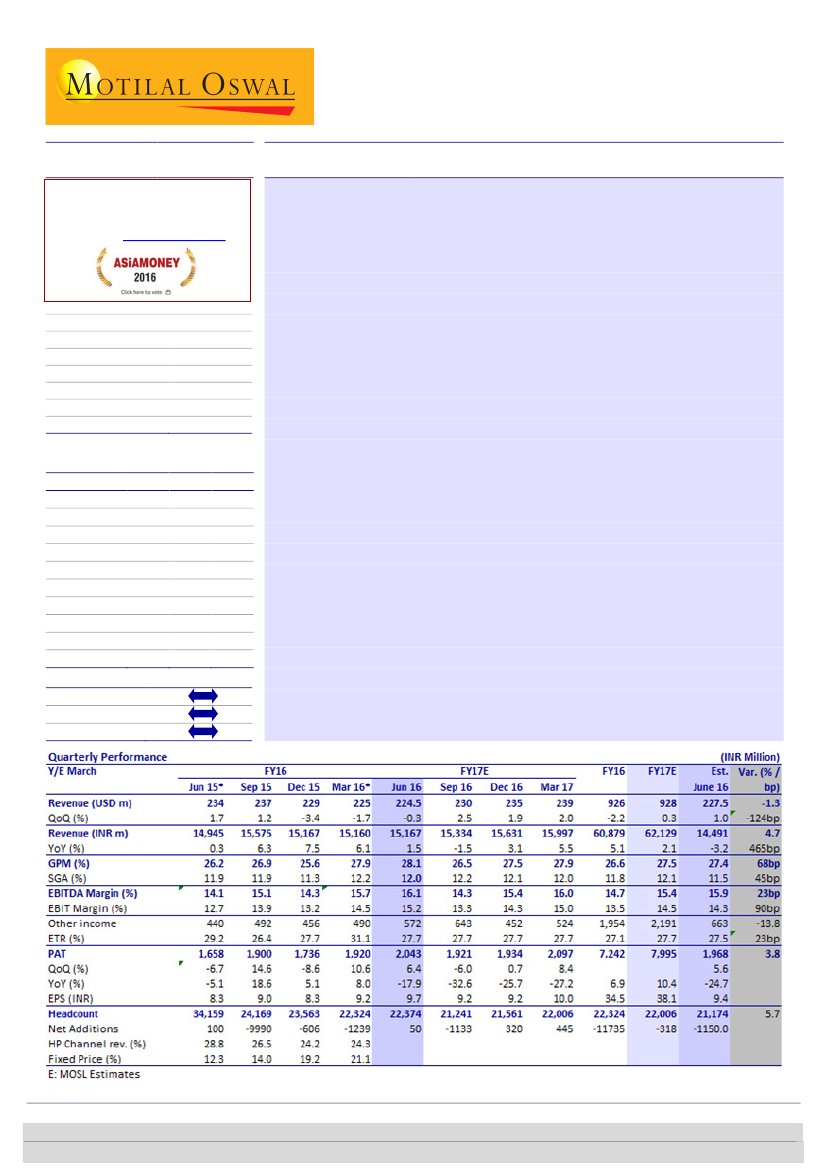
MPHL reported revenue decline of 0.3% QoQ to
USD225m in 1QFY17 (compared to our estimate of USD227.5m). Direct International
(ex. Digital Risk) segment grew 2.1% QoQ, continuing the momentum in its focus area.
Overall performance was weighed upon by decline in the HP channel (-4.2% QoQ),
Bloomberg
Equity Shares (m)
M.Cap.(INRb)/(USDb)
52-Week Range (INR)
1, 6, 12 Rel. Per (%)
Avg Val, INRm
Free float (%)
MPHL IN
210.2
113.9 / 1.7
622 / 382
-4/6/28
129
39.5
decline in the Direct emerging business (-8.5% QoQ) and flat revenue in Digital Risk.
Deal signings of USD90m during the quarter, higher than the run-rate seen in FY16
(total of USD303m TCV in FY16), lend confidence and visibility of growth.
HP Channel to stabilize in 2QFY17:
The management has been indicating stabilization
of the HP Channel 2Q onwards. In 1QFY17, revenue from the HP channel declined by
4.2% QoQ to USD52m. The MSA provides visibility for USD990m in revenue over a five
year period, which would imply stability at ~USD50m. MPHL does not expect HPE’s
merger with CSC to impact the MSA with HP.
Financials & Valuations (INR b)
2016 2017E
Y/E Mar
60.9
62.1
Net Sales
9.0
9.6
EBITDA
7.2
8.0
NP
34.5
38.1
EPS (INR)
6.8
10.6
EPS Gr. (%)
299.4 294.3
BV/Sh. (INR)
12.3
12.8
RoE (%)
11.2
12.0
RoCE (%)
15.7
14.2
Payout (%)
1.8
1.8
Div. Yield
2018E
71.9
11.4
8.9
42.4
11.3
310.3
14.0
13.5
12.8
1.7
Margin beat amid improving mix:
EBIT margin expanded by 70bp QoQ to 15.2%, above
our estimate of 14.3%; reaching mid-point of the guided range of 14-16%. While the
bettering revenue mix is aiding margin expansion, this quarter also benefited from a
24% reduction in depreciation expense to the tune of 30bp. Although 2Q will be
negatively impacted by wage hikes, the overall revenue mix change is on track to keep
the direction right through the course of the year.
Valuation and view:
Direct International (ex. Digital Risk) has been growing above
industry average, and drag on overall performance from HP is easing. At the same time,
the reduction in Direct Emerging business and volatility in Digital Risk have been
keeping overall revenue growth under check. We expect revenue CAGR of 6.1% and
EPS CAGR of 11.0% over FY16-18E. Our target price of INR570 discounts forward
operating PAT by 12x added to net cash of INR130/share.
Neutral.
Estimate change
TP change
Rating change
Investors are advised to refer through important disclosures made at the last page of the Research Report.
Motilal Oswal research is available on www.motilaloswal.com/Institutional-Equities, Bloomberg, Thomson Reuters, Factset and S&P Capital.
Ashish Chopra
(Ashish.Chopra@MotilalOswal.com); +91 22 6129 1530
Sagar Lele
(Sagar.Lele@MotilalOswal.com); +91 22 6129 1531

Mphasis
Revenues: Healthy growth in the direct international business
MPHL’s 1QFY17 reported revenue declined by 0.3% QoQ to USD225m. The
decline stemmed out of: [1] 4.2% decline in HP channel, and [2] 8.5% decline in
the Direct Emerging markets business.
The Direct International business (ex. Digital Risk) grew by 2.1% QoQ and
continued the momentum seen over the last six quarters.
The company signed deals with a TCV of USD90m during the quarter, which is
stronger than the deal signings in FY16, wherein the company had won deals
with a TCV of USD303m, providing for good visibility for sustenance of traction.
Post Digital Risk’s decline in 1HFY16, it has stabilized in 1QFY17. It clocked flat
revenue at ~USD35m.
HP Channel declined 4.2% QoQ in dollar terms to USD52m. It is expected to
stabilize in 2QFY17, post the renewed MSA coming into effect, after the
completion of the transaction between HPE and Blackstone.
Exhibit 1: Revenue decline led by HP channel, and domestic business
Revenue (USD m)
237
263
11.0
-4.5
265
1.0
260
255
-1.9
1.1
172
250
239
226
Growth (%)
228
0.8
-3.1
-4.2
-5.4
234
2.7
237
1.1
-3.4
229
225
-1.6
224
-0.3
-2.1
Mar 14*: 2M quarter, Jun-14 growth number normalized for comparisonSource: MOSL, Company
Exhibit 2: HP channel likely to stabilize 2QFY17 onwards
Revenues from HP channel - USDm (LHS)
140.0
120.0
100.0
80.0
60.0
40.0
20.0
-
(1.9)
(5.5)
(1.9)
(3.5)
(4.8)
(8.5) (8.9)
(9.2)
(8.6)
(8.2)
(11.8)
QoQ growth - % (RHS)
(1.2)
(5.5)
(4.2)
(6.8)
-
(2.0)
(4.0)
(6.0)
(8.0)
(10.0)
(12.0)
(14.0)
Mar 14*: 2M quarter, Jun-14 growth number normalized for comparisonSource: MOSL, Company
23 July 2016
2

Mphasis
Exhibit 3: Continued traction in Direct International (ex. Digital Risk) over the last four
quarters
Revenues from Direct Internation (ex. Digital Risk) (USDm)
150.0
100.0
50.0
-
(1.5)
5.3
(0.9)
1.2 1.6 1.0 0.8 0.8 1.4
11.3
5.9
QoQ growth - % (RHS)
15.0
10.0
4.0 3.9 3.0
2.1
5.0
-
(5.0)
Mar 14*: 2M quarter, Jun-14 growth number normalized for comparisonSource: MOSL, Company
1QFY17 Profitability: Changing mix improving profitability
EBIT margin expanded by 70bp during the quarter to 15.2%, ahead of our
estimate of 14.3%.
Gross margin was 28.1%, +20bp QoQ. SGA was lower at 12%, v/s 12.2% in the
previous quarter. Together these two contributed to +40bp QoQ to EBIT
margins.
Depreciation expense was lower by 24% QoQ at INR137m. This led to a further
30bp expansion at the EBIT level.
Excluding this too, profitability was a tad better than we expected. EBITDA
margins in 1QFY17 were at 16.1% (+40bp), versus our expectation of +20bp.
The growth seen in the direct international business and better revenue mix
resulting out of the hiving off of the domestic BPO business have been resulting
in better profitability for MPHL.
Adjusted PAT grew by 6.4% QoQ to INR2.04b, compared to our estimate of
INR1.97b, on account of margin beat, and lower depreciation.
The company didn’t announce a dividend in the quarter. Likely corporate actions
in the form of payment of special dividend or buyback will be undertaken by the
new Board that will come into action post the closure of the transaction
between HPE and Blackstone.
Exhibit 4: Margins aided by better revenue mix
EBIT Margin (%)
15.5 14.7 15.8 15.3 15.0 15.1 14.8
6.4
S&M as % of Sales
15.2
13.9 13.2 14.3
13.0 13.0 12.5 12.7
7.9
5.2
5.9
6.6
6.2
6.1
6.7
6.5
6.0
4.9
5.1
5.1
6.0
5.9
Source: MOSL, Company
23 July 2016
3

Mphasis
Exhibit 5: HP revenues now at 23% of total revenue; Digital Risk stable during the quarter
HP Channel
Direct Channel
34.2
42.5 46.3 45.5
29.6
Digital Risk Rev. (USD m)
38.0 34.0
22.4
30.8
38.0 40.8 39.9 35.4 35.2
48 54 59 60
63 64 64 64 65 69 71 73 76 76 77
52 46 41 40
37 36 36 36 35 31 29 27 24 24 23
Mar 14*: 2 Month quarter Source: Company, MOSL
Change in estimates
The quarter’s numbers were largely in line; with the minor miss on revenue
growth, and minor beat on profitability.
As earlier, we are factoring in stabilization of revenue from the HP channel at
~USD50m, continued traction in the Direct International business and growth in
Digital Risk. This would lead to revenue growth of 0.3/12.2% in FY17/18E.
We expect EBIT margin of 14.5% for FY17E and 14.9% for FY18E. We expect the
improvement to be a result of continued improvement of revenue mix.
Consequently, our EPS estimates for FY17E and FY18E have moved slightly by
0.8% and 0.2% respectively.
Exhibit 6: Change in estimates
FY16
65.7
926
13.5
34.5
Revised
FY17E
67.8
928
14.5
38.1
FY18E
70.0
1,041
14.9
42.4
FY16
65.7
926
13.5
34.5
Earlier
FY17E
67.7
934
14.6
37.8
FY18E
70.0
1,036
15.0
42.4
FY16
0.0%
0.0%
0bp
0.0%
Change
FY17E
0.1%
-0.6%
-12bp
0.8%
FY18E
0.0%
0.5%
-10bp
0.2%
INR/USD
USD Revenue - m
EBIT Margin (%)
EPS - INR
Source: MOSL, Company
Valuation and view
Our FY18 revenue estimate stands at USD1,041m compares with FY13 (YE
October) annual revenues of USD1,025m. Revenues from the HP channel have
posted a decline in 19 of the last 20 quarters and now constitutes to ~23% of
total revenues. The contribution of the HP channel has significantly reduced in
the portfolio, and the company has laid its focus on the direct international
channel, which it aims to grow above industry average.
There has been significant addition to visibility post the announcement of
Blackstone’s acquisition of HPE’s stake and a revenue commitment by HP to the
tune of USD990m in cumulative revenue over a five-year period. However, that
doesn’t change the fact that overall revenue growth still would remain under
pressure in FY17.
With strong deal wins, and the hive-off of the domestic BPO business, we
estimate MPHL to post growth at a CAGR of 6.1% over FY16-18E. Revenue
growth confidence would be the single most important factor for a re-rating.
23 July 2016
4

Mphasis
However, with uneven growth seen in Digital Risk since its acquisition,
predictability had been low. But deal wins in core Direct business, along with
HPE MSA and management citation that standard deviation in Digital Risk too,
should reduce – are all incrementally positive. With the improved revenue mix,
MPHL has significant scope to improve its margin profile. It raised its EBIT
margin guidance by 100bp to 14-16% for FY17.
Impressive execution in Direct International business lends visibility of above-
industry growth in ~55% of MPHL’s business. Our target price of INR570
discounts forward operating PAT by 12x, added to expected net cash of
INR130/share. Neutral.
Key Triggers
Momentum gain in Direct International channel
Continued uptick in operating margin
Pick up in quarterly deals TCV
Key risks
Continued volatility in Direct Channel emerging markets
Failure to grow Direct International channel faster than industry growth
Volatility in Digital Risk
Exhibit 8: MPHL 1-year forward PB chart
Min(x)
27.5
5.5
4.0
13.6
2.5
1.0
1.2
2.3
PB (x)
Peak(x)
Avg(x)
4.8
Min(x)
Exhibit 7: MPHL 1-year forward PE chart
38
26
14
2
3.3
11.8
PE (x)
Peak(x)
Avg(x)
1.8
Source: Company, MOSL
Exhibit 9: Comparative valuation
Mkt cap
(USD b)
Mphasis
1.7
Mindtree
0.7
KPIT Tech
0.4
Cyient
0.8
Hexaware
1.0
NIIT Tech
0.4
Persistent Sys.
0.8
Zensar
0.7
Company
Rating TP (INR) Upside
(%)
Neutral 560
3.5
Neutral 600
7.7
Neutral 160
18.5
Buy
550
13.2
Neutral 230
2.7
Neutral 530
14.2
Neutral 710
7.6
Buy
1,300 31.2
EPS (INR)
FY16 FY17E FY18E
34.5 38.1 42.4
35.9 32.5 42.5
14.1 13.7 16.0
30.7 34.2 41.6
12.9 13.3 14.9
45.8 41.3 53.4
37.2 37.7 47.4
68.2 77.0 98.0
FY16
15.7
15.5
9.6
15.8
17.3
10.1
17.8
14.5
P/E (x)
FY17E
14.2
17.1
9.8
14.2
16.9
11.2
17.5
12.9
FY18E
12.8
13.1
8.4
11.7
15.1
8.7
13.9
10.1
FY16
12.3
27.4
21.0
16.5
28.9
19.0
19.5
24.0
RoE (%)
FY16-18E CAGR (%)
EPS
FY17E FY18E USD rev.
12.8 14.0
6.1
11.0
21.4 24.3
14.5
8.9
18.0 17.5
4.3
6.6
16.2 17.4
12.9
16.4
27.3 28.8
10.1
7.2
15.2 17.4
7.8
8.0
17.3 20.0
19.5
12.9
22.3 23.9
8.4
19.8
Source: Company, MOSL
23 July 2016
5

Mphasis
Story in charts
Exhibit 10: HP Revenues have been declining rapidly…
HP Revenues
-5.9
-17.0
-22.4
455
157
325
-13.8
65.9
-26.1
241
FY16
34.1
FY11
56.5
44.4
36.8
34.5
27.6
% Change
Exhibit 11: … Now compounded with volatility in digital risk
Direct Channel (%)
HP Channel (%)
-19.9
777
FY10
731
FY11
586
FY12
43.5
FY12
55.6
63.2
65.5
72.4
FY13 5MFY14 FY15
FY13
5MFY14
FY15
FY16
5MFY14* comparison normalized to be comparable
Exhibit 12: India revenue reduced further after sale of BPO
operations
India Revenue
18.619.8
7.0
-6.5
-19.5
-28.9
3.4
-10.4
21.4
-1.1 -0.5 1.7
-9.6
-3.8
% Change
Exhibit 13: … and portfolio issues have dragged EPS lower
year after year
12.5
EPS
% Change
6.8
-0.1
39.4
-4.8
-5.8
-8.6
-24.3
48.6
FY10
-19.0
FY11
37.5
35.3
FY12
FY13
14.7
5MFY14
32.3
FY15
34.5
FY16
5MFY14* comparison normalized to be comparable
Exhibit 14: 14-16% target EBIT margin band
EBIT Margin (%)
4.6
5.4
5.2
6.1
6.2
S&M (%)
6.4
6.6
6.3
Exhibit 15: Volatility in Digital Risk revenues
Digital Risk Rev. (USD m)
34.2
42.5 46.3 45.5
29.6
38.0 34.0
22.4
30.8
38.0 40.8 39.9 35.4 35.2
4.2
4.4
21.7 20.6 16.4 16.4 15.3 15.2 13.3 13.5 14.5 14.9
Source: Company, MOSL
23 July 2016
6

Mphasis
Exhibit 16: Operating metrics
Oct-13 Jan-14 Mar-14 Jun-14 Sep-14 Dec-14 Mar-15 Jun-15 Sep-15 Dec-15 Mar-16 Jun-16
Vertical Contribution (%)
Banking and Capital Markets
Insurance
IT, Commn & Entmt
Emerging Industries
Total
Revenue by Project Type (%)
TTM
FPP
Revenue by Delivery Location (%)
Onsite
Offshore
Secondary Market Segment (%)
HP Channel
Mature Market - Direct Channel
Emerging Market - Direct Channel
Service Type (%)
App Maintenance
App Development
Customer Service
Service/Technical Help Desk
Trasaction Processing Service
Infra Management Services
Knowledge Processes
License Income
CLIENT METRICS
Client wins
BCM
Insurance
ITCE
Emerging industries
Total
Client wins Channels
Direct Channel
HP Channel
Total Client additions
Clients Contributing More than
USD1m
USD5m
USD10m
USD20m
Clients - Direct Channel
USD1m
USD5m
USD10m
USD20m
Clients - HP Channel
USD1m
USD5m
USD10m
USD20m
41.8
12.1
16.2
29.9
100
86
14
47
53
40
56
4
31
22
5
3
5
16
18
1
41.4
12.9
16.1
29.7
100
87
13
47
53
37
57
5
29
20
5
3
5
18
18
1
41.5
12.1
16.3
30.1
100
86
14
46
54
36
57
7
26
23
5
3
5
19
18
0
40.7
12.8
16.8
29.7
100
87
13
45
55
36
56
8
28
22
5
3
5
20
16
0
41.9
13.4
16.9
27.8
100
86
14
46
54
36
58
7
29
24
6
3
6
18
15
0
39.6
14.9
16.9
28.6
100
83
17
43
57
35
56
9
29
25
6
2
7
20
11
1
41.8
15.3
15.6
27.3
100
86
14
47
53
31
60
9
29
25
6
2
7
17
14
1
44.3
15.5
14.3
25.8
100
88
12
49
51
29
64
7
29
25
5
2
7
15
17
1
46.9
15.2
12.7
25.2
100
86
14
49
51
27
67
7
30
24
4
2
7
15
18
0
49.7
15.7
10.0
24.6
100
81
19
51
49
24
70
5
33
23
2
2
7
15
18
1
48.4
16.1
10.7
24.8
100
79
21
51
49
24
71
4
34
25
2
2
7
14
16
0
48.9
15.2
10.2
25.7
100
80
20
51
49
23
73
4
36
23
2
2
7
14
16
0
3
4
1
9
17
8
9
17
117
41
21
11
59
20
12
8
58
21
9
3
2
3
0
6
11
10
1
11
110
42
20
11
54
21
12
7
56
21
8
4
2
0
2
4
8
4
4
8
112
43
19
11
57
25
13
8
55
18
6
3
9
1
1
5
16
11
5
16
110
42
17
10
57
25
12
7
53
17
5
3
1
0
2
7
10
5
5
10
104
41
17
10
52
25
12
7
52
16
5
3
2
0
0
1
3
3
0
3
100
42
17
8
49
25
12
6
51
17
12
2
4
1
2
5
12
8
4
12
102
39
19
9
57
25
14
7
45
14
5
2
5
2
0
3
10
10
0
10
98
36
20
8
58
24
15
6
40
12
5
2
5
0
0
3
8
7
1
8
100
39
19
7
61
27
15
5
39
12
4
2
5
2
0
1
8
5
3
8
102
35
18
8
63
25
14
6
39
10
4
2
6
2
1
2
11
11
0
11
103
35
14
8
64
27
11
6
39
8
3
2
1
0
2
0
3
3
0
3
102
28
15
9
65
22
12
7
37
6
3
2
Source: MOSL, Company
23 July 2016
7

Mphasis
Financials and Valuations
Key assumption
INR/USD Rate
Revenues (USD m)
Total Delivery Headcount
Net Addition
Per Capita Productivity (USD)
HP Channel Revenue (%)
Direct Channel Revenue (%)
Y/E Mar
Net Sales
Change (%)
EBITDA
EBITDA Margin (%)
Depreciation
EBIT
Interest
Other Income
Extraordinary items
PBT
Tax
Tax Rate (%)
Min. Int. & Assoc. Share
Reported PAT
Adjusted PAT
Change (%)
2011
45.7
1,117
40,408
446
27,646
65.9
34.1
2011
50,980
1.2
9,934
19.5
1,550
8,384
0
1,751
0
10,135
1,827
18.0
0
8,308
8,308
-19.1
2011
2,100
36,898
38,998
2,946
-975
40,969
11,339
8,495
2,844
102
17,765
25,610
0
13,072
2,897
9,641
14,050
9,098
4,952
11,560
40,969
2012
53.0
1,036
36,640
-3,768
28,284
56.5
43.5
2012
53,574
5.1
10,511
19.6
1,745
8,766
0
1,513
0
10,279
2,357
22.9
0
7,922
7,922
-4.6
2012
2,101
41,946
44,047
3,299
-1,015
46,331
11,401
9,041
2,360
150
25,192
22,970
0
12,102
4,216
6,652
13,953
8,765
5,188
9,017
46,331
2013
57.5
1,025
37,052
412
27,655
44.4
55.6
2013
57,963
8.2
10,335
17.8
1,446
8,889
0
1,062
0
9,951
2,514
25.3
0
7,437
7,437
-6.1
2013
2,101
47,243
49,344
5,600
-1,015
53,929
10,892
8,770
2,122
266
18,995
26,060
0
12,582
5,943
7,535
16,013
10,167
5,846
10,047
53,929
2014
58.7
427
35,663
-1,389
28,717
36.8
63.2
2014
25,939
7.4
4,397
17.0
504
3,893
0
389
0
4,282
1,191
27.8
0
3,091
3,091
-0.3
2014
2,101
49,049
51,150
5,555
-968
55,737
10,912
8,734
2,178
62
18,154
26,522
0
12,967
4,700
8,855
13,044
9,446
3,598
13,478
55,737
2015
61.3
944
34,059
-1,604
27,716
34.5
65.5
2015
57,949
-6.9
8,701
15.0
980
7,721
0
1,687
0
9,408
2,630
28.0
0
6,778
6,778
-8.6
2015
2,101
52,697
54,798
6,253
-826
60,225
10,055
8,499
1,556
318
14,431
35,014
0
11,371
13,311
10,332
12,875
7,145
5,730
22,139
60,225
2016
65.7
926
22,324
-11,735
41,465
27.6
72.4
2016
60,879
5.1
8,970
14.7
744
8,226
0
1,712
0
9,938
2,696
27.1
0
7,242
7,242
6.9
2016
2,102
60,828
62,930
5,338
-941
67,327
9,300
8,128
1,172
953
21,118
31,968
0
12,333
8,783
10,852
10,826
8,681
2,145
21,142
67,327
2017E
67.8
928
22,006
-318
42,189
23.4
76.6
2017E
62,129
2.1
9,596
15.4
616
8,981
2018E
70.0
1,041
24,006
2,000
43,381
19.9
80.1
2018E
71,897
15.7
11,440
15.9
729
10,711
Income Statement
(INR Million)
0
2,082
0
11,063
3,068
27.7
0
7,995
7,995
10.4
2017E
2,102
59,757
61,859
3,045
-724
64,180
11,060
8,746
2,314
1,103
23,456
25,406
0
13,600
1,571
10,235
11,593
9,489
2,104
13,813
64,180
0
1,565
0
12,276
3,376
27.5
0
8,900
8,900
11.3
2018E
2,102
63,119
65,221
2,045
-724
66,542
13,180
9,475
3,705
1,103
23,456
28,683
0
15,826
2,622
10,235
13,898
11,042
2,856
14,785
66,542
Balance Sheet
Y/E Mar
Share Capital
Reserves
Net Worth
Debt
Deferred Tax
Total Capital Employed
Gross Fixed Assets
Less: Acc Depreciation
Net Fixed Assets
Capital WIP
Investments
Current Assets
Inventory
Debtors
Cash & Bank
Loans & Adv, Others
Curr Liabs & Provns
Curr. Liabilities
Provisions
Net Current Assets
Total Assets
(INR Million)
23 July 2016
8

Mphasis
Financials and Valuations
Ratios
Y/E Mar
Basic (INR)
EPS
Cash EPS
Book Value
DPS
Payout (incl. Div. Tax.)
Valuation(x)
P/E
Cash P/E
Price / Book Value
EV/Sales
EV/EBITDA
Dividend Yield (%)
Profitability Ratios (%)
RoE
RoCE
RoIC
Turnover Ratios (%)
Fixed Asset Turnover (x)
Debtors (No. of Days)
Leverage Ratios (%)
Net Debt/Equity (x)
Y/E Mar
Adjusted EBITDA
Non cash opr. exp (inc)
(Inc)/Dec in Wkg. Cap.
Tax Paid
Other operating activities
CF from Op. Activity
(Inc)/Dec in FA & CWIP
Free cash flows
(Pur)/Sale of Invt
Others
CF from Inv. Activity
Inc/(Dec) in Net Worth
Inc / (Dec) in Debt
Interest Paid
Divd Paid (incl Tax) & Others
CF from Fin. Activity
Inc/(Dec) in Cash
Add: Opening Balance
Closing Balance
2011
39.3
46.9
185.7
6.5
16.5
13.7
11.5
2.9
1.9
9.7
1.2
23.1
22.0
36.0
19.4
90
2012
37.5
46.0
209.6
17.0
45.3
14.4
11.8
2.6
1.6
8.3
3.1
19.1
17.7
34.7
20.6
86
2013
35.3
42.3
234.9
17.0
48.1
15.3
12.8
2.3
1.6
9.1
3.1
15.9
14.5
28.0
25.9
78
2014
14.7
17.1
243.5
7.0
47.6
15.3
13.2
2.2
1.5
9.1
3.1
14.8
5.5
8.8
29.0
74
2015
32.3
36.9
260.8
16.0
49.6
16.8
14.7
2.1
1.6
10.6
3.0
12.8
11.5
16.7
31.0
77
2016
34.5
38.0
299.4
0.0
0.0
15.7
14.2
1.8
1.5
9.9
0.0
12.3
11.2
17.0
44.6
71
2017E
38.1
41.0
294.3
37.0
97.1
14.2
13.2
1.8
1.5
9.6
6.8
12.8
12.0
17.0
35.6
76
2018E
42.4
45.8
310.3
22.0
51.8
12.8
11.8
1.7
1.2
7.8
4.1
14.0
13.5
19.7
23.9
75
0.0
2011
9,934
1,751
1,247
-1,827
-221
10,884
-1,985
8,899
-3,165
-4,812
-9,961
-704
2,490
0
-1,598
188
1,111
1,786
2,897
0.0
2012
10,511
1,513
3,862
-2,357
-40
13,489
-1,309
12,180
-7,427
-914
-9,650
1,307
353
0
-4,180
-2,520
1,319
2,897
4,216
0.0
2013
10,335
1,062
697
-2,514
0
9,580
-1,324
8,256
6,197
-12,887
-8,014
2,040
2,301
0
-4,180
161
1,727
4,216
5,943
0.0
2014
4,397
389
-4,674
-1,191
47
-1,032
-356
-1,388
841
634
1,119
436
-45
0
-1,721
-1,330
-1,243
5,943
4,700
0.0
2015
8,701
1,687
-50
-2,630
142
7,850
-614
7,236
3,723
84
3,193
903
698
0
-4,033
-2,432
8,611
4,700
13,311
0.0
2016
8,970
1,712
-3,531
-2,696
-115
4,340
-995
3,345
-6,687
-1,161
-8,843
890
-915
0
-1
-26
-4,529
13,310
8,782
0.0
2017E
9,596
2,082
116
-3,068
217
8,944
-1,908
7,036
-2,338
-551
-4,797
247
-2,293
0
-9,314
-11,360
-7,213
8,782
1,569
0.0
2018E
11,440
1,565
79
-3,376
0
9,709
-2,120
7,589
0
0
-2,120
0
-1,000
0
-5,538
-6,538
1,050
1,569
2,619
Cash Flow Statement
(INR Million)
23 July 2016
9

Mphasis
Corporate profile
Company description
MphasiS, an HP-EDS company is amongst the top IT
service providers from India. It has a balanced mix
of Application and BPO businesses, with good
growth in ITO business, and support of its US-based
parent, HP-EDS. Mphasis employs over 35,900
people.
Exhibit 1: Sensex rebased
Source: MOSL/Bloomberg
Exhibit 2: Shareholding pattern (%)
Mar-16
60.5
9.9
22.1
7.5
Promoter
DII
FII
Others
Dec-15
60.5
9.0
23.3
7.2
Mar-15
60.5
5.0
24.3
10.2
Source: Capitaline
Exhibit 3: Top holders
Holder Name
ABERDEEN GLOBAL INDIAN EQUITY LIMITED
BAJAJ ALLIANZ LIFE INSURANCE COMPANY
LTD.
LIC OF INDIA MARKET PLUS 1 GROWTH
FUND
ABERDEEN
GLOBAL-ASIAN
SMALLER
COMPANIES FUND
ICICI
PRUDENTIAL
LIFE
INSURANCE
COMPANY
% Holding
4.9
1.9
1.6
1.5
1.4
Source: Capitaline
Note: FII Includes depository receipts
Exhibit 4: Top management
Name
D S Brar
James Mark Merritt
Balu Ganesh Ayyar
A Sivaram Nair
Designation
Chairman
Vice Chairman
Chief Executive Officer
Company Secretary
Exhibit 5: Directors
Name
Lakshmikanth K Ananth
Jan Kathleen Hier
Mary Teresa Hassett
Name
Narayanan Kumar
Jeff Thomas
Stefan Antonio Lutz
Source: Capitaline
*Independent
Exhibit 6: Auditors
Name
S R Batliboi & Associates LLP
Type
Statutory
Exhibit 7: MOSL forecast v/s consensus
EPS
(INR)
FY17
FY18
MOSL
forecast
38.1
42.4
Consensus
forecast
38.3
43.1
Variation (%)
-0.5
-1.7
Source: Bloomberg
Source: Capitaline
23 July 2016
10

Mphasis
NOTES
23 July 2016
11

Disclosures
This document has been prepared by Motilal Oswal Securities Limited (hereinafter referred to as Most) to provide information about the company (ies) and/sector(s), if any, covered in the report and may be distributed by it and/or its
affiliated company(ies). This report is for personal information of the selected recipient/s and does not construe to be any investment, legal or taxation advice to you. This research report does not constitute an offer, invitation or
inducement to invest in securities or other investments and Motilal Oswal Securities Limited (hereinafter referred as MOSt) is not soliciting any action based upon it. This report is not for public distribution and has been furnished to
you solely for your general information and should not be reproduced or redistributed to any other person in any form. This report does not constitute a personal recommendation or take into account the particular investment
objectives, financial situations, or needs of individual clients. Before acting on any advice or recommendation in this material, investors should consider whether it is suitable for their particular circumstances and, if necessary, seek
professional advice. The price and value of the investments referred to in this material and the income from them may go down as well as up, and investors may realize losses on any investments. Past performance is not a guide for
future performance, future returns are not guaranteed and a loss of original capital may occur.
MOSt and its affiliates are a full-service, integrated investment banking, investment management, brokerage and financing group. We and our affiliates have investment banking and other business relationships with a some
companies covered by our Research Department. Our research professionals may provide input into our investment banking and other business selection processes. Investors should assume that MOSt and/or its affiliates are
seeking or will seek investment banking or other business from the company or companies that are the subject of this material and that the research professionals who were involved in preparing this material may educate investors
on investments in such business . The research professionals responsible for the preparation of this document may interact with trading desk personnel, sales personnel and other parties for the purpose of gathering, applying and
interpreting information. Our research professionals are paid on twin parameters of performance & profitability of MOSt.
MOSt generally prohibits its analysts, persons reporting to analysts, and members of their households from maintaining a financial interest in the securities or derivatives of any companies that the analysts cover. Additionally, MOSt
generally prohibits its analysts and persons reporting to analysts from serving as an officer, director, or advisory board member of any companies that the analysts cover. Our salespeople, traders, and other professionals or affiliates
may provide oral or written market commentary or trading strategies to our clients that reflect opinions that are contrary to the opinions expressed herein, and our proprietary trading and investing businesses may make investment
decisions that are inconsistent with the recommendations expressed herein. In reviewing these materials, you should be aware that any or all of the foregoing among other things, may give rise to real or potential conflicts of interest.
MOSt and its affiliated company(ies), their directors and employees and their relatives may; (a) from time to time, have a long or short position in, act as principal in, and buy or sell the securities or derivatives thereof of companies
mentioned herein. (b) be engaged in any other transaction involving such securities and earn brokerage or other compensation or act as a market maker in the financial instruments of the company(ies) discussed herein or act as an
advisor or lender/borrower to such company(ies) or may have any other potential conflict of interests with respect to any recommendation and other related information and opinions.; however the same shall have no bearing
whatsoever on the specific recommendations made by the analyst(s), as the recommendations made by the analyst(s) are completely independent of the views of the affiliates of MOSt even though there might exist an inherent
conflict of interest in some of the stocks mentioned in the research report Reports based on technical and derivative analysis center on studying charts company's price movement, outstanding positions and trading volume, as
opposed to focusing on a company's fundamentals and, as such, may not match with a report on a company's fundamental analysis. In addition MOST has different business segments / Divisions with independent research
separated by Chinese walls catering to different set of customers having various objectives, risk profiles, investment horizon, etc, and therefore may at times have different contrary views on stocks sectors and markets.
Unauthorized disclosure, use, dissemination or copying (either whole or partial) of this information, is prohibited. The person accessing this information specifically agrees to exempt MOSt or any of its affiliates or employees from,
any and all responsibility/liability arising from such misuse and agrees not to hold MOSt or any of its affiliates or employees responsible for any such misuse and further agrees to hold MOSt or any of its affiliates or employees free
and harmless from all losses, costs, damages, expenses that may be suffered by the person accessing this information due to any errors and delays. The information contained herein is based on publicly available data or other
sources believed to be reliable. Any statements contained in this report attributed to a third party represent MOSt’s interpretation of the data, information and/or opinions provided by that third party either publicly or through a
subscription service, and such use and interpretation have not been reviewed by the third party. This Report is not intended to be a complete statement or summary of the securities, markets or developments referred to in the
document. While we would endeavor to update the information herein on reasonable basis, MOSt and/or its affiliates are under no obligation to update the information. Also there may be regulatory, compliance, or other reasons that
may prevent MOSt and/or its affiliates from doing so. MOSt or any of its affiliates or employees shall not be in any way responsible and liable for any loss or damage that may arise to any person from any inadvertent error in the
information contained in this report. MOSt or any of its affiliates or employees do not provide, at any time, any express or implied warranty of any kind, regarding any matter pertaining to this report, including without limitation the
implied warranties of merchantability, fitness for a particular purpose, and non-infringement. The recipients of this report should rely on their own investigations.
This report is intended for distribution to institutional investors. Recipients who are not institutional investors should seek advice of their independent financial advisor prior to taking any investment decision based on this report or for
any necessary explanation of its contents.
Most and it’s associates may have managed or co-managed public offering of securities, may have received compensation for investment banking or merchant banking or brokerage services, may have received any compensation
for products or services other than investment banking or merchant banking or brokerage services from the subject company in the past 12 months.
Most and it’s associates have not received any compensation or other benefits from the subject company or third party in connection with the research report.
Subject Company may have been a client of Most or its associates during twelve months preceding the date of distribution of the research report
MOSt and/or its affiliates and/or employees may have interests/positions, financial or otherwise of over 1 % at the end of the month immediately preceding the date of publication of the research in the securities mentioned in this
report. To enhance transparency, MOSt has incorporated a Disclosure of Interest Statement in this document. This should, however, not be treated as endorsement of the views expressed in the report.
Motilal Oswal Securities Limited is registered as a Research Analyst under SEBI (Research Analyst) Regulations, 2014. SEBI Reg. No. INH000000412
Pending Regulatory inspections against Motilal Oswal Securities Limited:
SEBI pursuant to a complaint from client Shri C.R. Mohanraj alleging unauthorized trading, issued a letter dated 29th April 2014 to MOSL notifying appointment of an Adjudicating Officer as per SEBI regulations to hold inquiry and
adjudge violation of SEBI Regulations; MOSL replied to the Show Cause Notice whereby SEBI granted us an opportunity of Inspection of Documents. Since all the documents requested by us were not covered we have requested to
SEBI vide our letter dated June 23, 2015 to provide pending list of documents for inspection.
List of associate companies of Motilal Oswal Securities Limited -Click
here to access detailed report
Mphasis
Analyst Certification
The views expressed in this research report accurately reflect the personal views of the analyst(s) about the subject securities or issues, and no part of the compensation of the research analyst(s) was, is, or will be directly or
indirectly related to the specific recommendations and views expressed by research analyst(s) in this report. The research analysts, strategists, or research associates principally responsible for preparation of MOSt research receive
compensation based upon various factors, including quality of research, investor client feedback, stock picking, competitive factors and firm revenues
Disclosure of Interest Statement
Analyst ownership of the stock
Served as an officer, director or employee
Mphasis
No
No
A graph of daily closing prices of securities is available at www.nseindia.com and http://economictimes.indiatimes.com/markets/stocks/stock-quotes
Regional Disclosures (outside India)
This report is not directed or intended for distribution to or use by any person or entity resident in a state, country or any jurisdiction, where such distribution, publication, availability or use would be contrary to law, regulation or which
would subject MOSt & its group companies to registration or licensing requirements within such jurisdictions.
For Hong Kong:
This report is distributed in Hong Kong by Motilal Oswal capital Markets (Hong Kong) Private Limited, a licensed corporation (CE AYY-301) licensed and regulated by the Hong Kong Securities and Futures
Commission (SFC) pursuant to the Securities and Futures Ordinance (Chapter 571 of the Laws of Hong Kong) “SFO”. As per SEBI (Research Analyst Regulations) 2014 Motilal Oswal Securities (SEBI Reg No. INH000000412) has
an agreement with Motilal Oswal capital Markets (Hong Kong) Private Limited for distribution of research report in Kong Kong. This report is intended for distribution only to “Professional Investors” as defined in Part I of Schedule 1 to
SFO. Any investment or investment activity to which this document relates is only available to professional investor and will be engaged only with professional investors.” Nothing here is an offer or solicitation of these securities,
products and services in any jurisdiction where their offer or sale is not qualified or exempt from registration. The Indian Analyst(s) who compile this report is/are not located in Hong Kong & are not conducting Research Analysis in
Hong Kong.
For U.S
Motilal Oswal Securities Limited (MOSL) is not a registered broker - dealer under the U.S. Securities Exchange Act of 1934, as amended (the"1934 act") and under applicable state laws in the United States. In addition MOSL is not a
registered investment adviser under the U.S. Investment Advisers Act of 1940, as amended (the "Advisers Act" and together with the 1934 Act, the "Acts), and under applicable state laws in the United States. Accordingly, in the
absence of specific exemption under the Acts, any brokerage and investment services provided by MOSL, including the products and services described herein are not available to or intended for U.S. persons.
This report is intended for distribution only to "Major Institutional Investors" as defined by Rule 15a-6(b)(4) of the Exchange Act and interpretations thereof by SEC (henceforth referred to as "major institutional investors"). This
document must not be acted on or relied on by persons who are not major institutional investors. Any investment or investment activity to which this document relates is only available to major institutional investors and will be
engaged in only with major institutional investors. In reliance on the exemption from registration provided by Rule 15a-6 of the U.S. Securities Exchange Act of 1934, as amended (the "Exchange Act") and interpretations thereof by
the U.S. Securities and Exchange Commission ("SEC") in order to conduct business with Institutional Investors based in the U.S., MOSL has entered into a chaperoning agreement with a U.S. registered broker-dealer, Motilal Oswal
Securities International Private Limited. ("MOSIPL"). Any business interaction pursuant to this report will have to be executed within the provisions of this chaperoning agreement.
The Research Analysts contributing to the report may not be registered /qualified as research analyst with FINRA. Such research analyst may not be associated persons of the U.S. registered broker-dealer, MOSIPL, and therefore,
may not be subject to NASD rule 2711 and NYSE Rule 472 restrictions on communication with a subject company, public appearances and trading securities held by a research analyst account.
For Singapore
Motilal Oswal Capital Markets Singapore Pte Limited is acting as an exempt financial advisor under section 23(1)(f) of the Financial Advisers Act(FAA) read with regulation 17(1)(d) of the Financial Advisors Regulations and is a
subsidiary of Motilal Oswal Securities Limited in India. This research is distributed in Singapore by Motilal Oswal Capital Markets Singapore Pte Limited and it is only directed in Singapore to accredited investors, as defined in the
Financial Advisers Regulations and the Securities and Futures Act (Chapter 289), as amended from time to time.
In respect of any matter arising from or in connection with the research you could contact the following representatives of Motilal Oswal Capital Markets Singapore Pte Limited:
Varun Kumar
Varun.kumar@motilaloswal.com
Contact : (+65) 68189232
Office Address:21 (Suite 31),16 Collyer Quay,Singapore 04931
Kadambari Balachandran
kadambari.balachandran@motilaloswal.com
(+65) 68189233 / 65249115
23 July 2016
Motilal Oswal Tower, Level 9, Sayani Road, Prabhadevi, Mumbai 400 025
Phone: +91 22 3982 5500 E-mail: reports@motilaloswal.com
Motilal Oswal Securities Ltd
12