Persistent Systems
BSE SENSEX
27,803
S&P CNX
8,541
24 July 2016
1QFY17 Results Update | Sector: Technology
CMP: INR658
TP: INR710 (+8%)
Neutral
Motilal Oswal values your support in
the Asiamoney Brokers Poll 2016 for
India Research, Sales and Trading
team. We
request your ballot.
IBM-Watson IoT deal drives revenue growth
…But likely to weigh on profitability in the current year
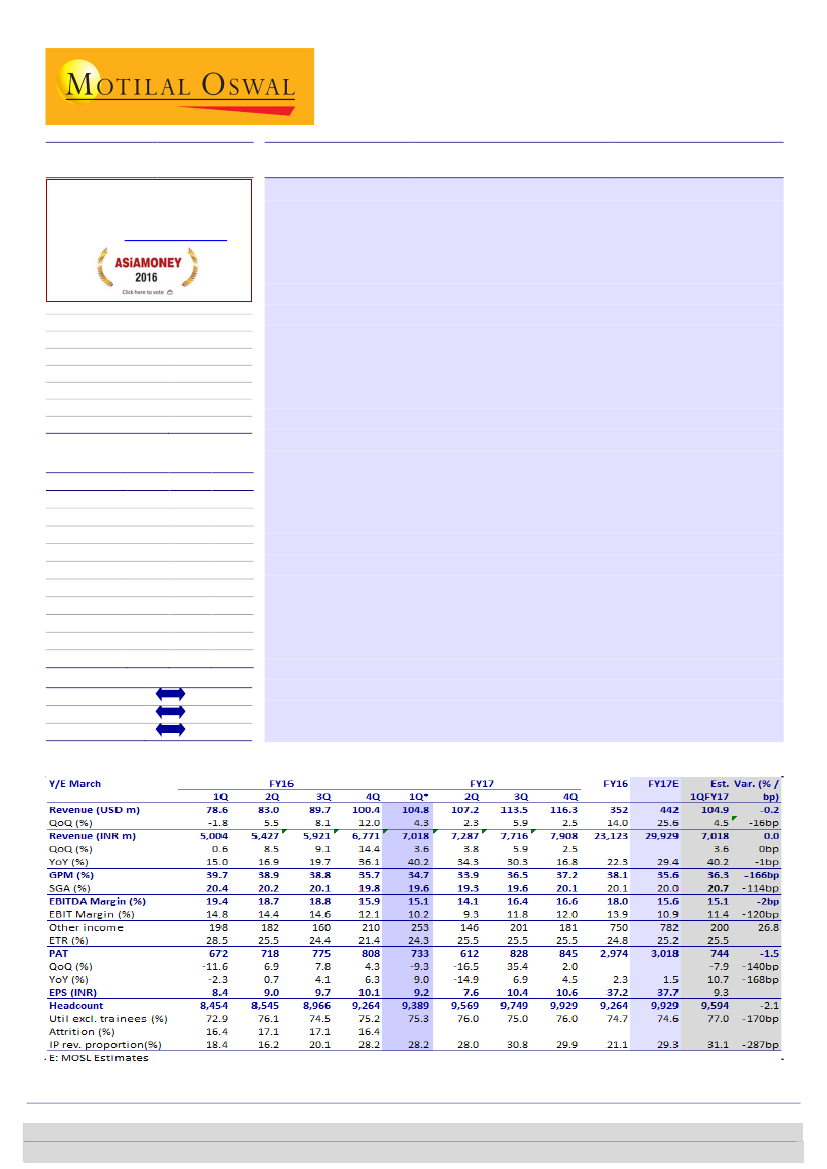
In-line performance…:
Revenue growth of 4.3% QoQ to USD105m was in-line with our
estimate. Profitability too was in-line as EBITDA margins declined by 80bp QoQ to
15.1% - led by visa expenses and additional costs associated with the IBM-Watson IoT
deal. However, the decline in EBIT margins was more severe (-190bp QoQ to 10.2%) as
Bloomberg
Equity Shares (m)
M.Cap.(INRb)/(USDb)
52-Week Range (INR)
1, 6, 12 Rel. Per (%)
12M Avg Val (INR M)
Free float (%)
PSYS IN
80
50.7 / 0.8
797 / 563
-9/-2/5
70
61.9
amortization expense increased by 34% QoQ and 51% YoY because of the change to
IND-AS and subsequent increase in the value of intangible assets.
…but varying composition of revenue:
During the quarter, the IBM-Watson IoT deal
had revenue of USD11.5m and Citrix reported USD2m. Excluding the incremental
addition from these two, revenue was flat during the quarter. Growth in ISVs was
strong at 3.4% QoQ (versus 0.1% CQGR over FY16) and Enterprise saw a rebound (5.9%
QoQ versus 1.8% in the previous quarter). The sharp decline in IP revenue (ex. IBM and
Citrix) of ~13% QoQ weighed on growth.
Financials & Valuations (INR b)
2016 2017E
Y/E Mar
23.1
29.9
Net Sales
4.2
4.7
EBITDA
3.0
3.0
NP
37.2
37.7
EPS (INR)
2.3
1.5
EPS Gr. (%)
211.0 238.3
BV/Sh. (INR)
19.5
17.3
RoE (%)
18.9
16.9
RoCE (%)
17.8
17.5
Payout (%)
3.1
2.8
Div. Yield
2018E
35.1
5.8
3.8
47.4
25.7
250.3
20.0
15.8
13.9
2.6
FY17 margins to remain a pain-point:
The costs associated with the IBM deal are front-
ended and are expected to weigh upon margins to the tune of 200bp in FY17. Margins
would face the headwind of wage hikes in 2Q; although a lot of it can be offset by
traditional levers. The structural recovery to margins would only begin once revenue
from the IBM deal reached a point where it exceeds the cost associated with it, which
is likely to be back-ended; resulting in a full-impact in FY18E.
…which keeps rerating in check:
The IBM deal and traction in the Enterprise segment
has waned some of the revenue growth pressures on PSYS, leading to visibility of
strong revenue growth over FY16-18E (20% revenue CAGR). While the deal provides
potential of earnings accretion in the year beyond, at 18/14x FY17/18E, valuation
upside at PSYS would be constrained by near-term pressures. Moreover, ISVs (ex. IBM)
continue to weigh on overall performance. Our revised target price of INR710 (post
~4% earnings cut in FY17/18E) discounts FY18E earnings by 15x.
Neutral.
Estimate change
TP change
Rating change
Quarterly Performance (Consolidated)
; *IND-AS
Investors are advised to refer through important disclosures made at the last page of the Research Report.
Motilal Oswal research is available on www.motilaloswal.com/Institutional-Equities, Bloomberg, Thomson Reuters, Factset and S&P Capital.
Ashish Chopra
(Ashish.Chopra@MotilalOswal.com); +91 22 6129 1530
Sagar Lele
(Sagar.Lele@MotilalOswal.com); +91 22 6129 1531

Persistent Systems
1QFY17: Revenue driven by IBM-Watson IoT deal and Citrix
PSYS’ 1QFY17 revenues grew 4.3% QoQ to USD104.8m (estimate of 4.5% QoQ).
The growth included additional revenue from the IBM-Watson IoT deal and part
integration of recently acquired Citrix.
The total contribution from the IBM-Watson IoT deal during the quarter was
USD11.5m (versus USD8m in 4QFY16). The incremental revenue from this deal
was for a tad less than a month. The contribution from Citrix was USD2m in 1Q.
Excluding the incremental contribution from these two factors, overall revenue
was flat sequentially.
Exhibit 1: Progress in the IBM Watson IoT deal reflecting in overall revenue growth
Revenue (USD m)
8.6
1.5
63
68
2.2
3.9
0.0
73
73
76
5.0
4.2
80
0.6
79
-1.8
80
83
5.5
90
100
Revenue Growth QoQ (%)
8.1
4.3
105
12.0
70
Source: Company, MOSL
Volumes in the linear business grew by 2.4% QoQ, with onsite volumes
increasing by 0.6% and offshore volumes increasing by 2.7% QoQ.
Onsite billing rates are 3.6x that at offshore for PSYS. Onsite pricing was up 5.9%
QoQ at USD15,437 per person month (PPM) while offshore pricing was up 1.2%
QoQ to USD4,325 PPM.
In Rupee terms, revenue was INR7b, +3.6% QoQ, in line with our estimate.
Average realized currency rate during the quarter was INR67, v/s our estimate
of INR66.89.
Exhibit 2: IP-led revenues declined excluding the addition of IBM Watson IoT and Citrix
IP business revenue (USD m)
37.4
9.5
-12.4
13.1
12.4
-4.8
14.2
14.4
2.1
14.5
15.0 15.1
2.9
1.0
14.5
-4.1
14.5
-0.1
13.4
-7.1
18.0 28.3
29.5
QoQ growth (%)
34.1
57.2
4.3
Source: Company, MOSL
EBITDA margin was 15.1%, -80bp QoQ, in line with our estimate. Gross margin
fell by 100bp to 34.7% and SGA was down 30bp QoQ to 19.8%.
24 July 2016
2

Persistent Systems
EBITDA margins in 1Q had headwinds from visa expenses, drop in IP revenue
because of seasonality, additional costs associated with the IBM-Watson IoT
deal and provisioning for doubtful debts (which saw a reversal in 4QFY16).
Exhibit 3: EBITDA margin lower because of visa expenses and costs related to the IBM deal
EBITDA Margin (%)
8.9
8.8
8.9
7.6
27.0
21.8
20.6
20.1
20.2
19.4
18.7
18.8
15.9
9.0
9.4
9.9
S&M (%)
10.2
9.9
9.7
9.1
8.6
8.1
21.7
26.0
27.7
15.1
Source: Company, MOSL
The company is likely to face the pressure of wage hike in 2Q; but the tailwinds
of additional revenue from the IBM-Watson IoT deal, absence of visa expenses
and increase in onsite utilization are likely to partly offset this headwind.
Onsite utilization has been low over the last few quarters because of the ramp
up in Enterprise and the IBM deal. As these areas start to pick-up, onsite
utilization has the potential to be optimized.
Exhibit 4: Onsite utilization has potential to improve
Offshore Utilization %
95
90
85
80
75
70
65
60
84.9
68.8
89.4
85.9
71.8
86.9
88.0
89.7
88.6
72.9
Onsite Utilization %
89.2
73.2
84.7
71.6
87.4
74.6
86.6
72.8
85.9
73.6
84.2
74.0
70.3
67.7
65.9
68.4
Source: Company, MOSL
Forex gains during the quarter were INR81m v/s losses of INR36m in 4QFY16,
and our expectation of gains of INR48m.
However, Other Income at INR172m, was lower than INR245m in 4QFY16 and
higher than our estimate of INR131m.
Effective tax rate during the quarter was 24.3%, lower than our estimate of
25.5%. Consequently, PAT at INR733m was below our estimate of INR744m.
Revenue growth in ISVs was 3.4% QoQ, driven by additional revenue from top
client. Revenue from this segment had been under pressure till 4QFY16, as it
clocked a four-quarter CQGR of -0.1%, despite addition to revenue growth by
the acquisition of RGEN in 2Q.
Segment-wise performance: ISVs and Enterprise drive growth
24 July 2016
3

Persistent Systems
Enterprise grew by 5.9% QoQ compared to 4QFY16 growth of 1.8% QoQ.
Traction in this segment has relatively weakened over the last two quarters.
IP revenues grew by 4.3% QoQ. In 1Q, excluding the incremental revenue from
the IBM-Watson IoT deal and the full integration of Citrix, IP revenue declined
by ~13% QoQ.
In 4QFY16, excluding revenue from the IBM Watson IoT deal and the part-
integration of Citrix, IP revenue grew by ~13% QoQ. A similar trend was seen in
3QFY16, where excluding the acquisition of Aepona, IP revenue grew by ~15.5%
QoQ.
Contri.
Rev. (%)
45.4
26.4
28.2
to Growth
QoQ (%)
3.4
5.9
4.3
- 4 Qtr
CQGR (%)
1.5
9.4
19.5
Source: Company, MOSL
Exhibit 5: IP declined excluding IBM and Citrix
Industry Classification
ISV
Enterprise
IP Led
Growth during the quarter was driven by North America (5.4% QoQ) and RoW
(13% QoQ), while Europe remained under pressure. RoW (mainly India and
APAC) has been a volatile segment for PSYS over the last few quarters.
Contri. to
Rev. (%)
87.0
5.2
7.8
Growth –
QoQ (%)
5.4
-19.0
13.0
4 Qtr
CQGR (%)
8.3
2.4
2.8
Source: MOSL, Company
Exhibit 6: RoW remains volatile
Geographies
North America
Europe
RoW
Top client grew for the fifth consecutive quarter, after four successive quarters
of decline, and was a key positive during the quarter, indicating a sustained
growth trajectory. 2-5 clients grew by 6.3% QoQ and 6-10 declined by 5.2%
QoQ. Non-top 10 accounts declined by 2.1% QoQ.
Contri.
Rev. (%)
29.0
15.7
8.0
to Growth
QoQ (%)
19.1
6.3
-5.2
- 4
CQGR (%)
20.9
4.0
2.7
Source: MOSL, Company
Qtr
Exhibit 7: Strong growth in top client – a key positive during the quarter
Client Metrics
Top Client
Top 2-5 Clients (%)
Top 6-10 Clients (%)
Change in estimates
Revenue from the IBM Watson IoT deal commenced during 4QFY16 and added
~USD8m in revenue. In 1QFY17, it added ~USD11.5m as it got integrated for the
full quarter. The deal is expected to bring in revenue of ~USD50m in FY17.
However, costs associated with the deal are expected to be front-ended.
In the last two quarters, EBITDA margins have eroded by 370bp, a major part of
which can be attributed to the costs related to the IBM deal. While the company
will face the headwinds of wage hikes in 2Q, this can be partly offset by absence
of visa expenses; improved onsite utilization; better blended pricing because of
4
24 July 2016

Persistent Systems
the IBM deal and Aepona acquisition; and higher revenue from the IBM deal
leading to better profitability on incremental revenue.
Our USD revenue and EBITDA margin estimates have largely remain unchanged
because of the in-line quarter. However, Depreciation & Amortization expenses
increased by 34% QoQ and 51% YoY as the company had to recognize additional
amortization relating, majorly contributed by the acquisition of RGEN and
product purchases related to the IBM deal.
Consequently, we have cut our earnings estimate by 4.3/4.0% for FY17/18E.
Exhibit 8: Change in estimates
Revised
FY16
FY17
FY18
65.8
67.8
70.0
351.7 441.7 502.1
14.0
25.6
13.7
18.0
15.6
16.6
37.2
37.7
47.4
FY16
65.8
351.7
14.0
18.0
37.2
Earlier
FY17
67.7
442.5
25.8
15.6
39.4
FY18
70.0
502.1
13.5
16.6
49.4
FY16
0.0%
0.0%
0bp
0bp
0.0%
Change
FY17
FY18
0.0%
0.0%
-0.2% 0.0%
-20bp 20bp
0bp
0bp
-4.3% -4.0%
INR/USD
USD Revenue - m
USD revenue gr.
EBITDA Margin (%)
EPS - INR
Source: MOSL, Company
Valuation and view: Remain positive on business; Neutral on valuations
In Tier-II IT, we prefer PSYS’ business fundamentals, given the following factors:
One of the few Tier-II companies with the potential to grow revenues above
the industry given the focus on Enterprise Digital Transformation.
Unlikelihood of obsolescence in its chosen segments over the medium to
long term; and multi-year relationships, with marquee clientele in the ISV
space.
Credible experience in agile product development and iterative approach to
Product Engineering – two very relevant trends in today’s market
Strong balance sheet and adequate pricing power in the set of offerings
PSYS’ arrangement with IBM for its IoT Watson product may weigh on the
company’s performance in FY17, but has the potential to be significantly
earnings accretive beyond the next year. It lends strong revenue visibility from
PSYS’ top client; and a healthy growth in Watson’s IoT product sales would have
a direct bearing on PSYS’ revenues and profitability.
Based on the business model, financial performance and presence in potentially
high growth areas, there is a case for PSYS to be values at a premium multiple to
its tier-II peers. Including the likely changes in financial performance on account
of the deal, we expect PSYS to grow its revenues at a CAGR of 19.5% over FY16-
18 and earnings at a CAGR of 12.9% over the same period. Although the concern
around revenue growth has been addressed by the new IBM deal, margins have
taken a clear hit, and are expected to keep them burdened despite the
aggressive use of some of the levers.
The stock trades 17.5/13.9x FY17/18E Earnings. We expect restrictions to uptick
in valuations till margin pressures ease out, and the Enterprise segment picks up
meaningfully again. Our revised price target of INR710 discounts FY18E earnings
by 15x, which implies 8% upside to CMP. Neutral.
Key triggers
Better-than-estimated margins from aggressive exercise of levers
5
24 July 2016

Persistent Systems
Sharper growth in IBM Watson IoT
Strong rebound in Enterprise growth
Key risk factors
Continued revenue sluggishness in ISV segment (ex-IBM)
Pressure on margins from higher S&M to sell products / investments in latest
collaboration with top customer
Decline in discretionary activity
Exhibit 10: 1-year forward PB band
Avg(x)
Min(x)
24.4
5.0
4.0
3.0
15.1
6.7
2.0
1.0
2.3
1.2
2.7
PB (x)
Peak(x)
Avg(x)
4.3
Min(x)
Exhibit 9: 1-year forward PE band
30
25
20
15
10
5
12.8
PE (x)
Peak(x)
Exhibit 11: Comparative valuation
Mkt cap Rating TP (INR) Upside
EPS (INR)
P/E (x)
RoE (%)
FY16-18E CAGR (%)
(USD b)
(%) FY16 FY17E FY18E FY16
EPS
FY17E FY18E FY16 FY17E FY18E USD rev.
Mphasis
1.7 Neutral
560 3.5
34.5 38.1 42.4
15.7
14.2
12.8 12.3 12.8 14.0
6.1 11.0
Mindtree
0.7 Neutral
600 7.7
35.9 32.5 42.5
15.5
17.1
13.1 27.4 21.4 24.3
14.5 8.9
KPIT Tech
0.4 Neutral
160 18.5
14.1 13.7 16.0
9.6
9.8
8.4 21.0 18.0 17.5
4.3 6.6
Cyient
0.8 Buy
550 13.2
30.7 34.2 41.6
15.8
14.2
11.7 16.5 16.2 17.4
12.9 16.4
Hexaware
1.0 Neutral
230 2.7
12.9 13.3 14.9
17.3
16.9
15.1 28.9 27.3 28.8
10.1 7.2
NIIT Tech
0.4 Neutral
530 14.2
45.8 41.3 53.4
10.1
11.2
8.7 19.0 15.2 17.4
7.8 8.0
Persistent Sys.
0.8 Neutral
710 7.6
37.2 37.7 47.4
17.8
17.5
13.9 19.5 17.3 20.0
19.5 12.9
Zensar
0.7 Buy
1,300 31.2
68.2 77.0 98.0
14.5
12.9
10.1 24.0 22.3 23.9
8.4 19.8
Source: Company, MOSL
Company
24 July 2016
6

Persistent Systems
Story in charts
Exhibit 12: Aggressive foray in IP-led revenues...
IP led revenues (USD m)
123.8
59.1
19.9
74.2
Growth (%)
Exhibit 13: … and strong traction in Enterprise business…
Enterprise revenues (USD m)
17.4
8.9
5.0
25.7
14.4
16.9
18.4
19.3
19.3
0.3
22.1
25.6
14.1
16.2
26.1
1.8
QoQ (%)
61.1
22.8
9.2
FY10
14.9
FY11
18.3
FY12
40.9
FY13
49.3
20.5
5.9
27.7
FY14
FY15
FY16
Source: Company, MOSL
Exhibit 14: …have offset sluggish ISV business (~45% of rev)
ISV Revenues (%)
60.3
58.3
57.9
57.8
57.0
57.2
51.3
Exhibit 15: Access to market is key to scale – beefed up
front-end hiring in recent quarters
Sales personnel
224 216
208 203 201 204
202 212 208
45.8
45.4
139 150
119 128
Source: Company, MOSL
Exhibit 16: Turnaround in linear revenues is key to 20%+
growth…
Revenue (USD m)
Growth (%)
25.6
14.7
15.2
Exhibit 17: …and continued IP traction is crucial to
profitability uptick
PAT (INR m)
25.9
23.4
25.8
EBITDA margin (%)
12.6
14.0
13.7
20.4
20.7
18.0
16.6
3794
237.8
FY13
274.1
FY14
308.5
FY15
351.7
FY16
441.7
FY17E
502.1
FY18E
1397
FY11
1431
FY12
1876
FY13
2493
FY14
2906
FY15
2974
15.6
3018
FY16 FY17E FY18E
Source: Company, MOSL
24 July 2016
7

Persistent Systems
Exhibit 18: Operating metrics
4QFY14
Segments (%)
Services
Digital
Alliance
Accelerite
1QFY15
2QFY15
3QFY15
4QFY15
1QFY16
2QFY16
3QFY16
4QFY16
1QFY17
47.6
14.2
30.0
8.2
Geography (%)
North America
Europe
RoW
Industry Classification (%)
ISV
Enterprise
IP Led
Revenue Mix (%)
Services: Onsite
Services: Offshore
IP Led
Client Metrics (%)
Top Client
Top 2-5 Clients
Top 6-10 Clients
Clients billed
Prod. Eng. & Platforms
IP Led
Customer Engagement Size
USD3m+
USD1-3m
Repeat Business
DSO
Employee Metrics
Technical People
Sales & BD
Others
Total
Billable Person Months
- Onsite
- Offshore
Linear Utilization %
Onsite Utilization %
Offshore Utilization %
Attrition (%)
IP Led Person Months
Yield (USD/p.p.m)
Billing Rates (USD/p.p.m)
Onsite
Offshore
85.4
6.1
8.5
85.9
6.5
7.6
86.1
6.3
7.7
84.7
7.1
8.2
85.4
6.8
7.8
84.4
6.3
9.3
86.2
6.8
7.0
85.3
6.3
8.4
86.1
6.7
7.2
87.0
5.2
7.8
60.3
19.8
20.0
58.3
22.1
19.6
57.9
23.1
19.0
57.8
24.1
18.1
57.0
24.6
18.4
57.2
26.6
16.2
51.3
28.6
8.4
45.8
26.0
28.2
45.4
26.4
28.2
21.4
59.0
19.6
23.1
56.9
20.0
24.5
55.9
19.6
25.1
55.9
19.0
26.2
55.7
18.1
26.8
54.8
18.4
29.5
54.3
16.2
29.8
50.1
20.1
26.3
45.5
28.2
26.3
45.5
28.2
21.1
18.3
9.1
261
358
15
36
85.2
63
20.8
17.9
10.3
260
347
14
38
86.7
69
19.0
17.1
8.9
281
376
14
41
83.6
65
17.5
17.5
9.2
273
349
14
41
84.1
65
16.5
17.6
9.1
268
326
14
48
85.6
64
18.1
17.9
9.6
277
310
15
52
88.7
67
17.6
17.8
9.3
311
299
17
46
86.2
68
17.4
16.9
9.8
337
291
19
44
82.0
69
25.4
15.4
8.8
319
353
18
42
82.1
62
29.0
15.7
8
340
338
15
50
nm
63
7,349
150
358
7,857
16,155
1,246
14,909
69.2
86.9
67.7
13.4
2,343
3,927
14,355
4,241
7,271
202
403
7,876
16,139
1,283
14,856
67.7
88.0
65.9
14.0
2,419
3,915
14,905
4,219
7,447
212
408
8,067
16,015
1,403
14,612
70.3
89.7
68.4
14.1
2,496
4,123
14,864
4,271
7,664
208
424
8,296
16,031
1,518
14,513
74.3
88.6
72.9
14.7
2,620
4,264
14,862
4,201
7,861
224
421
8,506
16,063
1,551
14,512
74.7
89.2
73.2
15.5
2,672
4,272
15,159
4,199
7,810
216
428
8,454
16,138
1,623
14,515
72.9
84.7
71.6
16.4
2,880
4,134
15,321
4,146
7,905
208
432
8,545
16,066
1,854
14,212
76.1
87.4
74.6
17.1
3,021
4,346
15,075
4,251
8,334
203
429
8,966
16,718
2,097
14,621
74.5
86.6
72.8
17.1
3,526
4,428
14,717
4,217
8,618
201
445
9,264
16,631
2,108
14,523
75.2
85.9
73.6
16.4
4,082
4,849
14,574
4,275
8,698
204
487
9,389
17,030
2,121
14,909
75.3
84.2
74
16.7
5,235
4,705
15,437
4,325
Source: MOSL, Company
24 July 2016
8

Persistent Systems
Financials and Valuations
Key assumption
INR/USD Rate
Revenues (USD m)
Services Revenue (USD m)
IP Led Revenues (USD m)
Total Headcount
Net Addition
Per Capita Ptoductivity (USD)
Linear Utilization (Blended %)
Y/E Mar
Net Sales
Change (%)
EBITDA
EBITDA Margin (%)
Depreciation
EBIT
Interest
Other Income
Extraordinary items
PBT
Tax
Tax Rate (%)
Min. Int. & Assoc. Share
Reported PAT
Adjusted PAT
Change (%)
2011
45.6
170.2
155.4
14.9
6,360
1,698
26,766
71.0
2011
7,758
29.1
1,583
20.4
424
1,159
0
344
0
1,504
108
7.2
0
1,396
1,396
21.3
2011
435
7,036
7,471
0
-60
7,441
4,543
2,281
2,261
605
2,500
3,677
0
1,582
1,000
1,095
1,602
1,206
396
2,075
7,441
2012
48.2
207.4
189.1
18.3
6,628
268
31,290
72.1
2012
10,003
28.9
2,337
23.4
611
1,726
0
256
0
1,981
551
27.8
0
1,431
1,431
2.5
2012
400
8,005
8,405
7
-107
8,376
6,090
2,892
3,197
528
123
6,189
0
2,033
3,290
866
1,660
879
781
4,528
8,376
2013
54.4
237.8
196.9
40.9
6,970
342
34,121
74.1
2013
12,945
29.4
3,352
25.9
783
2,569
0
61
0
2,630
754
28.7
0
1,876
1,876
31.2
2013
400
9,783
10,183
14
-190
10,646
6,951
3,449
3,502
1,174
173
7,690
0
2,509
3,677
1,503
1,893
845
1,048
5,797
10,646
2014
60.9
274.1
224.8
49.3
7,857
887
34,881
70.9
2014
16,692
28.9
4,303
25.8
1,026
3,277
0
150
0
3,427
934
27.3
0
2,493
2,493
32.9
2014
400
11,823
12,223
32
-260
12,389
8,545
4,468
4,077
307
823
9,966
0
3,028
5,028
1,910
2,785
1,574
1,211
7,181
12,389
2015
61.3
308.5
249.4
59.1
8,506
649
36,272
71.7
2015
18,913
13.3
3,906
20.7
939
2,967
0
932
0
3,900
993
25.5
0
2,906
2,906
16.6
2015
800
13,255
14,055
25
-315
13,885
9,408
5,331
4,076
40
2,116
11,201
0
3,586
6,036
1,579
3,549
1,793
1,755
7,653
13,885
2016
65.8
351.7
277.4
74.2
9,264
758
37,959
74.7
2016
23,123
22.3
4,171
18.0
965
3,206
0
750
0
3,956
983
24.8
0
2,974
2,974
2.3
2016
800
15,593
16,393
26
-233
16,312
10,951
6,589
4,363
265
1,348
14,857
0
4,275
6,260
4,321
4,521
3,293
1,228
10,335
16,311
2017E
67.8
441.7
312.5
129.2
9,929
665
44,484
74.6
2017E
29,929
29.4
4,660
15.6
1,407
3,253
2018E
70.0
502.1
353.2
148.9
10,735
806
46,772
75.1
2018E
35,147
17.4
5,841
16.6
1,453
4,388
Income Statement
(INR Million)
0
782
0
4,035
1,017
25.2
0
3,018
3,018
1.5
2017E
800
17,717
18,517
36
-473
18,205
13,471
7,982
5,490
265
0
17,686
0
5,166
10,235
2,286
5,236
4,428
808
12,451
18,205
0
704
0
5,092
1,299
25.5
0
3,794
3,794
25.7
2018E
800
18,643
19,443
36
-473
19,132
13,771
8,339
5,433
265
0
18,769
0
5,404
11,079
2,286
5,335
4,632
703
13,434
19,132
Balance Sheet
Y/E Mar
Share Capital
Reserves
Net Worth
Debt
Deferred Tax
Total Capital Employed
Gross Fixed Assets
Less: Acc Depreciation
Net Fixed Assets
Capital WIP
Investments
Current Assets
Inventory
Debtors
Cash & Bank
Loans & Adv, Others
Curr Liabs & Provns
Curr. Liabilities
Provisions
Net Current Assets
Total Assets
(INR Million)
24 July 2016
9

Persistent Systems
Financials and Valuations
Ratios
Y/E Mar
Basic (INR)
EPS
Cash EPS
Book Value
DPS
Payout (incl. Div. Tax.)
Valuation(x)
P/E
Cash P/E
Price / Book Value
EV/Sales
EV/EBITDA
Dividend Yield (%)
Profitability Ratios (%)
RoE
RoCE
Turnover Ratios (%)
Asset Turnover (x)
Debtors (No. of Days)
Inventory (No. of Days)
Creditors (No. of Days)
Leverage Ratios (%)
Net Debt/Equity (x)
2011
17.1
22.2
96.2
2.8
16.1
2012
17.7
25.5
108.2
3.0
16.9
2013
23.5
33.2
131.1
4.5
19.2
2014
31.2
44.0
157.3
6.0
19.3
2015
36.3
48.1
180.9
10.0
27.5
18.2
13.7
3.6
2.3
11.0
1.5
20.1
16.5
3.8
75
0
0
0.0
2011
1,583
-81
-460
-108
0
935
-971
-37
-939
0
-1,910
19
0
0
90
109
-866
1,866
1,000
18.0
17.5
3.7
75
0
0
0.0
2012
2,337
-260
27
-551
0
1,553
-1,470
83
2,378
0
908
38
7
0
-19
25
2,486
804
3,290
20.2
14.8
3.9
75
0
0
0.0
2013
3,352
181
260
-754
0
3,038
-1,735
1,304
-50
0
-1,785
128
8
0
-346
-211
1,043
2,634
3,677
22.3
16.0
4.4
75
0
0
0.0
2014
4,303
0
-403
-934
0
2,965
-734
2,232
-650
0
-1,384
96
18
0
-398
-284
1,297
3,731
5,028
22.1
18.6
4.6
75
0
0
0.0
2015
3,906
0
-207
-993
0
2,705
-670
2,035
-1,292
0
-1,963
-118
-7
0
-24
-149
593
5,443
6,036
2016
37.2
49.2
211.0
11.0
29.6
17.8
13.4
3.1
1.9
10.5
1.7
19.5
18.9
5.5
75
0
0
0.0
2016
4,171
0
-859
-983
0
2,329
-1,477
852
768
0
-709
426
1
0
-312
115
1,735
4,525
6,260
2017E
37.7
55.3
238.3
12.0
31.8
17.5
11.9
2.8
1.4
8.8
1.8
17.3
16.9
6.1
75
0
0
0.0
2017E
4,660
0
139
-1,017
0
3,781
-2,534
1,247
1,348
0
-1,186
267
10
0
-379
-101
2,494
7,741
10,235
2018E
47.4
65.6
250.3
12.0
25.3
13.9
10.1
2.6
1.1
6.9
1.8
20.0
15.8
6.4
75
0
0
0.0
2018E
5,841
0
-139
-1,299
0
4,403
-1,396
3,008
0
0
-1,396
-1,707
0
0
-457
-2,164
844
10,235
11,079
Cash Flow Statement
Y/E Mar
Adjusted EBITDA
Non cash opr. exp (inc)
(Inc)/Dec in Wkg. Cap.
Tax Paid
Other operating activities
CF from Op. Activity
(Inc)/Dec in FA & CWIP
Free cash flows
(Pur)/Sale of Invt
Others
CF from Inv. Activity
Inc/(Dec) in Net Worth
Inc / (Dec) in Debt
Interest Paid
Divd Paid (incl Tax) & Others
CF from Fin. Activity
Inc/(Dec) in Cash
Add: Opening Balance
Closing Balance
(INR Million)
24 July 2016
10

Persistent Systems
Corporate profile
Company description
Exhibit 1: Sensex rebased
Persistent is a global company specializing in software
product and technology innovation, partnering with
pioneering start-ups, innovative enterprises and the
world’s largest technology brands. The company staffs
over 8,000 employees and clocked revenues of USD274m
(FY14). It has a clear focus on new initiatives that are
witnessing greater demand and will drive the next wave
of growth in technology - Cloud, Mobility, Data Analytics
and Collaboration.
Source: MOSL/Bloomberg
Exhibit 2: Shareholding pattern (%)
Mar-16
38.5
12.0
26.8
22.7
Promoter
DII
FII
Others
Dec-15
38.5
26.4
12.9
22.2
Mar-15
38.6
9.8
22.5
29.2
Source: Capitaline
Exhibit 3: Top holders
Holder Name
Saif Advisors Mauritius Limited A/C Saif India
Iv Fii Holdings Limited
Nordea 1 Sicav - Emerging Stars Equity Fund
Shridhar Bhalchandra Shukla
HDFC Trustee Company Ltd - A/C HDFC Mid -
Capopportunities Fund
ICICI Prudential Value Discovery Fund
% Holding
5.3
2.9
2.0
1.9
1.6
Source: Capitaline
Note: FII Includes depository receipts
Exhibit 4: Top management
Name
Anand Deshpande
Amit Atre
Designation
Chairman
&
Managing
Director
Company Secretary
Exhibit 5: Directors
Name
Anant Jhingran
Pradeep K Bhargava
Roshini Bakshi
Mritunjay Kumar Singh
Name
Kiran Umrootkar
Prakash Telang
S K Bhattacharyya
Thomas W Kendra
Source: Capitaline
*Independent
Exhibit 6: Auditors
Name
Deloitte Haskins & Sells LLP
Joshi Apte & Co
Type
Statutory
Statutory
Exhibit 7: MOSL forecast v/s consensus
EPS
(INR)
FY17
FY18
MOSL
forecast
37.7
47.4
Consensus
forecast
41.9
50.8
Variation (%)
-10.0
-6.6
Source: Bloomberg
Source: Capitaline
24 July 2016
11

Disclosures
This document has been prepared by Motilal Oswal Securities Limited (hereinafter referred to as Most) to provide information about the company (ies) and/sector(s), if any, covered in the report
Persistent Systems
and may be distributed by it and/or its
affiliated company(ies). This report is for personal information of the selected recipient/s and does not construe to be any investment, legal or taxation advice to you. This research report does not constitute an offer, invitation or
inducement to invest in securities or other investments and Motilal Oswal Securities Limited (hereinafter referred as MOSt) is not soliciting any action based upon it. This report is not for public distribution and has been furnished to
you solely for your general information and should not be reproduced or redistributed to any other person in any form. This report does not constitute a personal recommendation or take into account the particular investment
objectives, financial situations, or needs of individual clients. Before acting on any advice or recommendation in this material, investors should consider whether it is suitable for their particular circumstances and, if necessary, seek
professional advice. The price and value of the investments referred to in this material and the income from them may go down as well as up, and investors may realize losses on any investments. Past performance is not a guide for
future performance, future returns are not guaranteed and a loss of original capital may occur.
MOSt and its affiliates are a full-service, integrated investment banking, investment management, brokerage and financing group. We and our affiliates have investment banking and other business relationships with a some
companies covered by our Research Department. Our research professionals may provide input into our investment banking and other business selection processes. Investors should assume that MOSt and/or its affiliates are
seeking or will seek investment banking or other business from the company or companies that are the subject of this material and that the research professionals who were involved in preparing this material may educate investors
on investments in such business . The research professionals responsible for the preparation of this document may interact with trading desk personnel, sales personnel and other parties for the purpose of gathering, applying and
interpreting information. Our research professionals are paid on twin parameters of performance & profitability of MOSt.
MOSt generally prohibits its analysts, persons reporting to analysts, and members of their households from maintaining a financial interest in the securities or derivatives of any companies that the analysts cover. Additionally, MOSt
generally prohibits its analysts and persons reporting to analysts from serving as an officer, director, or advisory board member of any companies that the analysts cover. Our salespeople, traders, and other professionals or affiliates
may provide oral or written market commentary or trading strategies to our clients that reflect opinions that are contrary to the opinions expressed herein, and our proprietary trading and investing businesses may make investment
decisions that are inconsistent with the recommendations expressed herein. In reviewing these materials, you should be aware that any or all of the foregoing among other things, may give rise to real or potential conflicts of interest.
MOSt and its affiliated company(ies), their directors and employees and their relatives may; (a) from time to time, have a long or short position in, act as principal in, and buy or sell the securities or derivatives thereof of companies
mentioned herein. (b) be engaged in any other transaction involving such securities and earn brokerage or other compensation or act as a market maker in the financial instruments of the company(ies) discussed herein or act as an
advisor or lender/borrower to such company(ies) or may have any other potential conflict of interests with respect to any recommendation and other related information and opinions.; however the same shall have no bearing
whatsoever on the specific recommendations made by the analyst(s), as the recommendations made by the analyst(s) are completely independent of the views of the affiliates of MOSt even though there might exist an inherent
conflict of interest in some of the stocks mentioned in the research report Reports based on technical and derivative analysis center on studying charts company's price movement, outstanding positions and trading volume, as
opposed to focusing on a company's fundamentals and, as such, may not match with a report on a company's fundamental analysis. In addition MOST has different business segments / Divisions with independent research
separated by Chinese walls catering to different set of customers having various objectives, risk profiles, investment horizon, etc, and therefore may at times have different contrary views on stocks sectors and markets.
Unauthorized disclosure, use, dissemination or copying (either whole or partial) of this information, is prohibited. The person accessing this information specifically agrees to exempt MOSt or any of its affiliates or employees from,
any and all responsibility/liability arising from such misuse and agrees not to hold MOSt or any of its affiliates or employees responsible for any such misuse and further agrees to hold MOSt or any of its affiliates or employees free
and harmless from all losses, costs, damages, expenses that may be suffered by the person accessing this information due to any errors and delays. The information contained herein is based on publicly available data or other
sources believed to be reliable. Any statements contained in this report attributed to a third party represent MOSt’s interpretation of the data, information and/or opinions provided by that third party either publicly or through a
subscription service, and such use and interpretation have not been reviewed by the third party. This Report is not intended to be a complete statement or summary of the securities, markets or developments referred to in the
document. While we would endeavor to update the information herein on reasonable basis, MOSt and/or its affiliates are under no obligation to update the information. Also there may be regulatory, compliance, or other reasons that
may prevent MOSt and/or its affiliates from doing so. MOSt or any of its affiliates or employees shall not be in any way responsible and liable for any loss or damage that may arise to any person from any inadvertent error in the
information contained in this report. MOSt or any of its affiliates or employees do not provide, at any time, any express or implied warranty of any kind, regarding any matter pertaining to this report, including without limitation the
implied warranties of merchantability, fitness for a particular purpose, and non-infringement. The recipients of this report should rely on their own investigations.
This report is intended for distribution to institutional investors. Recipients who are not institutional investors should seek advice of their independent financial advisor prior to taking any investment decision based on this report or for
any necessary explanation of its contents.
Most and it’s associates may have managed or co-managed public offering of securities, may have received compensation for investment banking or merchant banking or brokerage services, may have received any compensation
for products or services other than investment banking or merchant banking or brokerage services from the subject company in the past 12 months.
Most and it’s associates have not received any compensation or other benefits from the subject company or third party in connection with the research report.
Subject Company may have been a client of Most or its associates during twelve months preceding the date of distribution of the research report
MOSt and/or its affiliates and/or employees may have interests/positions, financial or otherwise of over 1 % at the end of the month immediately preceding the date of publication of the research in the securities mentioned in this
report. To enhance transparency, MOSt has incorporated a Disclosure of Interest Statement in this document. This should, however, not be treated as endorsement of the views expressed in the report.
Motilal Oswal Securities Limited is registered as a Research Analyst under SEBI (Research Analyst) Regulations, 2014. SEBI Reg. No. INH000000412
Pending Regulatory inspections against Motilal Oswal Securities Limited:
SEBI pursuant to a complaint from client Shri C.R. Mohanraj alleging unauthorized trading, issued a letter dated 29th April 2014 to MOSL notifying appointment of an Adjudicating Officer as per SEBI regulations to hold inquiry and
adjudge violation of SEBI Regulations; MOSL replied to the Show Cause Notice whereby SEBI granted us an opportunity of Inspection of Documents. Since all the documents requested by us were not covered we have requested to
SEBI vide our letter dated June 23, 2015 to provide pending list of documents for inspection.
List of associate companies of Motilal Oswal Securities Limited -Click
here to access detailed report
Analyst Certification
The views expressed in this research report accurately reflect the personal views of the analyst(s) about the subject securities or issues, and no part of the compensation of the research analyst(s) was, is, or will be directly or
indirectly related to the specific recommendations and views expressed by research analyst(s) in this report. The research analysts, strategists, or research associates principally responsible for preparation of MOSt research receive
compensation based upon various factors, including quality of research, investor client feedback, stock picking, competitive factors and firm revenues
Disclosure of Interest Statement
Analyst ownership of the stock
Served as an officer, director or employee
Persistent Systems
No
No
A graph of daily closing prices of securities is available at www.nseindia.com and http://economictimes.indiatimes.com/markets/stocks/stock-quotes
Regional Disclosures (outside India)
This report is not directed or intended for distribution to or use by any person or entity resident in a state, country or any jurisdiction, where such distribution, publication, availability or use would be contrary to law, regulation or which
would subject MOSt & its group companies to registration or licensing requirements within such jurisdictions.
For Hong Kong:This
report is distributed in Hong Kong by Motilal Oswal capital Markets (Hong Kong) Private Limited, a licensed corporation (CE AYY-301) licensed and regulated by the Hong Kong Securities and Futures
Commission (SFC) pursuant to the Securities and Futures Ordinance (Chapter 571 of the Laws of Hong Kong) “SFO”. As per SEBI (Research Analyst Regulations) 2014 Motilal Oswal Securities (SEBI Reg No. INH000000412) has
an agreement with Motilal Oswal capital Markets (Hong Kong) Private Limited for distribution of research report in Kong Kong. This report is intended for distribution only to “Professional Investors” as defined in Part I of Schedule 1 to
SFO. Any investment or investment activity to which this document relates is only available to professional investor and will be engaged only with professional investors.” Nothing here is an offer or solicitation of these securities,
products and services in any jurisdiction where their offer or sale is not qualified or exempt from registration. The Indian Analyst(s) who compile this report is/are not located in Hong Kong & are not conducting Research Analysis in
Hong Kong.
Motilal Oswal Securities Limited (MOSL) is not a registered broker - dealer under the U.S. Securities Exchange Act of 1934, as amended (the"1934 act") and under applicable state laws in the United States. In addition MOSL is not a
registered investment adviser under the U.S. Investment Advisers Act of 1940, as amended (the "Advisers Act" and together with the 1934 Act, the "Acts), and under applicable state laws in the United States. Accordingly, in the
absence of specific exemption under the Acts, any brokerage and investment services provided by MOSL, including the products and services described herein are not available to or intended for U.S. persons.
This report is intended for distribution only to "Major Institutional Investors" as defined by Rule 15a-6(b)(4) of the Exchange Act and interpretations thereof by SEC (henceforth referred to as "major institutional investors"). This
document must not be acted on or relied on by persons who are not major institutional investors. Any investment or investment activity to which this document relates is only available to major institutional investors and will be
engaged in only with major institutional investors. In reliance on the exemption from registration provided by Rule 15a-6 of the U.S. Securities Exchange Act of 1934, as amended (the "Exchange Act") and interpretations thereof by
the U.S. Securities and Exchange Commission ("SEC") in order to conduct business with Institutional Investors based in the U.S., MOSL has entered into a chaperoning agreement with a U.S. registered broker-dealer, Motilal Oswal
Securities International Private Limited. ("MOSIPL"). Any business interaction pursuant to this report will have to be executed within the provisions of this chaperoning agreement.
The Research Analysts contributing to the report may not be registered /qualified as research analyst with FINRA. Such research analyst may not be associated persons of the U.S. registered broker-dealer, MOSIPL, and therefore,
may not be subject to NASD rule 2711 and NYSE Rule 472 restrictions on communication with a subject company, public appearances and trading securities held by a research analyst account.
For Singapore
Motilal Oswal Capital Markets Singapore Pte Limited is acting as an exempt financial advisor under section 23(1)(f) of the Financial Advisers Act(FAA) read with regulation 17(1)(d) of the Financial Advisors Regulations and is a
subsidiary of Motilal Oswal Securities Limited in India. This research is distributed in Singapore by Motilal Oswal Capital Markets Singapore Pte Limited and it is only directed in Singapore to accredited investors, as defined in the
Financial Advisers Regulations and the Securities and Futures Act (Chapter 289), as amended from time to time.
In respect of any matter arising from or in connection with the research you could contact the following representatives of Motilal Oswal Capital Markets Singapore Pte Limited:
Varun Kumar
Varun.kumar@motilaloswal.com
Contact : (+65) 68189232
Office Address:21 (Suite 31),16 Collyer Quay,Singapore 04931
Kadambari Balachandran
kadambari.balachandran@motilaloswal.com
(+65) 68189233 / 65249115
For U.S
24 July 2016
Motilal Oswal Tower, Level 9, Sayani Road, Prabhadevi, Mumbai 400 025
Phone: +91 22 3982 5500 E-mail: reports@motilaloswal.com
Motilal Oswal Securities Ltd
12