25 July 2016
1QFY17 Results Update | Sector:
Financials
BSE SENSEX
28,095
S&P CNX
8,636
CMP: INR742
Indiabulls Housing Finance
TP: INR866 (+17%)
Buy
Bloomberg
IHFL IN
Equity Shares (m)
426.2
M.Cap. (INR b) / (USD b) 312.6/4.6
52-Week Range (INR)
820 / 551
1, 6, 12 Rel. Per (%)
7/-10/2
12M Avg Val (INR M)
1462
Free float (%)
75.8
Financials & Valuation (INR Billion)
Y/E March
2016 2017E 2018E
Net Fin inc
28.7 36.5 45.7
PPP
36.3 44.3 54.6
EPS (INR)
55.7 68.2 84.0
EPS Gr. (%)
4.1 22.6 23.0
BV/Sh. (INR)
254 280 315
3.3
3.3
RoA on AUM (%)
3.4
RoE (%)
27.1 25.6 28.2
Payout (%)
64.7 52.5 50.0
Valuations
P/E (x)
13.3 10.9 8.8
P/BV (x)
2.9
2.6
2.4
P/ABV (x)
2.9
2.6
2.4
Div. Yield (%)
4.9
4.8
5.7
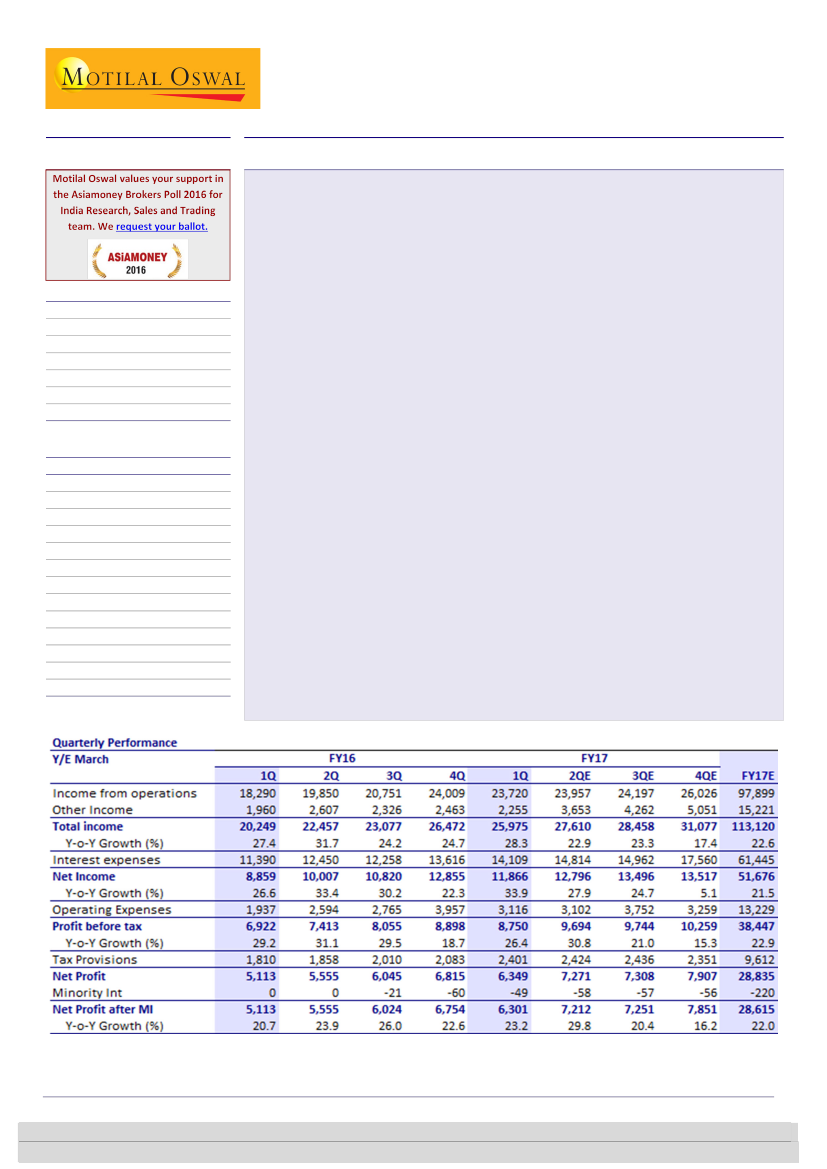
Indiabulls Housing Finance’s (IHFL) PAT grew 23% YoY but declined 7% QoQ to
INR6.3b (In-line with our est. of INR6.2b). Strong AUM growth of 30.9% YoY, stable
asset quality and book spreads of 318bp were the key highlights of the quarter.
AUM growth remained healthy at 31% YoY to INR 710b; Loan mix continues to
shift in favor of housing loans—will increase from the existing 53% to 60% by FY18
and 65% by FY20. Home loan disbursements to the salaried segment is 70% and to
the self-employed segment is 30% - would continue to maintain the proportion.
NII growth was robust at 39% YoY on the back of 318bp of book spreads and
300bp incremental spreads. Overall cost of funds stood at 9.25%, down 35bp YoY
driven by decrease in bank borrowings as well as increased sell-downs, whereas
incremental borrowing cost stood 8.9%.
GNPAs remained stable sequentially at 0.84%; however provisions at INR1.26b
almost doubled as compared to INR0.65b in 1QFY16on a lower base as IHFL had
standard asset provisions buffer during last quarter.
Other highlights
a) O/S ZCBs stand at INR10.6b v/s INR19.6b in 1Q16- wont issue
further ZCBs. b) Sold loans of INR11.14b in 1QFY17 v/s 5.22b in 1QFY16 c)
Launched e-Home loans during the quarter d) Subordinate debt was upgraded to
AAA in the quarter.
Valuation and view:
IHFL’s transformation from a diversified lender to a focused
mortgage player has yielded returns, with RoE/RoA improving from 3%/0.8% in
FY09 to +26%/3.5% in FY16. Focus on mortgage and market share gains will drive
AUM growth of 26% over the next two years. IHFL is among the lowest-levered
HFCs (4.6x) to support growth. Asset quality trend is likely to remain stable.
Improved borrowing profile, better credit rating and liquidity buffer will aid the
company maintain healthy spreads. De-risked business model, superior
profitability and +5% dividend yield warrant premium. The stock is trading at PBV
of 2.4x FY18E. Maintain
Buy
with a target price of INR866 (2.75x FY18E PB).
Sunesh Khanna
(Sunesh.Khanna@MotilalOswal.com); +91 22 3982 5521
Alpesh Mehta
(Alpesh.Mehta@MotilalOswal.com)/Piran
Engineer
(Piran.Engineer@MotilalOswal.com); +91 22 3980 4393
Investors are advised to refer through important disclosures made at the last page of the Research Report.
Motilal Oswal research is available on www.motilaloswal.com/Institutional-Equities, Bloomberg, Thomson Reuters, Factset and S&P Capital.

Indiabulls Housing Finance
Exhibit 1: Quarterly performance v/s expectations and deviations for the same
Particulars
Income from operations
Other Income
Total income
Interest expenses
Net Income
Operating Expenses
Profit before Tax
Tax Provisions
Net Profit
Minority Int
Net Profit (after minority interest)
Int Exp/ operating inc (%)
Other Income / Total Income (%)
Tax Rate (%)
E: MOSt Estimates
1QFY17A
23,720
2,255
25,975
14,109
11,866
3,116
8,750
2,401
6,301
0
6,301
59.5
8.7
27.4
1QFY17E
24,249
2,283
26,532
14,842
11,690
3,302
8,388
2,097
6,232
0
6,232
61.2
8.6
25.0
Var. (%)
-2
-1
-2
-5
2
-6
4
14
1
0
1
Comments
In-line with estimate; Spreads stable
Book spreads sequentially stable at 318bp
In-line with estimate
AUM growth robust at +31% YoY
While disbursements grew 16% YoY to INR52.5b, AUM grew 31% to INR707bn.
The overall AUM mix skewed continues to be in favor of mortgages (share
remaining stable at 77%), with share of corporate financing at 23%. The
company has wound up the CV financing book.
Management continues to focus on increasing the proportion of residential
home loans. It targets the share to increase from existing 53% to 60% by FY18
and to 65% by FY20.
Management guides to 20-25% growth across all major parameters over the
next few years
Strong growth and stable spreads led to 39% YoY NII growth
NII growth was strong at 39% YoY, on back of strong AUM growth coupled with
sequentially stable book spreads of 318bp; the company has effectively
mitigated the impact of lower yields by proportionately reducing the cost of
funds. Overall cost of funds stood at 9.25% (9.34% in 4QFY16) and incremental
cost of funds at 8.9%.
The proportion of bank borrowings declined from 55% in 1QFY16 to 47% in
1QFY17. Management targets overall share of bank borrowings at 30% by FY20.
Correspondingly, the target share of market borrowings by FY20 is 40%, for sell-
downs is 20% and for ECBs is 10%. Management believes the reduction in cost
of funds achieved through this change in liability mix shall offset the impact of
lower yields due to higher share of residential home loans.
ZCBs have come down sharply and now form 1.6% of total borrowings. The
company has decided not to issue further ZCBs.
Sell down of INR11.14b during 1QFY17 v/s INR5.22b in 1QFY16.
Asset quality continue to remain stable
GNPA% remained steady at 0.84% and NNPA at 0.36% respectively. GNPAs have
remained stable; however provisions at INR1.26b for the quarter almost
doubled on a YoY basis. NPA provisioning stood at INR1.01b, the rest comprising
standard asset provisioning.
25 July 2016
2

Indiabulls Housing Finance
Recoveries were quite strong during the quarter and exceeded total write-offs
by a margin of INR150mn.
Other highlights:
a) Launched e-Home loans during the quarter b) Subordinate
debt was upgraded to AAA in the quarter c) Concluded a $250mn ECB
transaction in 2QFY16 d) CAR stands at 23.81%, with Tier I capital at 19.87% e)
The outstanding exposure to the distressed project, Palais Royale, is INR5.73bn
Valuation and view
Indiabulls Housing Finance Ltd (IHFL) has transformed from a diversified lender
to a focused mortgage player. Mortgage focus has yielded returns, with
RoE/RoA improving from 3%/0.8% in FY09 to +26%/3.5% in FY16.
IHFL has devised a unique strategy – 77% of the book forms mortgage/LAP
(which keeps asset quality under check) and 23% of book forms commercial
credit (supports blended spreads of +300bp), thereby enabling sound asset
quality with superior returns.
Disbursement growth has picked up, we believe focus on mortgage and market
share gains will drive AUM growth of ~26% for next two years. One of the
lowest levered HFCs (4.6x), IHFL would need no further dilution over the
medium term.
Consistent outperformance on key parameters relative to sector. Average three-
year RoE at 27% is the best among the peer group. The company offers superior
return ratios with +5% dividend yield. The stock is trading at PBV of 2.4x FY18.
Maintain
Buy
with a target price of INR866 (2.75x FY18 PB).
Conference call highlights
Macro Highlights
There has been good traction in residential home sales in the Top 6 cities in
1HCY16. With YoY growth of 46%, affordable housing comprises 70% of home
sales. Inventory levels with developers have come down in recent months.
Office leasing in CY16 is expected to register YoY growth.
IHFL’s incremental mortgage market share stands at ~6% (including banks)
Business Updates:
Launched their online home loan product, e-Home loans, during the quarter.
This would enable much faster application turnaround time and would help
cater to customers in Tier 2 & 3 geographies as well as NRIs.
The company’s subordinate debt was upgraded to AAA in the quarter. Currently,
the company borrows at 40bp above CRISIL AAA rated corporates. With a CRISIL
upgrade to AAA, management expects the spread to reduce to only 20bp.
Continue to maintain ~20-25% loan book and profit growth guidance over the
medium term.
Disbursed INR52.5b in 1QFY17 (16% YoY) (HL-INR27b, LAP-INR14b and
Commercial Credit –INR12b).
Self-employed segment accounts for 30% of home loan book and 24% of LAP
book. Would continue to maintain the proportion.
53% of the loan book now comprise of pure HL. Looking to increase the same to
60% by FY18 and 65% by FY20.
25 July 2016
3

Indiabulls Housing Finance
Within the commercial financing segment, 60% of disbursements is towards
LRD, while 40% is construction financing. The main markets for LRD are
Gurgaon, Pune and Bangalore while that for construction financing are Gurgaon
and Mumbai.
Others
Management is hopeful of receiving partial occupancy certificate for the
distressed project, Palais Royale, within the next 4-5 months. Outstanding
customer receivables due from that project amount to INR10b. IHFL’s exposure
to the project stands at INR5.73b.
The break-up of INR8.75b outstanding provisions is as follows – Substandard
asset provisions: INR3.4b, General provisions: INR1.86b, Specific provisions:
INR1.54b, Floating provisions: 0.89b and Standard asset provisions: INR4.46b.
Capital adequacy ratio at quarter end was 23.81%, with Tier I capital at 19.87%.
25 July 2016
4

Indiabulls Housing Finance
Exhibit 2: Quarterly Snapshot
FY15
1Q
Profit and Loss (INR m)
Income from operations
Interest Expenses
Net Interest Income
Other Income
Total Income
Operating Expenses
Employee
Others
PBT
Taxes
PAT
Minority Interest
PAT Post Minority Interest
Asset Quality
GNPA (INR m)
NNPA (INR m)
Gross NPAs (%)
Net NPAs (%)
Provisions on AUM (%)
Margins (%) - (calculated)
Yield on loans
Cost of funds
Spreads
NIMs
Ratios (%)
Cost to Income
Tax Rate
RoE (Calc.)
RoA (Calc.)
Business Details
Disbursements-Quarterly (INR m)
AUM (INR m)
Borrowings (INR m)
Total AUM Mix (%)
Mortgages
Corporate
CV
Liability Mix (%)
Bank Loans
CP
NCD
ECB
Other Details
Dividend (INR/sh)
13,641
8,894
4,747
2,249
6,996
1,640
716
924
5,356
1,119
4,238
0
4,238
2Q
15,186
9,553
5,632
1,872
7,504
1,851
894
956
5,654
1,171
4,483
0
4,483
3Q
17,011
10,281
6,730
1,577
8,307
2,085
817
1,268
6,222
1,441
4,781
0
4,781
4Q
18,777
10,713
8,064
2,449
10,513
3,020
822
2,198
7,494
1,983
5,511
0
5,511
1Q
18,290
11,390
6,900
1,960
8,859
1,937
914
1,023
6,922
1,810
5,113
0
5,113
2Q
19,850
12,450
7,400
2,607
10,007
2,594
1,059
1,535
7,413
1,858
5,555
0
5,555
FY16
3Q
20,751
12,258
8,493
2,326
10,820
2,765
1,012
1,753
8,055
2,010
6,045
-21
6,024
4Q
24,009
13,616
10,392
2,463
12,855
3,957
1,147
2,811
8,898
2,083
6,815
-60
6,754
FY17
1Q
23,720
14,109
9,611
2,255
11,866
3,116
1,185
1,931
8,750
2,401
6,349
-49
6,301
Variation (%)
QoQ YoY
(1)
4
(8)
(8)
(8)
(21)
3
(31)
(2)
15
(7)
(7)
30
24
39
15
34
61
30
89
26
33
24
23
3,529
1,463
0.84
0.35
0.49
3,827
1,523
0.85
0.34
0.51
4,135
1,626
0.86
0.34
0.52
3,913
1,871
0.85
0.36
0.49
4,071
1,935
0.85
0.36
0.49
4,309
2,028
0.84
0.35
0.49
4,553
2,169
0.83
0.35
0.48
5,116
2,393
0.84
0.35
0.49
5,430
2,533
0.84
0.36
0.48
6
6
33
31
9.8
9.7
0.1
4.9
10.2
9.7
0.6
4.7
11.2
9.1
2.1
5.2
12.0
8.9
3.1
6.1
11.1
9.3
1.8
5.2
11.2
9.6
1.6
5.2
10.7
8.4
2.3
5.2
11.6
8.2
3.4
5.6
10.8
7.9
2.9
5.0
23.4
20.9
30.48
3.74
24.7
20.7
31.23
3.72
25.1
23.2
34.54
3.98
28.7
26.5
30.72
3.49
21.9
26.1
26.07
3.51
25.9
25.1
23.08
3.49
25.6
25.0
25.47
3.66
30.8
23.4
0.00
0.00
26.3
27.4
0.00
0.00
(43)
3
8
16
31
46
36,700 48,000 53,500 64,190 45,250 61,900 64,740 91,370 52,500
420,140 450,268 480,780 522,350 540,215 582,246 622,650 687,000 707,000
378,640 411,030 491,560 474,870 508,630 527,620 636,290 689,100 744,800
75
21
4
60
8
32
0
8
76
21
3
54
7
28
0
9
76
21
3
53
7
28
1
9
76
22
2
59
7
31
3
9
76
22
2
55
7
35
3
9
76
23
1
47
6
33
2
9
76
23
1
49
6
31
2
9
77
22
1
49
0
38
2
0
77
23
0
47
0
40
2
0
Source: Company, MOSL
25 July 2016
5

Indiabulls Housing Finance
Story in charts
Exhibit 3: Disb. growth at 16% YoY
Disbursement (INR b)
54
64
45
62
65
91
25
53
23
Exhibit 4: AUM growth remains robust at +31%
AUM (INR b)
AUM Gr. (%)
36
35
31
38
37
48
20
20
14
23
18
27
29
29
30
32
31
Source: Company, MOSL
*AUM numbers are reclassified, hence not comparable
Exhibit 5: AUM mix has been stable
Others
CV
Corporate
Mortgages
Exhibit 6: Bank borrowings will continue to decline
Sell Down (%)
ECB(%)
NCD (%)
CP (%)
Bank Loans (%)
8 8 7 7 6 6 5 4 3 3 2 2 1 1 1 0
21 20 21 21 21 21 21 21 21 21 22 22 23 23 22 23
71 72 72 72 73 73 74 75 76 76 76 76 76 76 77 77
31
8
61
25
6
59
27
7
55
30
8
62
32
8
60
28
7
54
28
7
53
31
7
59
35
7
55
33
6
47
31
6
49
38
0
49
40
0
47
Source: Company, MOSL
Exhibit 7: Asset quality remains healthy
GNPA (%)
NNPA (%)
Exhibit 8: Net gearing (x) among lowest compared to peers
5.6 5.7
5.1 5.1 5.3 5.3
6.1 5.9 6.3
3.9
4.3
4.7 4.6
0.9 0.9 0.8 0.8 0.9 0.9 0.9 0.9 0.8 0.8 0.8 0.8
0.8 0.8
0.8 0.8
0.3 0.3 0.3 0.3
0.4 0.5
0.4 0.4 0.3 0.3 0.4 0.4 0.4 0.4 0.4 0.4
Source: Company, MOSL
25 July 2016
6

Indiabulls Housing Finance
Exhibit 9: Financials: Valuation metrics
Rating
66
CMP
Mcap
EPS (INR)
P/E (x)
BV (INR)
P/BV (x)
RoA (%)
RoE (%)
FY17
11.1
18.9
13.8
14.2
22.0
16.2
7.2
8.0
11.3
12.7
10.7
FY18
11.8
19.6
14.4
15.4
22.7
17.6
9.4
9.0
11.7
13.7
11.7
(INR) (USDb) FY17 FY18 FY17 FY18 FY17 FY18 FY17 FY18 FY17 FY18
ICICIBC*
Buy
269
23.7 18.1 20.8 11.1
8.4
145 159 1.30 1.09 1.19 1.22
HDFCB
Buy
1,247
47.8 58.4 70.2 21.3 17.7 332 386 3.75 3.23 1.90 1.89
AXSB
Buy
538
19.4 31.8 37.4 16.9 14.4 243 274 2.21 1.97 1.32 1.31
KMB*
Buy
765
21.3 26.8 34.0 28.6 22.5 207 240 3.69 3.19 1.61 1.82
YES
Buy
1,183
7.5
78.9 97.3 15.0 12.2 391 468 3.03 2.53 1.81 1.83
IIB
Buy
1,157
10.4 50.5 63.8 22.9 18.1 334 389 3.46 2.97 1.92 1.96
IDFC Bk
Buy
51
2.6
3.0
4.1
17.1 12.3
42
46
1.20 1.12 1.09 1.12
FB
Neutral
66
1.7
3.9
4.7
16.9 14.1
50
54
1.32 1.23 0.67 0.67
DCBB
Buy
100
0.4
7.4
8.6
13.6 11.7
69
78
1.45 1.29 0.98 0.93
JKBK
Neutral
69
0.5
17.6 21.2
3.9
3.2
146 162 0.47 0.42 0.99 1.05
SIB
Buy
22
0.4
3.1
3.7
7.1
5.9
30
33
0.73 0.67 0.61 0.64
Private Aggregate
135.8
19.7 16.5
2.64 2.34
SBIN (cons)*
Buy
230
27.0 19.3 24.3 11.9
9.4
240 259 1.01 0.93 0.49 0.54
PNB
Neutral
130
3.9
15.7 19.9
8.3
6.5
200 220 0.65 0.59 0.44 0.50
BOI
Neutral
110
1.4
9.3 23.5 11.9
4.7
337 356 0.33 0.31 0.12 0.27
BOB
Buy
156
5.5
14.7 18.7 10.6
8.3
159 173 0.98 0.90 0.48 0.54
CBK
Neutral
254
2.1
33.1 42.4
7.7
6.0
505 537 0.50 0.47 0.31 0.36
UNBK
Buy
132
1.4
26.8 36.7
4.9
3.6
318 351 0.41 0.37 0.43 0.53
OBC
Neutral
116
0.6
22.1 27.9
5.2
4.2
473 494 0.25 0.23 0.28 0.32
INBK
UR
153
1.1
22.2 29.1
6.9
5.3
298 320 0.51 0.48 0.49 0.56
ANDB
Buy
61
1.9
2.9
8.2
20.6
7.4
129 136 0.47 0.45 0.15 0.39
Public Aggregate
44.8
11.8
8.7
0.76 0.71
Banks Aggregate
180.6
16.9 13.5
1.64 1.50
HDFC*
Buy
1,380
33.0 40.1 46.3 24.2 19.4 194 221 4.64 3.75 1.89 2.10
LICHF
Buy
518
4.0
39.5 47.3 13.1 10.9 213 251 2.43 2.07 1.49 1.51
IHFL
Buy
742
4.7
68.2 84.0 10.9
8.8
280 315 2.65 2.36 3.84 3.78
GRHF
Buy
292
1.6
8.3 10.7 35.1 27.4
28
35 10.28 8.27 2.33 2.34
REPCO
Buy
828
0.8
30.3 39.0 27.3 21.2 179 214 4.61 3.87 2.14 2.17
DEWH
Buy
225
1.0
29.7 36.4
7.6
6.2
194 221 1.16 1.02 1.19 1.21
Housing Finance
45.1
21.3 18.0
4.30 3.80
RECL
Neutral
216
3.2
59.2 68.6
3.6
3.1
336 389 0.64 0.56 2.63 2.55
POWF
Neutral
222
4.4
46.8 49.1
4.7
4.5
72
107 3.09 2.08 2.69 2.35
Infra Finance
7.7
4.2
3.8
1.20 0.97
SHTF
Buy
1,198
4.1
75.5 94.2 15.9 12.7 507 581 2.36 2.06 2.17 2.27
MMFS
Buy
321
2.7
15.5 18.8 20.7 17.0 119 133 2.69 2.42 2.14 2.26
BAF
Buy
8,978
7.3 308.1 380.8 29.1 23.6 1,631 1,956 5.51 4.59 3.14 3.02
MUTH
Buy
278
1.7
24.9 32.0 11.2
8.7
157 177 1.77 1.57 3.29 3.47
SKSM
Buy
864
1.7
48.8 52.5 17.7 16.5 157 210 5.49 4.12 6.30 4.48
Asset Finance
17.5
19.8 16.1
3.18 2.87
NBFC Aggregate
70.3
14.6 12.6
3.14 2.72
Financials
250.9
16.2 13.2
1.89 1.71
*Multiples adj. for value of key ventures/Investments; For ICICI Bank and HDFC Ltd BV is adjusted for investments in subsidiaries
8.3 9.7
8.2 9.5
2.8 6.8
9.6 11.2
6.7 8.1
8.7 11.0
4.8 5.8
7.7 9.4
2.3 6.2
20.0
20.1
23.4
32.4
18.2
16.2
22.1
20.9
28.2
33.5
19.8
17.5
18.9 18.9
85.1 55.0
15.7
13.7
20.6
16.7
36.7
17.1
15.0
21.2
19.2
28.6
25 July 2016
7

Indiabulls Housing Finance
Financials and valuations
Income Statement
Y/E March
Financing Income
Financing Charges
Net Financing income
Change (%)
Income from Investments
Fee based income
Net Income
Change (%)
Employee Cost
Other Operating Exp.
Operating profits
Change (%)
Total Provisions
% of operating profit
PBT
Tax
Tax Rate (%)
PAT
Change (%)
Minority Interest
PAT
Change (%)
Dividend (Including tax)
Balance Sheet
Y/E March
Capital
Equity Share Capital
Reserves & Surplus
Net Worth
Equity Net worth
Minority Interest
Borrowings
Change (%)
Deferred Tax Liability
Total Liabilities
Cash and bank balance
Investments
Change (%)
Loans
Change (%)
Net Current Assets
Net Fixed Assets
Total Assets
AUM Mix
Assets Under Management
Change (%)
On Books
% of AUM
Off books
% of AUM
E: MOSL Estimates
2012
32,235
19,201
13,035
6.4
1,980
3,604
19,264
19.6
1,924
1,770
15,570
23.3
2,349
15.1
13,220
3,156
23.9
10,065
34.0
83
9,981
34.4
4,709
2013
42,634
25,991
16,643
27.7
2,748
2,397
21,789
13.1
2,245
1,761
17,783
14.2
1,231
6.9
16,551
3,891
23.5
12,661
25.8
76
12,584
26.1
7,277
2014
51,865
32,824
19,041
14.4
4,852
2,329
26,222
20.3
2,637
1,470
22,115
24.4
2,297
10.4
19,818
4,133
20.9
15,685
23.9
44
15,642
24.3
11,298
2015
61,210
39,442
21,768
14.3
8,055
3,439
33,262
26.8
3,249
2,285
27,728
25.4
3,003
10.8
24,725
5,713
23.1
19,012
21.2
1
19,011
21.5
10,531
2016
78,418
49,714
28,704
31.9
8,607
5,230
42,541
27.9
4,131
2,118
36,292
30.9
5,003
13.8
31,289
7,760
24.8
23,529
23.8
82
23,447
23.3
17,750
2017E
97,899
61,445
36,455
27.0
9,468
5,753
51,676
21.5
5,082
2,320
44,275
22.0
5,827
13.2
38,447
9,612
25.0
28,835
22.6
90
28,745
22.6
17,657
2018E
121,082
75,375
45,706
25.4
10,888
6,616
63,261
22.4
6,200
2,435
54,626
23.4
7,335
13.4
47,291
11,823
25.0
35,468
23.0
100
35,368
23.0
20,690
(INR Million)
2019E
151,466
93,671
57,795
26.4
11,977
7,278
77,150
22.0
7,316
2,555
67,279
23.2
7,329
10.9
59,950
14,987
25.0
44,962
26.8
50
44,912
27.0
26,274
2012
624
624
48,432
49,056
49,056
1,315
252,870
30.9
-1,098
302,143
41,956
17,968
-41.8
254,675
31.1
-12,901
445
302,143
2013
625
625
51,061
51,686
51,686
1,449
312,858
23.7
-1,641
364,351
48,882
23,079
28.4
307,824
20.9
-15,889
456
364,351
2014
668
668
56,387
57,055
57,055
19
355,395
13.6
-1,848
410,622
44,190
29,470
27.7
354,446
15.1
-18,639
469
410,622
2015
711
711
65,606
66,317
66,317
20
474,874
33.6
-26
541,186
34,903
61,638
109.2
460,396
29.9
-16,978
541
541,186
2016
843
843
106,096
106,939
106,939
0
601,900
26.7
-26
708,812
29,028
106,930
73.5
609,000
32.3
-37,521
690
708,812
2017E
843
843
117,185
118,027
118,027
0
712,423
18.4
-26
830,424
6,532
117,623
10.0
749,919
23.1
-45,026
690
830,424
2018E
843
843
131,862
132,705
132,705
0
908,548
27.5
-26
1,041,226
26,949
129,385
10.0
936,647
24.9
-53,130
690
1,041,226
2019E
843
843
150,501
151,343
151,343
0
1,127,783
24.1
-26
1,279,100
48,571
141,030
9.0
1,150,799
22.9
-62,694
709
1,279,100
(%)
1,353,881
24.3
1,150,799
85.0
203,082
15.0
275,212
38.8
253,460
92.1
21,752
7.9
344,250
25.1
307,824
89.4
36,426
10.6
411,690
19.6
354,446
86.1
57,244
13.9
522,350
26.9
460,396
88.1
61,954
11.9
687,000
31.5
609,026
88.7
77,975
11.4
866,958
26.2
749,919
86.5
117,039
13.5
1,089,125
25.6
936,647
86.0
152,477
14.0
25 July 2016
8

Indiabulls Housing Finance
Financials and valuations
Ratios
Y/E March
Spreads Analysis (%)
Avg. Yield - on Fin. Portfolio
Avg Cost of funds
Interest Spread on on books
Net Interest Margin on AUM
Profitability Ratios (%)
RoE
RoA
RoA (on AUM)
Int. Expended/Int.Earned
Fee income/Net Inc.
Cost/Income Ratio
Empl. Cost/Op. Exps.
Asset quality
GNPA (%)
NNPA (%)
Valuations
Book Value (INR)
BV Growth (%)
Price-BV (x)
Adjusted BV (INR)
Price-ABV (x)
EPS (INR)
EPS Growth (%)
Price-Earnings (x)
DPS (INR)
Dividend Payout (%)
Dividend Yield (%)
E: MOSL Estimates
2012
14.1
8.6
5.5
5.5
2013
13.5
10.1
3.4
5.4
2014
13.1
10.1
3.0
5.0
2015
12.7
9.7
3.0
4.7
2016
12.6
9.4
3.2
4.7
2017E
12.6
9.4
3.3
4.7
2018E
12.4
9.3
3.1
4.7
2019E
12.4
9.2
3.2
4.7
21.1
3.7
3.5
59.6
18.7
19.2
52.1
25.0
3.8
3.5
61.0
11.0
18.0
56.1
27.0
4.0
3.6
63.3
8.9
17.1
64.2
30.8
4.0
3.6
64.4
10.3
16.6
58.7
27.1
3.8
3.4
63.4
12.3
14.7
66.1
25.6
3.7
3.3
62.8
11.1
14.3
68.7
28.2
3.8
3.3
62.3
10.5
13.6
71.8
31.6
3.9
3.4
61.8
9.4
12.8
74.1
0.79
0.33
2012
157.3
7.8
4.7
157.4
4.7
32.0
34.0
23.2
13.0
40.6
1.8
0.79
0.33
2013
165.4
5.1
4.5
165.4
4.5
40.3
25.8
18.4
20.0
49.6
2.7
0.83
0.36
2014
170.8
3.3
4.3
170.8
4.3
46.8
16.3
15.8
29.0
61.7
3.9
0.85
0.36
2015
186.5
9.2
4.0
186.5
4.0
53.5
14.2
13.9
35
47.9
4.7
0.80
0.40
2016
253.8
36.1
2.9
253.8
2.9
55.7
4.1
13.3
36.0
64.7
4.9
0.80
0.40
2017E
280.2
10.4
2.6
280.2
2.6
68.2
22.6
10.9
35.8
52.5
4.8
0.80
0.40
2018E
315.0
12.4
2.4
315.0
2.4
84.0
23.0
8.8
42.0
50.0
5.7
0.80
0.40
2019E
359.2
14.0
2.1
359.2
2.1
106.6
27.0
7.0
53.3
58.5
7.2
25 July 2016
9

Indiabulls Housing Finance
Corporate profile
Company description
Indiabulls Housing Finance (IHFL) is the fourth
largest housing finance company in India with
AUM of INR707b. It was established as a wholly-
owned subsidiary of Indiabulls Financial Services
(IBFSL). In early 2013, keeping with IHFL’s long-
term commitment to the housing finance business,
the company was reversed-merged into its housing
finance subsidiary IHFL. IHFL offers home loans to
target client base of middle and upper-middle
income individuals and small and medium-sized
enterprises, or SMEs. It has presence across 200+
locations across India.
Exhibit 11: Shareholding pattern (%)
Jun-16
Promoter
DII
FII
Others
24.2
2.6
59.4
13.8
Mar-16
24.2
2.6
58.7
14.5
Jun-15
27.8
2.7
39.4
30.1
Exhibit 10: Sensex rebased
Exhibit 12: Top holders
Holder Name
EUROPACIFIC GROWTH FUND
COPTHALL MAURITIUS INVESTMENT LIMITED
MERRILL LYNCH CAPITAL MARKETS ESPANA S.A. S.V
RAJIV RATTAN
CREDIT SUISSE (SINGAPORE) LIMITED
% Holding
6.2
5.3
3.8
3.5
2.5
Note: FII Includes depository receipts
Exhibit 13: Top management
Name
Sameer Gehlaut
Gagan Banga
Ashwini Kumar
Mukesh Garg
Pinank Shah
Ramnath Shenoy
Designation
Chairman
Vice Chairman and MD
Deputy Managing Director
Chief Financial Officer
Head Treasury
Executive Vice President, IR
Exhibit 14: Directors
Name
Sameer Gehlaut
Gagan Banga
Rajiv Rattan
Saurabh Kumar Mittal
Karan Singh Khera*
Ram Kumar Sheokand*
Prem Prakash Mirdha*
*Independent
Name
Shamsher Singh Ahlawat*
Aisharya Katoch
Joginder Singh Kataria
Ajit Kumar Mittal
Ashwini Omprakash Kumar
Kamalesh Shailesh Chandra Chakrabarty*
Exhibit 15: Auditors
Name
Deloitte Haskins & Sells LLP
N D Kapur & Co
Type
Statutory
Internal
Exhibit 16: MOSL forecast v/s consensus
EPS
(INR)
FY17
FY18
MOSL
forecast
68.2
84.0
Consensus
forecast
68.3
82.7
Variation
(%)
-0.2
1.6
25 July 2016
10

Indiabulls Housing Finance
NOTES
25 July 2016
11

Disclosures
This document has been prepared by Motilal Oswal Securities Limited (hereinafter referred to as Most) to provide information about the company(ies) and/sector(s), if any, covered in the report and may be distributed by it and/or its
affiliated company(ies). This report is for personal information of the selected recipient/s and does not construe to be any investment, legal or taxation advice to you. This research report does not constitute an offer, invitation or
Indiabulls Housing Finance
inducement to invest in securities or other investments and Motilal Oswal Securities Limited (hereinafter referred as MOSt) is not soliciting any action based upon it. This report is not for public distribution and has been furnished to
you solely for your general information and should not be reproduced or redistributed to any other person in any form. This report does not constitute a personal recommendation or take into account the particular investment
objectives, financial situations, or needs of individual clients. Before acting on any advice or recommendation in this material, investors should consider whether it is suitable for their particular circumstances and, if necessary, seek
professional advice. The price and value of the investments referred to in this material and the income from them may go down as well as up, and investors may realize losses on any investments. Past performance is not a guide for
future performance, future returns are not guaranteed and a loss of original capital may occur.
MOSt and its affiliates are a full-service, integrated investment banking, investment management, brokerage and financing group. We and our affiliates have investment banking and other business relationships with a some
companies covered by our Research Department. Our research professionals may provide input into our investment banking and other business selection processes. Investors should assume that MOSt and/or its affiliates are
seeking or will seek investment banking or other business from the company or companies that are the subject of this material and that the research professionals who were involved in preparing this material may educate investors
on investments in such business. The research professionals responsible for the preparation of this document may interact with trading desk personnel, sales personnel and other parties for the purpose of gathering, applying and
interpreting information. Our research professionals are paid on the profitability of MOSt which may include earnings from investment banking and other business.
MOSt generally prohibits its analysts, persons reporting to analysts, and members of their households from maintaining a financial interest in the securities or derivatives of any companies that the analysts cover. Additionally, MOSt
generally prohibits its analysts and persons reporting to analysts from serving as an officer, director, or advisory board member of any companies that the analysts cover. Our salespeople, traders, and other professionals or affiliates
may provide oral or written market commentary or trading strategies to our clients that reflect opinions that are contrary to the opinions expressed herein, and our proprietary trading and investing businesses may make investment
decisions that are inconsistent with the recommendations expressed herein. In reviewing these materials, you should be aware that any or all of the foregoing among other things, may give rise to real or potential conflicts of interest.
MOSt and its affiliated company(ies), their directors and employees and their relatives may; (a) from time to time, have a long or short position in, act as principal in, and buy or sell the securities or derivatives thereof of companies
mentioned herein. (b) be engaged in any other transaction involving such securities and earn brokerage or other compensation or act as a market maker in the financial instruments of the company(ies) discussed herein or act as an
advisor or lender/borrower to such company(ies) or may have any other potential conflict of interests with respect to any recommendation and other related information and opinions.; however the same shall have no bearing
whatsoever on the specific recommendations made by the analyst(s), as the recommendations made by the analyst(s) are completely independent of the views of the affiliates of MOSt even though there might exist an inherent
conflict of interest in some of the stocks mentioned in the research report
Reports based on technical and derivative analysis center on studying charts company's price movement, outstanding positions and trading volume, as opposed to focusing on a company's fundamentals and, as such, may not match
with a report on a company's fundamental analysis. In addition MOST has different business segments / Divisions with independent research separated by Chinese walls catering to different set of customers having various
objectives, risk profiles, investment horizon, etc, and therefore may at times have different contrary views on stocks sectors and markets.
Unauthorized disclosure, use, dissemination or copying (either whole or partial) of this information, is prohibited. The person accessing this information specifically agrees to exempt MOSt or any of its affiliates or employees from, any
and all responsibility/liability arising from such misuse and agrees not to hold MOSt or any of its affiliates or employees responsible for any such misuse and further agrees to hold MOSt or any of its affiliates or employees free and
harmless from all losses, costs, damages, expenses that may be suffered by the person accessing this information due to any errors and delays. The information contained herein is based on publicly available data or other sources
believed to be reliable. Any statements contained in this report attributed to a third party represent MOSt’s interpretation of the data, information and/or opinions provided by that third party either publicly or through a subscription
service, and such use and interpretation have not been reviewed by the third party. This Report is not intended to be a complete statement or summary of the securities, markets or developments referred to in the document. While we
would endeavor to update the information herein on reasonable basis, MOSt and/or its affiliates are under no obligation to update the information. Also there may be regulatory, compliance, or other reasons that may prevent MOSt
and/or its affiliates from doing so. MOSt or any of its affiliates or employees shall not be in any way responsible and liable for any loss or damage that may arise to any person from any inadvertent error in the information contained in
this report. MOSt or any of its affiliates or employees do not provide, at any time, any express or implied warranty of any kind, regarding any matter pertaining to this report, including without limitation the implied warranties of
merchantability, fitness for a particular purpose, and non-infringement. The recipients of this report should rely on their own investigations.
This report is intended for distribution to institutional investors. Recipients who are not institutional investors should seek advice of their independent financial advisor prior to taking any investment decision based on this report or for
any necessary explanation of its contents.
Most and it’s associates may have managed or co-managed public offering of securities, may have received compensation for investment banking or merchant banking or brokerage services, may have received any compensation for
products or services other than investment banking or merchant banking or brokerage services from the subject company in the past 12 months.
Most and it’s associates have not received any compensation or other benefits from the subject company or third party in connection with the research report.
Subject Company may have been a client of Most or its associates during twelve months preceding the date of distribution of the research report
MOSt and/or its affiliates and/or employees may have interests/positions, financial or otherwise of over 1 % at the end of the month immediately preceding the date of publication of the research in the securities mentioned in this
report. To enhance transparency, MOSt has incorporated a Disclosure of Interest Statement in this document. This should, however, not be treated as endorsement of the views expressed in the report.
Motilal Oswal Securities Limited is registered as a Research Analyst under SEBI (Research Analyst) Regulations, 2014. SEBI Reg. No. INH000000412
There are no material disciplinary action that been taken by any regulatory authority impacting equity research analysis activities
Analyst Certification
The views expressed in this research report accurately reflect the personal views of the analyst(s) about the subject securities or issues, and no part of the compensation of the research analyst(s) was, is, or will be directly or
indirectly related to the specific recommendations and views expressed by research analyst(s) in this report. The research analysts, strategists, or research associates principally responsible for preparation of MOSt research receive
compensation based upon various factors, including quality of research, investor client feedback, stock picking, competitive factors and firm revenues
Disclosure of Interest Statement
Analyst ownership of the stock
Served as an officer, director or employee
Indiabulls Housing Finance
No
No
A graph of daily closing prices of securities is available at www.nseindia.com and http://economictimes.indiatimes.com/markets/stocks/stock-quotes
Regional Disclosures (outside India)
For U.S.
This report is not directed or intended for distribution to or use by any person or entity resident in a state, country or any jurisdiction, where such distribution, publication, availability or use would be contrary to law, regulation or which
would subject MOSt & its group companies to registration or licensing requirements within such jurisdictions.
Motilal Oswal Securities Limited (MOSL) is not a registered broker - dealer under the U.S. Securities Exchange Act of 1934, as amended (the"1934 act") and under applicable state laws in the United States. In addition MOSL is not a
registered investment adviser under the U.S. Investment Advisers Act of 1940, as amended (the "Advisers Act" and together with the 1934 Act, the "Acts), and under applicable state laws in the United States. Accordingly, in the
absence of specific exemption under the Acts, any brokerage and investment services provided by MOSL, including the products and services described herein are not available to or intended for U.S. persons.
This report is intended for distribution only to "Major Institutional Investors" as defined by Rule 15a-6(b)(4) of the Exchange Act and interpretations thereof by SEC (henceforth referred to as "major institutional investors"). This
document must not be acted on or relied on by persons who are not major institutional investors. Any investment or investment activity to which this document relates is only available to major institutional investors and will be
engaged in only with major institutional investors. In reliance on the exemption from registration provided by Rule 15a-6 of the U.S. Securities Exchange Act of 1934, as amended (the "Exchange Act") and interpretations thereof by
the U.S. Securities and Exchange Commission ("SEC") in order to conduct business with Institutional Investors based in the U.S., MOSL has entered into a chaperoning agreement with a U.S. registered broker-dealer, Motilal Oswal
Securities International Private Limited. ("MOSIPL"). Any business interaction pursuant to this report will have to be executed within the provisions of this chaperoning agreement.
The Research Analysts contributing to the report may not be registered /qualified as research analyst with FINRA. Such research analyst may not be associated persons of the U.S. registered broker-dealer, MOSIPL, and therefore,
may not be subject to NASD rule 2711 and NYSE Rule 472 restrictions on communication with a subject company, public appearances and trading securities held by a research analyst account.
This report is distributed in Hong Kong by Motilal Oswal capital Markets (Hong Kong) Private Limited, a licensed corporation (CE AYY-301) licensed and regulated by the Hong Kong Securities and Futures Commission (SFC)
pursuant to the Securities and Futures Ordinance (Chapter 571 of the Laws of Hong Kong) “SFO”. As per SEBI (Research Analyst Regulations) 2014 Motilal Oswal Securities (SEBI Reg No. INH000000412) has an agreement with
Motilal Oswal capital Markets (Hong Kong) Private Limited for distribution of research report in Kong Kong. This report is intended for distribution only to “Professional Investors” as defined in Part I of Schedule 1 to SFO. Any
investment or investment activity to which this document relates is only available to professional investor and will be engaged only with professional investors.”
Nothing here is an offer or solicitation of these securities, products and services in any jurisdiction where their offer or sale is not qualified or exempt from registration. The Indian Analyst(s) who compile this report is/are not located in
Hong Kong & are not conducting Research Analysis in Hong Kong.
For Hong Kong:
For Singapore
Motilal Oswal Capital Markets Singapore Pte Limited is acting as an exempt financial advisor under section 23(1)(f) of the Financial Advisers Act(FAA) read with regulation 17(1)(d) of the Financial Advisors Regulations and is a
subsidiary of Motilal Oswal Securities Limited in India. This research is distributed in Singapore by Motilal Oswal Capital Markets Singapore Pte Limited and it is only directed in Singapore to accredited investors, as defined in the
Financial Advisers Regulations and the Securities and Futures Act (Chapter 289), as amended from time to time.
In respect of any matter arising from or in connection with the research you could contact the following representatives of Motilal Oswal Capital Markets Singapore Pte Limited:
Kadambari Balachandran
Email : kadambari.balachandran@motilaloswal.com
Contact : (+65) 68189233 / 65249115
Office Address : 21 (Suite 31),16 Collyer Quay,Singapore 04931
25 July 2016
Motilal Oswal Tower, Level 9, Sayani Road, Prabhadevi, Mumbai 400 025
Phone: +91 22 3982 5500 E-mail: reports@motilaloswal.com
Motilal Oswal Securities Ltd
12