27 July 2016
Results Update | Sector: Consumer
Asian Paints
Neutral
BSE SENSEX
28,024
S&P CNX
8,615
CMP: INR1,062 TP: INR970(-9%)
Healthy growth, stellar margin performance
Motilal Oswal values your support in
the Asiamoney Brokers Poll 2016 for
India Research, Sales and Trading
team. We
request your ballot.
Bloomberg
Equity Shares (m)
M.Cap.(INRb)/(USDb)
52-Week Range (INR)
1, 6, 12 Rel. Per (%)
12M Avg Val (INR M)
Free float (%)
APNT IN
959.2
1018.5 / 15.6
1080 / 779
1/9/23
1040
47.2
Financials & Valuations (INR b)
2016 2018E
Y/E Mar
153.3 160.5
Net Sales
26.1
31.2
EBITDA
17.8
21.4
NP
18.5
22.3
EPS (INR)
25.0
20.1
EPS Gr. (%)
58.4
68.3
BV/Sh. (INR)
34.4
35.1
RoE (%)
30.8
32.1
RoCE (%)
57.3
47.7
P/E (x)
18.2
15.6
P/BV (x)
2018E
187.8
36.1
24.8
25.9
16.3
80.7
34.8
31.8
41.0
13.2
Estimate change
TP change
Rating change
+8%
+13%
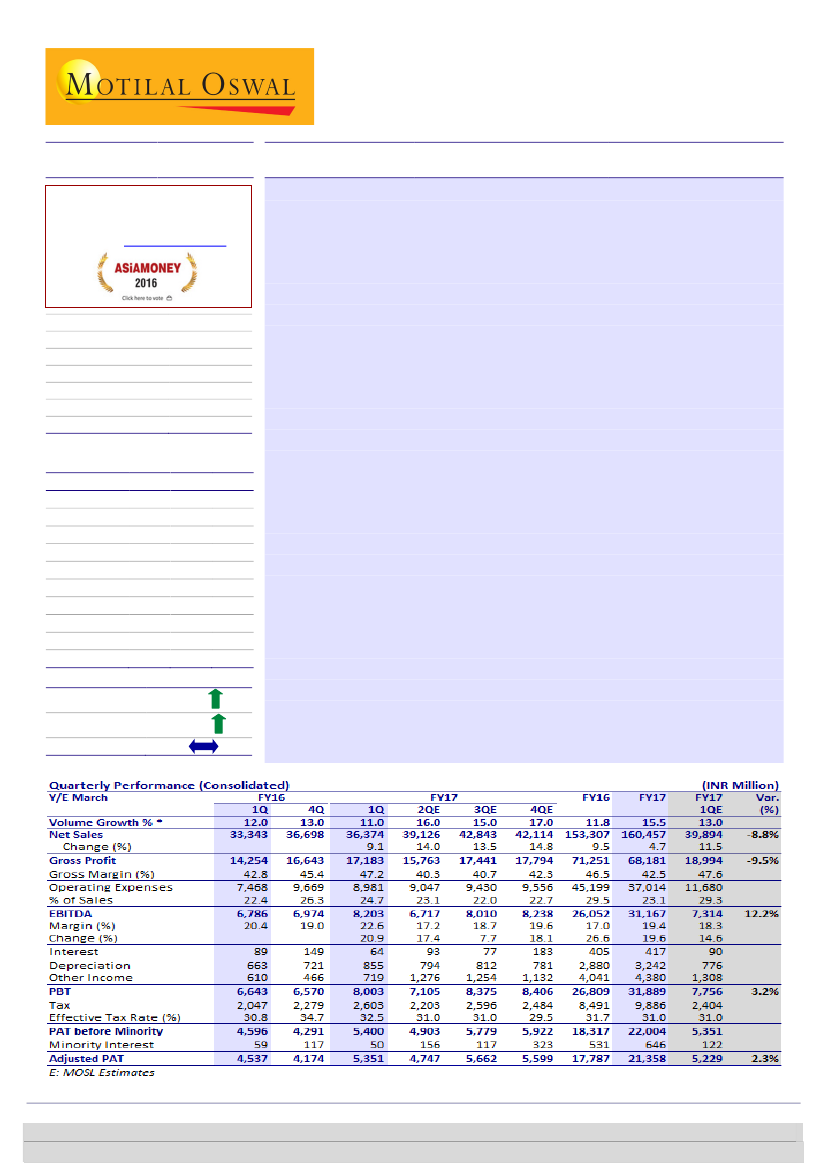
Asian Paints (APNT)
posted 1Q17 consol. sales growth of 9.1% YoY (est.11.5%)
to INR36.4b (IndAS) with estimated 11% volume growth (management
mentioned lower double digit growth) in the domestic decorative paints
business despite base of 12% volume growth in 1Q16. Consol. EBITDA/Adj. PAT
grew 20.9% (est.14.6%)/ 17.9% YoY (est.14.9%) to INR8.2b and INR5.3b resp.
Domestic Decorative paints business posted est. 11% volume growth
aided by
recovery in demand, reducing repainting cycles and continued strong rural
growth ahead of urban growth led by increase in permanent dwellings, low
base and expanding distribution reach.
Gross margin expanded 450bp YoY
(est. 200bp YoY) to 47.2% led by benign
input costs. Despite higher other expenses (up 180bp YoY) and employee
expenses (up 50bp YoY) EBITDA margin expanded 220 bp YoY (est. 50 bp YoY
improvement) to 22.6%. Thus EBITDA posted growth of 20.9% YoY (est. 14.6%)
to INR8.2b. High depreciation (up 29% YoY) and higher tax rate (up 170 bp YoY
to 32.5) led to PAT growth of 17.9% YoY (est. 14.9%) to INR5.3b. Imputed sub.
Sales, EBITDA and Adj. PAT grew 10.5%, 29.1% and 29.4% resp.
Concall takeaways:
(a) Demand uniformly good all across the country. There
has been no major shift from unorganized to organized recently which makes
the double digit domestic decorative volume growth highly creditable; (b)
Healthy demand is also being witnessed in kitchen and batch fittings as well as
industrial and auto paints.
Valuation and view:
We upgrade estimates by 8% due to possible pick-up in
demand in 2HFY17 and sustained gross margin improvements. APNT enjoys
strong position in the Deco Paints industry, backed by unparalleled supply
chain leadership. However, steep stock price increase of 19% in last 3 months
and fair valuations prevents us from being more constructive. Maintain Neutral
with a revised target price of INR970 (36x June’2018).
Investors are advised to refer through important disclosures made at the last page of the Research Report.
Motilal Oswal research is available on www.motilaloswal.com/Institutional-Equities, Bloomberg, Thomson Reuters, Factset and S&P Capital.
Krishnan Sambamoorthy
(Krishnan.Sambamoorthy@MotilalOswal.com); +91 22 6129 1545
Vishal Punmiya
(Vishal.Punmiya@MotilalOswal.com); +91 22 6129 1547