27 July 2016
1QFY17 Results Update | Sector:
Financials
BSE SENSEX
25,437
S&P CNX
7,806
CMP: INR1,388
TP: INR1,563 (+13%)
HDFC
Buy
Motilal Oswal values your support in
the Asiamoney Brokers Poll 2016 for
India Research, Sales and Trading
team. We
request your ballot.
Strong pick-up in disbursements drives AUM growth to 16.4% YoY; Retail
continues to gain share
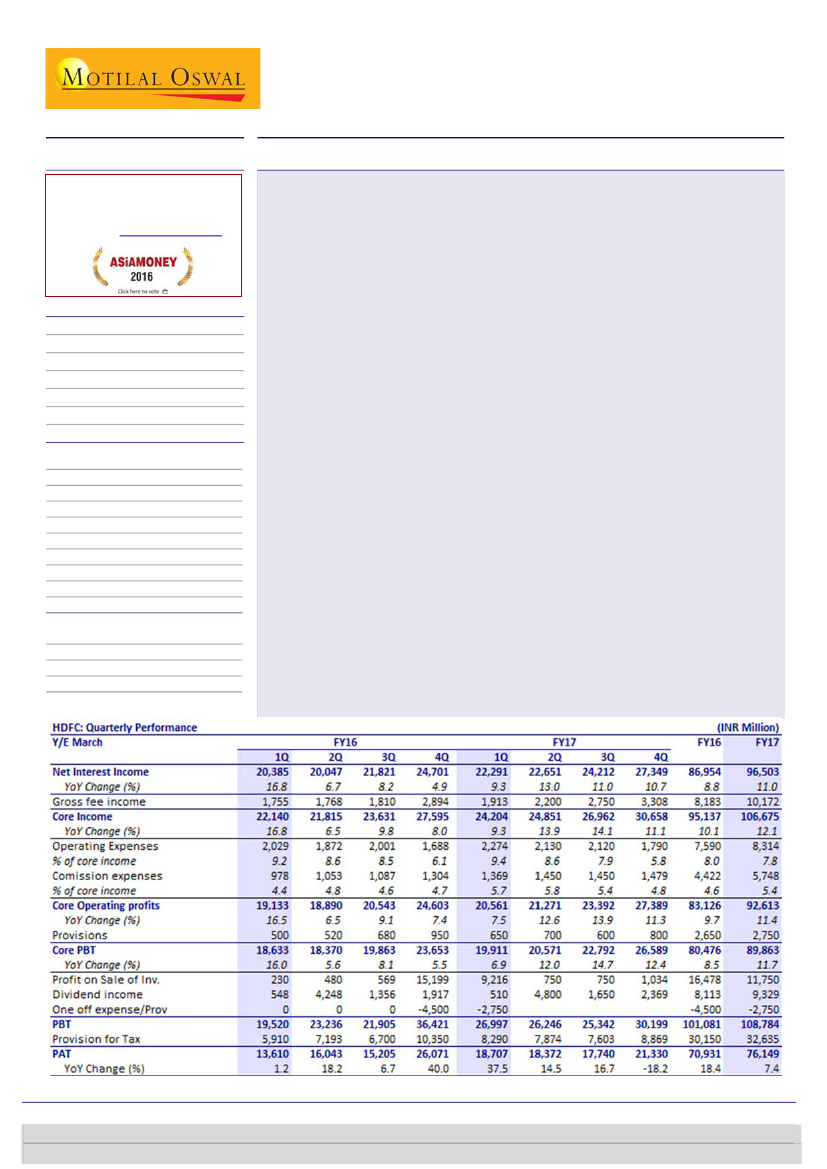
HDFC’s 1QFY17 headline PBT growth of 38% YoY (to INR27.0b) was driven by
one-off income due to gains on stake sale of its insurance venture (INR9.2b),
partially offset by INR2.75b addition to contingency provisions. Retail loan
growth (on AUM) picked up to 18% YoY, driving overall AUM growth of 16.4%
YoY. Individual disbursement grew 26% YoY (the highest in 13 quarters).
NII of INR24.7b was in line with our estimate. The gradual mix shift toward
residential loans resulted in spread compression of 5bp YoY and 3bp QoQ to
2.26%. This was driven by spread compression in the retail book by 5bp YoY and
2bp QoQ to 1.92%, given intense competition from not only HFCs but also large
banks.
Asset quality witnessed marginal deterioration with GNPA ticking up 6bp YoY to
75bp. This was driven by a 5bp YoY increase in retail segment GNPL to 59bp and
a 7bp rise in corporate segment GNPL to 1.11%.
Other highlights
a) Reported NIMs were flat YoY at 3.8%. b) Share of retail loans
in overall AUM increased 50bp QoQ to 73.3%. c) ATS in retail segment increased
8% YoY to INR2.53m. d) Share of off-balance sheet AUM in overall AUM
remained largely stable at ~12%. e) Sold loans worth INR33b to HDFC Bank and
INR 18.1b to other banks during the quarter. f) INR 3.6b deducted from net
worth due to MTM on derivative transaction.
Valuation and view:
HDFC’s retail loan growth is impressive, despite
heightened competitive pressures. Core PBT growth moderated to 9% in FY16
v/s 13-16% over FY12-15, led by a change in the AUM mix and higher buyback
by HDFC Bank. For FY17-19E, we expect largely stable spreads (pressure on
retail spreads to be compensated by lower cost of funds). We expect NII/core
PBT CAGR of ~14% on the back of ~15% CAGR in loans. The stock is trading at
FY17E/18E AP/E of 26x/22x and AP/BV of 4.6x/3.8x. Maintain
Buy
with SOTP of
INR1,563/share.
Bloomberg
HDFC IN
Equity Shares (m)
1,574.7
M.Cap. (INR b) / (USD b) 2176.2/32.6
52-Week Range (INR)
1398 / 1012
1, 6, 12 Rel. Per (%)
7/6/2
12M Avg Val (INR M)
3476
Free float (%)
100.0
Financials & Valuation (INR Billion)
Y/E MAR
2016 2017E 2018E
NII
87.0
96.5 110.1
PAT
70.9
76.1
87.1
EPS (INR)
30.8
34.6
37.9
EPS Gr. (%)
6.1
12.4
9.6
BV/Sh. (INR) 221.7 245.8 273.7
ABV/Sh. INR 169.5 193.6 217.1
RoAA (%)
2.6
2.5
2.5
Core RoE (%) 21.5
19.5
19.0
Payout (%)
43.9
43.5
43.5
Valuation
AP/E (x)
31.3
25.8
21.6
P/BV (x)
6.2
5.6
5.0
AP/ABV (x)
5.7
4.6
3.8
Sunesh Khanna
(Sunesh.Khanna@MotilalOswal.com); +91 22 3982 5521
Alpesh Mehta
(Alpesh.Mehta@MotilalOswal.com)/Piran
Engineer
(Piran.Engineer@MotilalOswal.com); +91 22 3980 4393
Investors are advised to refer through important disclosures made at the last page of the Research Report.
Motilal Oswal research is available on www.motilaloswal.com/Institutional-Equities, Bloomberg, Thomson Reuters, Factset and S&P Capital.

HDFC
AUM mix shifts towards Retail—Share up 50bp QoQ
HDFC’s AUMs grew 16.4% YoY and 3.4% QoQ to INR3.0t driven by 18.0% AUM
growth in the retail segment and 12.3% AUM growth in the corporate segment.
The share the overall AUM increased 50bp sequentially to 73.3%.
The strong growth in retail AUM was driven by 26% YoY growth in
disbursements (highest in 13 quarters) to INR309b. There was an 8% increase in
average ticket size of retail disbursements to INR2.53m. Management suggested
some traction in the Mumbai metropolitan area lead to this increase, revival in
Mumbai market bodes well for future outlook.
With the continued higher buy back by HDFCB, share of off balance AUM
increased 80bp sequentially to 11.9%.
Stable asset quality; Higher provisions led by contingency provisions
%GNPAs on 90-day overdue basis increased 6bp sequentially to 75bp, while PCR
was ~150%
The increase in GNPL was driven by a 5bp YoY increase in retail segment GNPL
to 59bp and 7bp increase in corporate segment GNPL to 1.11%.
Provisioning expenses for the quarter stood at INR3.4b v/s INR500m reported
during last year. Current quarter included a one-off contingency provision of
INR2.75b during the quarter.
Outstanding provisions at the end of the quarter including standard asset
provisions on the balance sheet stood at INR30.2b.
Reported spreads down 5bp YoY and 3bp QoQ
HDFC witnessed spread compression of 5bp YoY and 3bp QoQ to 2.26%. This
was driven by spreads in the retail book compressing 5bp YoY and 2bp QoQ to
1.92% given the intense competition from not only HFCs but also large banks.
Share of bank borrowing increased to ~14% vs 9% a year ago. Share of bank
borrowing increased in order to benefit from base rate reduction by banks
following rate cut by the central bank.
Other highlights
CAR stood at 16.5% of which Tier I capital was 13.1% and Tier II 3.4%.
There was a INR3.6b reduction to net-worth due to MTM losses on derivative
transactions
Corporate segment growth was driven primarily by LRD
HDFC also sold down Sold loans worth INR33b to HDFC Bank and INR 18.1b to
other banks during the quarter
INR 3.6b deducted from networth due to MTM on derivative transaction.
27 July 2016
2

HDFC
Valuation and view
HDFC’s retail loans portfolio continues to grow at healthy pace as it continues to
pass the benefit of fall in borrowing rates to customers. However there is
beginning to be pressure on margins.
Core PBT growth has moderated to 9% vs 13-16% over FY12-15 led by change in
AUM mix and higher buy back by HDFCB. Pick up in corporate segment in the
quarter is encouraging from earnings perspective.
We have not taken into account the dilution effect (Max: 2.2% dilution) arising
out of 36.5m warrants issued recently as the warrants can be converted into
shares anytime within the next 36 months.
For FY17-19E we expect largely stable spreads (pressure on retail spreads to
compensated by lower cost of funds). We expect NII/Core PBT CAGR of ~14% on
back of ~15% CAGR in loans. The stock is trading at FY17/18E AP/E of 26x/22x
and ABV of 4.6x/3.8x. Maintain Buy with SOTP of INR1,563/share.
Key risk:
Heightened level of competition in retail segment and delay in uptick in
corporate portfolio can be a risk to earnings and growth
Value
(INR b)
1,575
Value Value/
% of total
(USD b) Sh. (INR)
23.6
1,000
76.1
Rationale
4.5x FY18 Adjusted BV (for investments in subs
and HDFC Bank, Implied P/E of 26x Core EPS)
Valued at 3.8x FY18E BV
Appraisal Value; 61.4% economic stake
5% FY18E AUM, 18x FY18E PAT
13.3% of total AUM USD0.8b
Last stake sale value + 15%
Based on our Target price of INR351/share
Exhibit 1:
SOTP FY18E Based (INR)
Core business
Key Ventures
HDFC Bank (22.5% stake)
HDFC Standard Life (61.5% stake)
HDFC AMC (60% stake)
Property Funds
HDFC General Insurance (51% stake)
Gruh Finance
Total Value of Ventures
Less: 20% holding discount
Value of Key Ventures
Target Value Post 20% Holding Co Disc
CMP
Upside - %
Target Price w/o 20% Holding Company Discount
CMP
Upside - %
788
134
75
7
25
78
1,107
221
886
2,461
2,186
12.6
2,683
2,186
23
11.8
2.0
1.1
0.1
0.4
1.2
16.6
3.3
13.3
36.9
32.7
12.6
40.2
32.7
23
501
85
48
4
16
49
703
141
563
1,563
1,388
12.6
1,704
1,388
23
38.1
6.5
3.6
0.3
1.2
3.8
53.5
10.7
42.8
118.8
Source: MOSL
27 July 2016
3

HDFC
Story in charts
Exhibit 2: Loans (net of sell down) grew by +15% YoY
Loans (INR b)
21 19 19 19
YoY Gr. (%)
20 22
16 15 15 14 16
14 12 13 14 15
-12
29
16
Exhibit 3: Disbursements (INR b) up sharply at 26% YoY
Disb (INR b)
19
14
2
18 21
0
YoY Growth
16 15 15 17 18
26
Source: Company, MOSL
Exhibit 4: AUM (including sell down) grew 16% YoY
AUM (INR b)
AUM Gr. (% YoY)
Exhibit 5: Overall AUM mix skewed in favor of retail
Individual Loans
Corporate and Other Loans
20 20
18 18 16
15 16 16 16 15
33 33 31 31 30 30 29 29 29 29 28 29 28 27 27 27 27
15
15
15 16
67 67 69 69 70 70 71 71 71 71 72 71 72 73 73 73 73
Source: Company, MOSL
Exhibit 6: NII grew 9% YoY v/s AUM growth of 16%
NII (INR m)
20
18
21
17 19
YoY Gr. (%)
20
24
20 20
22
25
22
Exhibit 7: NII including fees grew +9% YoY
NII (incl Fees) - INR m
21
14 14 16
16 16
23
18
19
20 21
26
YoY Gr. (%)
22 22 24
28
24
15
15 16
13 14
24
17
19
15 19 14
14 17 14 14
11
10
8
7
8
5
9
19
21 15 15 14 15
9
9
20 25 17
14 17
6
11 8
9
Source: Company, MOSL
27 July 2016
4

HDFC
Story in charts
Exhibit 8: Asset quality remain stable
0.8 0.8 0.8
0.7 0.7
0.7 0.7 0.7 0.7 0.7 0.7 0.7
0.8
28 33 33 33 33 32 31 31 32 31 32 32 33 34 32 31 33
46
26
54 59 56 59 49 56 51 52 56 56 56 57 55 54 51 53
13 8 11 8 19 13 18 16 13 11 13 9 11 14 18 14
Exhibit 9: Bank funding has declined QoQ (%)
Term Loans
Bonds, Deb, FCCBs and CPs
Deposits
Source: Company, MOSL
Exhibit 10: Reported spreads have declined
Spread %
2.29
2.24 2.25
2.32 2.31
2.29 2.29 2.29 2.31 2.322.31
2.29
2.26
Exhibit 11: … so does corporate and retail spread
Corporate (%)
3.03 3.10 3.06 3.10 3.09 3.10 3.06
2.82 2.76 2.82 2.95 2.99 2.97
2.011.98 1.97 1.97 1.96 1.97 1.95 1.96 1.97 1.97 1.97 1.94 1.92
Retail (%)
Source: Company, MOSL
27 July 2016
5

HDFC
Exhibit 12:
Financials - Valuation
metrics
Rating
66
ICICIBC*
Buy
HDFCB
Buy
AXSB
Buy
KMB*
Buy
YES
Buy
IIB
Buy
IDFC Bk
Buy
FB
Neutral
DCBB
Buy
JKBK
Neutral
SIB
Buy
Private Aggregate
SBIN (cons)* Buy
PNB
Neutral
BOI
Neutral
BOB
Buy
CBK
Neutral
UNBK
Buy
OBC
Neutral
INBK
UR
ANDB
Buy
Public Aggregate
Banks Aggregate
HDFC*
Buy
LICHF
Buy
IHFL
Buy
GRHF
Buy
REPCO
Buy
DEWH
Buy
Housing Finance
RECL
Neutral
POWF
Neutral
Infra Finance
SHTF
Buy
MMFS
Buy
BAF
Buy
MUTH
Buy
SKSM
Buy
Asset Finance
NBFC Aggregate
Financials
CMP
Mcap
EPS (INR)
FY17
18.1
58.4
31.8
26.8
78.9
50.5
3.0
3.9
7.4
17.6
3.1
19.3
15.7
9.3
14.7
25.4
26.8
22.1
22.2
2.9
FY18
20.8
70.2
37.4
34.0
97.3
63.8
4.1
4.7
8.6
21.2
3.7
24.3
19.9
23.5
18.7
34.8
36.7
27.9
29.1
8.2
P/E (x)
FY17
11.1
21.2
17.2
28.2
15.2
23.3
17.1
16.6
13.5
3.8
7.0
19.7
11.8
8.5
12.1
10.5
10.3
4.9
5.3
6.9
20.2
12.0
17.0
24.4
13.1
11.3
35.2
27.0
7.5
21.5
3.6
4.7
4.2
16.6
23.1
28.3
12.4
18.2
20.6
14.8
16.3
FY18
8.4
17.6
14.7
22.2
12.3
18.5
12.4
13.9
11.6
3.2
5.8
16.5
9.4
6.7
4.8
8.3
7.5
3.6
4.2
5.2
7.3
8.8
13.6
19.6
10.9
9.2
27.5
21.0
6.1
18.2
3.1
4.5
3.8
13.3
17.7
22.1
9.7
16.9
16.5
12.7
13.3
BV (INR)
FY17
145
332
243
207
391
334
42
50
69
146
30
240
200
337
159
497
318
473
298
129
FY18
159
386
274
240
468
389
46
54
78
162
33
259
220
356
173
524
351
494
320
136
P/BV (x)
FY17
1.31
3.72
2.26
3.64
3.07
3.52
1.21
1.30
1.44
0.46
0.72
2.64
1.04
0.66
0.33
0.97
0.53
0.41
0.25
0.51
0.46
0.76
1.64
4.68
2.43
2.76
10.33
4.56
1.14
4.34
0.64
3.07
1.19
2.48
2.72
5.88
1.97
5.63
3.34
3.19
1.90
FY18
1.10
3.20
2.00
3.14
2.56
3.03
1.12
1.21
1.28
0.42
0.66
2.34
0.95
0.60
0.32
0.89
0.50
0.37
0.24
0.48
0.44
0.71
1.50
3.78
2.06
2.46
8.31
3.82
1.01
3.83
0.55
2.06
0.96
2.16
2.45
4.79
1.74
4.22
3.02
2.76
1.72
RoA (%)
FY17
1.19
1.90
1.32
1.61
1.81
1.92
1.09
0.67
0.98
0.99
0.61
0.49
0.44
0.12
0.48
0.24
0.43
0.28
0.49
0.15
FY18
1.22
1.89
1.31
1.82
1.83
1.96
1.12
0.67
0.93
1.05
0.64
0.54
0.50
0.27
0.54
0.30
0.53
0.32
0.56
0.39
RoE (%)
FY17
11.1
18.9
13.8
14.2
22.0
16.2
7.2
8.0
11.3
12.7
10.7
8.3
8.2
2.8
9.6
5.2
8.7
4.8
7.7
2.3
FY18
11.8
19.6
14.4
15.4
22.7
17.6
9.4
9.0
11.7
13.7
11.7
9.7
9.5
6.8
11.2
6.8
11.0
5.8
9.4
6.2
(INR) (USDb)
270
23.8
1,237
47.4
549
19.8
754
21.0
1,200
7.6
1,178
10.6
51
2.6
65
1.7
100
0.4
68
0.5
21
0.4
135.9
229
26.9
133
3.9
112
1.4
155
5.4
261
2.1
131
1.4
117
0.6
153
1.1
60
1.9
44.7
180.6
1,388
33.2
518
4.0
774
4.9
293
1.6
818
0.8
222
1.0
45.5
215
3.2
221
4.4
7.6
1,256
4.3
321
2.7
9,780
7.9
309
1.9
886
1.7
18.6
71.7
252.3
40.1
39.5
68.2
8.3
30.3
29.7
59.2
46.8
75.5
13.9
345.9
24.9
48.8
46.3
47.3
84.0
10.7
39.0
36.4
68.6
49.1
94.2
18.1
442.0
32.0
52.5
194
213
280
28
179
194
336
72
507
118
1,663
157
157
221
251
315
35
214
221
389
107
581
131
2,040
177
210
1.89
1.49
3.74
2.33
2.14
1.19
2.63
2.69
2.17
1.92
3.48
3.29
6.30
2.10
1.51
3.78
2.34
2.17
1.21
2.55
2.35
2.27
2.19
3.38
3.47
4.48
20.0
20.1
25.6
32.4
18.2
16.2
18.9
85.1
15.7
12.3
22.8
16.7
36.7
22.1
20.9
28.2
33.5
19.8
17.5
18.9
55.0
17.1
14.5
23.9
19.2
28.6
*Multiples adj. for value of key ventures/Investments; For ICICI Bank and HDFC Ltd BV is adjusted for investments in subsidiaries
Source: MOSL, Company
27 July 2016
6

HDFC
Financials and valuations
Income statement
Y/E March
Interest Income
Interest Expended
Net Interest Income
Change (%)
Fees and Other Charges
Core Income
Change (%)
Operating Expenses
% of core income
Core operating profits
Change (%)
Provisions/write offs
Core PBT
Change (%)
Profit on sale of Invest.
Dividend Income
One off exp/prov
Miscellanous Income
PBT
Tax
Tax Rate (%)
Reported PAT
Change (%)
PAT adjusted for EO
Change (%)
Proposed Dividend
2012
163,687
111,568
52,120
16.3
2,684
54,803
16.5
4,519
8.2
50,284
16.3
800
49,484
16.4
2,702
4,255
0
215
56,656
15,430
27.2
41,226
16.6
41,226
16.6
18,868
2013
200,707
138,909
61,798
18.6
2,413
64,211
17.2
5,389
8.4
58,823
17.0
1,450
57,373
15.9
3,156
4,849
0
351
65,728
17,245
26.2
48,483
17.6
48,483
17.6
22,517
2014
230,323
160,294
70,030
13.3
2,952
72,982
13.7
6,281
8.6
66,701
13.4
1,000
65,701
14.5
2,490
5,665
0
547
74,403
20,000
26.9
54,403
12.2
54,403
12.2
25,523
2015
259,703
179,751
79,952
14.2
6,453
86,405
18.4
10,610
12.3
75,795
13.6
1,650
74,145
12.9
4,413
6,987
0
697
86,242
26,340
30.5
59,902
10.1
59,902
10.1
27,828
2016
280,699
193,745
86,954
8.8
8,183
95,137
10.1
12,011
12.6
83,126
9.7
2,650
80,476
8.5
16,478
8,113
-4,500
515
101,081
30,150
29.8
70,931
18.4
70,931
18.4
31,380
2017E
311,731
215,227
96,503
11.0
10,172
106,675
12.1
14,062
13.2
92,613
11.4
2,750
89,863
11.7
11,750
9,329
-2,750
592
108,784
32,635
30.0
76,149
7.4
76,149
7.4
33,125
2018E
348,377
238,300
110,076
14.1
12,003
122,079
14.4
15,998
13.1
106,081
14.5
6,600
99,481
10.7
13,513
10,729
0
680
124,403
37,321
30.0
87,082
14.4
87,082
14.4
37,881
(INR Million)
2019E
394,372
266,852
127,520
15.8
14,163
141,683
16.1
18,240
12.9
123,443
16.4
7,920
115,523
16.1
15,539
12,338
0
782
144,183
43,255
30.0
100,928
15.9
100,928
15.9
43,904
(INR Million)
2019E
3,160
482,323
485,483
3,582,104
16.0
214,163
4,281,751
3,893,592
16.0
204,248
10.0
7,693
176,218
4,281,751
Balance sheet
Y/E March
Capital
R&S (incl DTL)
Net Worth
Borrowings
Change (%)
Other liabilities
Total Liabilities
Loans
Change (%)
Investments
Change (%)
Net Fixed Assets
Other assets (Incl DTA)
Total Assets
E: MOSL Estimates
2012
2,954
187,222
190,176
1,391,275
20.9
93,749
1,675,199
1,408,746
20.3
122,070
3.2
2,340
142,044
1,675,199
2013
3,093
245,209
248,302
1,588,281
14.2
118,724
1,955,308
1,700,462
20.7
136,135
11.5
2,379
116,332
1,955,308
2014
3,121
276,431
279,552
1,839,732
15.8
135,041
2,254,325
1,971,004
15.9
139,127
2.2
2,805
141,390
2,254,325
2015
3,149
308,557
311,706
2,085,990
13.4
141,820
2,539,517
2,281,809
15.8
142,943
2.7
6,770
107,995
2,539,517
2016
3,160
347,073
350,233
2,376,392
13.9
160,904
2,887,528
2,592,244
13.6
153,454
7.4
6,645
135,185
2,887,528
2017E
3,160
385,097
388,257
2,687,784
13.1
176,995
3,253,035
2,921,504
12.7
168,800
10.0
6,978
155,754
3,253,035
2018E
3,160
429,299
432,458
3,089,190
14.9
194,694
3,716,342
3,357,815
14.9
185,680
10.0
7,326
165,521
3,716,342
27 July 2016
7

HDFC
Financials and valuations
Ratios
Y/E March
Spreads Analysis (%)
Avg Yield on Hsg Loans
Avg. Yield on Funds
Avg. Cost of funds
Interest Spread
Net Interest Margin
Profitability Ratios (%)
RoE
Adjusted RoE
RoA
Adjusted RoA
Efficiency Ratios (%)
Int. Expended/Int.Earned
Other Inc./Net Income
Op. Exps./Net Income
Empl. Cost/Op. Exps.
Asset Quality (INR m)
Gross NPAs
Gross NPAs to Adv. (%)
Net NPAs
Net NPAs to Adv. (%)
VALUATION
Book Value (INR)
Price-BV (x)
Adjusted BV* (INR)
Adj Price-ABV (x)
EPS (INR)
EPS Growth YoY
Adj Price-Earnings (x)
Adjusted EPS (INR)#
Adjusted EPS Growth YoY
Adj Price-Adj EPS (x)
Dividend per share (INR)
Dividend yield (%)
2012
11.8
11.6
8.8
2.8
3.7
2013
12.2
11.9
9.3
2.6
3.7
2014
11.9
11.7
9.4
2.3
3.5
2015
11.6
11.5
9.2
2.3
3.5
2016
11.0
10.9
8.7
2.2
3.4
2017E
10.8
10.7
8.5
2.2
3.3
2018E
10.5
10.5
8.3
2.3
3.3
2019E
10.3
10.3
8.0
2.3
3.3
22.7
19.9
2.69
1.99
22.1
22.1
2.67
2.09
20.6
24.0
2.58
2.16
20.3
24.0
2.50
2.15
21.8
21.5
2.61
1.97
21.1
19.5
2.48
1.85
21.6
19.0
2.50
1.83
22.3
18.4
2.52
1.76
68.2
15.9
7.3
45.5
69.2
14.8
7.4
45.7
69.6
14.3
7.7
44.5
69.2
18.8
10.8
46.5
69.0
27.7
10.0
46.0
69.0
24.8
11.0
46.2
68.4
25.1
10.9
46.4
67.7
25.1
10.7
46.6
10,690
0.8
5,896
0.4
11,990
0.7
7,150
0.4
13,570
0.7
8,140
0.4
15,286
0.7
10,416
0.5
18,146
0.7
12,484
0.5
22,034
0.8
14,872
0.5
26,416
0.8
17,755
0.5
31,453
0.8
21,291
0.5
128.8
10.7
100.5
11.7
27.9
15.8
34.5
21.1
25.4
55.5
11.0
0.8
160.6
8.6
107.4
10.7
31.4
12.3
28.4
24.4
15.6
46.9
12.5
0.9
179.1
7.7
125.7
8.8
34.9
11.2
23.4
27.9
14.1
39.9
14.0
1.0
197.9
7.0
145.6
7.1
38.0
9.1
18.9
29.0
3.9
35.5
15.0
1.1
221.7
6.2
169.5
5.7
44.9
18.0
13.2
30.8
6.1
31.3
17.0
1.2
245.8
5.6
193.6
4.6
48.2
7.4
12.3
34.6
12.4
25.8
18.1
1.3
273.7
5.0
217.1
3.8
55.1
14.4
10.8
37.9
9.6
21.6
20.7
1.5
307.3
4.5
250.7
2.9
63.9
15.9
9.3
44.1
16.6
16.3
24.0
1.7
E: MOSL Estimates; * BV is adj. by ded. invt in Subs/Asso. from NW
# Adjusted EPS is adjusting for dividend from key ventures
27 July 2016
8

HDFC
Corporate profile: HDFC
Company description
HDFC Ltd. incorporates in 1977 as India’s first
housing finance company (HFC). HDFC ltd today, is
the largest HFC with asset under management of
over INR2.6t, 4.9m home loan customers and 1.7m
depositors (largest mobilize of deposits outside
banking system). HDFC ltd has successfully seeded
various other entities in financial services space
which includes 2nd largest private banks (HDFC
Bank) Insurance (Life and General), Asset
Management, Realty, Real Estate Venture Capital,
Education Loans among others.
Exhibit 19: Sensex rebased
Exhibit 14: Shareholding pattern (%)
Jun-16
Promoter
DII
FII
Others
0.0
11.4
76.9
11.8
Mar-16
0.0
10.5
77.4
12.1
Jun-15
0.0
9.5
78.8
11.7
Exhibit 15: Top holders
Holder Name
Oppenheimer Developing Markets Fund
Life Insurance Corporation Of India
Europacific Growth Fund
Government Of Singapore
Vanguard Emerging Markets Stock Index Fund Aseries
% Holding
4.4
3.8
3.3
2.0
1.5
Note: FII Includes depository receipts
Exhibit 16: Top management
Name
Deepak S Parekh
Keki M Mistry
Renu Sud Karnad
Designation
Chairman
Vice Chairman & MD & CEO
Managing Director
Exhibit 17: Directors
Name
Deepak S Parekh
Keki M Mistry
Renu Sud Karnad
S A Dave*
J J Irani*
D N Ghosh*
Name
B S Mehta*
N M Munjee*
Bimal Jalan*
Ram S Tarneja*
D M Sukthankar*
V Srinivasa Rangan
*Independent
Exhibit 18: Auditors
Name
Deloitte Haskins & Sells LLP
Pannell Kerr Forster
Type
Statutory
Branch
Exhibit 19: MOSL forecast v/s consensus
EPS
(INR)
FY17
FY18
MOSL
forecast
48.2
55.1
Consensus
forecast
48.1
54.2
Variation
(%)
0.2
1.7
27 July 2016
9

Disclosures
by it and/or
This document has been prepared by Motilal Oswal Securities Limited (hereinafter referred to as Most) to provide information about the company (ies) and/sector(s), if any, covered in the report and may be distributed
HDFC
its
affiliated company(ies). This report is for personal information of the selected recipient/s and does not construe to be any investment, legal or taxation advice to you. This research report does not constitute an offer, invitation or
inducement to invest in securities or other investments and Motilal Oswal Securities Limited (hereinafter referred as MOSt) is not soliciting any action based upon it. This report is not for public distribution and has been furnished to
you solely for your general information and should not be reproduced or redistributed to any other person in any form. This report does not constitute a personal recommendation or take into account the particular investment
objectives, financial situations, or needs of individual clients. Before acting on any advice or recommendation in this material, investors should consider whether it is suitable for their particular circumstances and, if necessary, seek
professional advice. The price and value of the investments referred to in this material and the income from them may go down as well as up, and investors may realize losses on any investments. Past performance is not a guide for
future performance, future returns are not guaranteed and a loss of original capital may occur.
MOSt and its affiliates are a full-service, integrated investment banking, investment management, brokerage and financing group. We and our affiliates have investment banking and other business relationships with a some
companies covered by our Research Department. Our research professionals may provide input into our investment banking and other business selection processes. Investors should assume that MOSt and/or its affiliates are
seeking or will seek investment banking or other business from the company or companies that are the subject of this material and that the research professionals who were involved in preparing this material may educate investors
on investments in such business . The research professionals responsible for the preparation of this document may interact with trading desk personnel, sales personnel and other parties for the purpose of gathering, applying and
interpreting information. Our research professionals are paid on twin parameters of performance & profitability of MOSt.
MOSt generally prohibits its analysts, persons reporting to analysts, and members of their households from maintaining a financial interest in the securities or derivatives of any companies that the analysts cover. Additionally, MOSt
generally prohibits its analysts and persons reporting to analysts from serving as an officer, director, or advisory board member of any companies that the analysts cover. Our salespeople, traders, and other professionals or affiliates
may provide oral or written market commentary or trading strategies to our clients that reflect opinions that are contrary to the opinions expressed herein, and our proprietary trading and investing businesses may make investment
decisions that are inconsistent with the recommendations expressed herein. In reviewing these materials, you should be aware that any or all of the foregoing among other things, may give rise to real or potential conflicts of interest.
MOSt and its affiliated company(ies), their directors and employees and their relatives may; (a) from time to time, have a long or short position in, act as principal in, and buy or sell the securities or derivatives thereof of companies
mentioned herein. (b) be engaged in any other transaction involving such securities and earn brokerage or other compensation or act as a market maker in the financial instruments of the company(ies) discussed herein or act as an
advisor or lender/borrower to such company(ies) or may have any other potential conflict of interests with respect to any recommendation and other related information and opinions.; however the same shall have no bearing
whatsoever on the specific recommendations made by the analyst(s), as the recommendations made by the analyst(s) are completely independent of the views of the affiliates of MOSt even though there might exist an inherent
conflict of interest in some of the stocks mentioned in the research report Reports based on technical and derivative analysis center on studying charts company's price movement, outstanding positions and trading volume, as
opposed to focusing on a company's fundamentals and, as such, may not match with a report on a company's fundamental analysis. In addition MOST has different business segments / Divisions with independent research
separated by Chinese walls catering to different set of customers having various objectives, risk profiles, investment horizon, etc, and therefore may at times have different contrary views on stocks sectors and markets.
Unauthorized disclosure, use, dissemination or copying (either whole or partial) of this information, is prohibited. The person accessing this information specifically agrees to exempt MOSt or any of its affiliates or employees from,
any and all responsibility/liability arising from such misuse and agrees not to hold MOSt or any of its affiliates or employees responsible for any such misuse and further agrees to hold MOSt or any of its affiliates or employees free
and harmless from all losses, costs, damages, expenses that may be suffered by the person accessing this information due to any errors and delays. The information contained herein is based on publicly available data or other
sources believed to be reliable. Any statements contained in this report attributed to a third party represent MOSt’s interpretation of the data, information and/or opinions provided by that third party either publicly or through a
subscription service, and such use and interpretation have not been reviewed by the third party. This Report is not intended to be a complete statement or summary of the securities, markets or developments referred to in the
document. While we would endeavor to update the information herein on reasonable basis, MOSt and/or its affiliates are under no obligation to update the information. Also there may be regulatory, compliance, or other reasons that
may prevent MOSt and/or its affiliates from doing so. MOSt or any of its affiliates or employees shall not be in any way responsible and liable for any loss or damage that may arise to any person from any inadvertent error in the
information contained in this report. MOSt or any of its affiliates or employees do not provide, at any time, any express or implied warranty of any kind, regarding any matter pertaining to this report, including without limitation the
implied warranties of merchantability, fitness for a particular purpose, and non-infringement. The recipients of this report should rely on their own investigations.
This report is intended for distribution to institutional investors. Recipients who are not institutional investors should seek advice of their independent financial advisor prior to taking any investment decision based on this report or for
any necessary explanation of its contents.
Most and it’s associates may have managed or co-managed public offering of securities, may have received compensation for investment banking or merchant banking or brokerage services, may have received any compensation
for products or services other than investment banking or merchant banking or brokerage services from the subject company in the past 12 months.
Most and it’s associates have not received any compensation or other benefits from the subject company or third party in connection with the research report.
Subject Company may have been a client of Most or its associates during twelve months preceding the date of distribution of the research report
MOSt and/or its affiliates and/or employees may have interests/positions, financial or otherwise of over 1 % at the end of the month immediately preceding the date of publication of the research in the securities mentioned in this
report. To enhance transparency, MOSt has incorporated a Disclosure of Interest Statement in this document. This should, however, not be treated as endorsement of the views expressed in the report.
Motilal Oswal Securities Limited is registered as a Research Analyst under SEBI (Research Analyst) Regulations, 2014. SEBI Reg. No. INH000000412
Pending Regulatory inspections against Motilal Oswal Securities Limited:
SEBI pursuant to a complaint from client Shri C.R. Mohanraj alleging unauthorized trading, issued a letter dated 29th April 2014 to MOSL notifying appointment of an Adjudicating Officer as per SEBI regulations to hold inquiry and
adjudge violation of SEBI Regulations; MOSL replied to the Show Cause Notice whereby SEBI granted us an opportunity of Inspection of Documents. Since all the documents requested by us were not covered we have requested to
SEBI vide our letter dated June 23, 2015 to provide pending list of documents for inspection.
List of associate companies of Motilal Oswal Securities Limited -Click
here to access detailed report
Analyst Certification
The views expressed in this research report accurately reflect the personal views of the analyst(s) about the subject securities or issues, and no part of the compensation of the research analyst(s) was, is, or will be directly or
indirectly related to the specific recommendations and views expressed by research analyst(s) in this report. The research analysts, strategists, or research associates principally responsible for preparation of MOSt research receive
compensation based upon various factors, including quality of research, investor client feedback, stock picking, competitive factors and firm revenues
Disclosure of Interest Statement
Analyst ownership of the stock
Served as an officer, director or employee
HDFC
No
No
A graph of daily closing prices of securities is available at www.nseindia.com and http://economictimes.indiatimes.com/markets/stocks/stock-quotes
Regional Disclosures (outside India)
This report is not directed or intended for distribution to or use by any person or entity resident in a state, country or any jurisdiction, where such distribution, publication, availability or use would be contrary to law, regulation or which
would subject MOSt & its group companies to registration or licensing requirements within such jurisdictions.
For Hong Kong:
This report is distributed in Hong Kong by Motilal Oswal capital Markets (Hong Kong) Private Limited, a licensed corporation (CE AYY-301) licensed and regulated by the Hong Kong Securities and Futures
Commission (SFC) pursuant to the Securities and Futures Ordinance (Chapter 571 of the Laws of Hong Kong) “SFO”. As per SEBI (Research Analyst Regulations) 2014 Motilal Oswal Securities (SEBI Reg No. INH000000412) has
an agreement with Motilal Oswal capital Markets (Hong Kong) Private Limited for distribution of research report in Kong Kong. This report is intended for distribution only to “Professional Investors” as defined in Part I of Schedule 1 to
SFO. Any investment or investment activity to which this document relates is only available to professional investor and will be engaged only with professional investors.” Nothing here is an offer or solicitation of these securities,
products and services in any jurisdiction where their offer or sale is not qualified or exempt from registration. The Indian Analyst(s) who compile this report is/are not located in Hong Kong & are not conducting Research Analysis in
Hong Kong.
Motilal Oswal Securities Limited (MOSL) is not a registered broker - dealer under the U.S. Securities Exchange Act of 1934, as amended (the"1934 act") and under applicable state laws in the United States. In addition MOSL is not a
registered investment adviser under the U.S. Investment Advisers Act of 1940, as amended (the "Advisers Act" and together with the 1934 Act, the "Acts), and under applicable state laws in the United States. Accordingly, in the
absence of specific exemption under the Acts, any brokerage and investment services provided by MOSL, including the products and services described herein are not available to or intended for U.S. persons.
This report is intended for distribution only to "Major Institutional Investors" as defined by Rule 15a-6(b)(4) of the Exchange Act and interpretations thereof by SEC (henceforth referred to as "major institutional investors"). This
document must not be acted on or relied on by persons who are not major institutional investors. Any investment or investment activity to which this document relates is only available to major institutional investors and will be
engaged in only with major institutional investors. In reliance on the exemption from registration provided by Rule 15a-6 of the U.S. Securities Exchange Act of 1934, as amended (the "Exchange Act") and interpretations thereof by
the U.S. Securities and Exchange Commission ("SEC") in order to conduct business with Institutional Investors based in the U.S., MOSL has entered into a chaperoning agreement with a U.S. registered broker-dealer, Motilal Oswal
Securities International Private Limited. ("MOSIPL"). Any business interaction pursuant to this report will have to be executed within the provisions of this chaperoning agreement.
The Research Analysts contributing to the report may not be registered /qualified as research analyst with FINRA. Such research analyst may not be associated persons of the U.S. registered broker-dealer, MOSIPL, and therefore,
may not be subject to NASD rule 2711 and NYSE Rule 472 restrictions on communication with a subject company, public appearances and trading securities held by a research analyst account.
For Singapore
Motilal Oswal Capital Markets Singapore Pte Limited is acting as an exempt financial advisor under section 23(1)(f) of the Financial Advisers Act(FAA) read with regulation 17(1)(d) of the Financial Advisors Regulations and is a
subsidiary of Motilal Oswal Securities Limited in India. This research is distributed in Singapore by Motilal Oswal Capital Markets Singapore Pte Limited and it is only directed in Singapore to accredited investors, as defined in the
Financial Advisers Regulations and the Securities and Futures Act (Chapter 289), as amended from time to time.
In respect of any matter arising from or in connection with the research you could contact the following representatives of Motilal Oswal Capital Markets Singapore Pte Limited:
Varun Kumar
Varun.kumar@motilaloswal.com
Contact : (+65) 68189232
Office Address:21 (Suite 31),16 Collyer Quay,Singapore 04931
Kadambari Balachandran
kadambari.balachandran@motilaloswal.com
(+65) 68189233 / 65249115
For U.S
27 July 2016
Motilal Oswal Tower, Level 9, Sayani Road, Prabhadevi, Mumbai 400 025
Phone: +91 22 3982 5500 E-mail: reports@motilaloswal.com
Motilal Oswal Securities Ltd
10