1 August 2016
1QFY17 Results Update | Sector: Technology
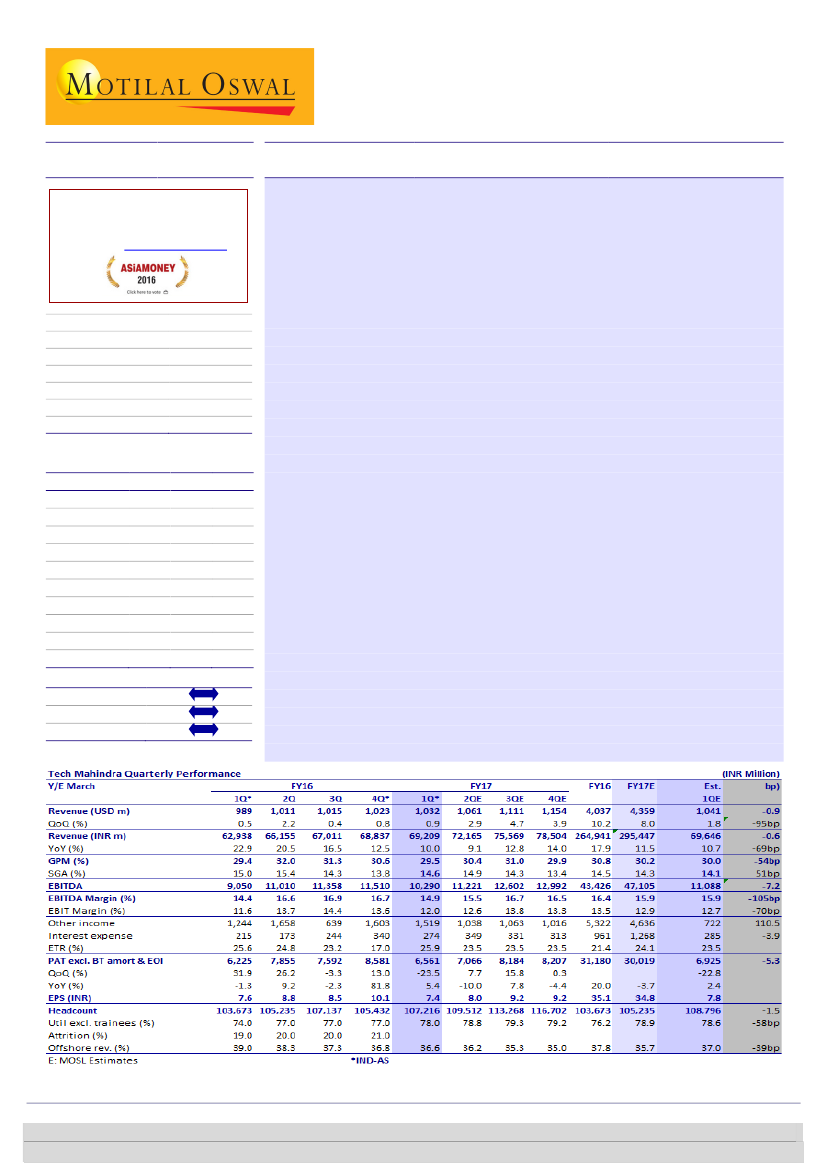
Tech Mahindra
Neutral
BSE SENSEX
28,003
S&P CNX
8,636
CMP: INR490
TP: INR550(+12%)
Motilal Oswal values your support in
the Asiamoney Brokers Poll 2016 for
India Research, Sales and Trading
team. We
request your ballot.
Much-needed reprieve in top clients’ performance
Bloomberg
Equity Shares (m)
M.Cap.(INRb)/(USDb)
52-Week Range (INR)
1, 6, 12 Rel. Per (%)
Avg Val, INRm
Free float (%)
TECHM IN
970.1
475.4 / 7.1
575 / 403
-6/-10/-6
952
63.7
Financials & Valuations (INR b)
2016 2017E
Y/E Mar
264.9 295.4
Net Sales
43.4
47.1
EBITDA
31.2
30.0
NP
35.1
33.8
EPS (INR)
19.7
-3.6
EPS Gr. (%)
165.6 193.8
BV/Sh. (INR)
23.4
19.8
RoE (%)
20.1
17.3
RoCE (%)
14.0
14.5
Payout (%)
3.0
2.5
Div. Yield
2018E
339.5
55.9
36.7
41.3
22.1
219.9
17.6
18.0
11.9
2.2
Estimate change
TP change
Rating change
Top clients’ performance turning the corner:
Tech Mahindra’s (TECHM)
1QFY17 CC revenue growth of 0.4% QoQ was marginally below our estimate of
+1.2% (and reported USD revenue grew to USD1,031.5m, up 0.8% QoQ v/s our
estimate of +1.8%). Revenues from its top 5 accounts turned the corner,
growing 4.1% QoQ compared to last six quarters’ sequential growth between -
12% and +0.5%. TECHM cited expectations of continued traction in the top
client bucket, a key positive.
Profitability disappoints:
EBITDA margin declined 180bp QoQ to 14.9%, higher
than our estimate of a 100bp fall QoQ, led by more pronounced seasonality in
Comviva than anticipated. Compared to the earlier target of margin expansion
YoY, TECHM now expects to maintain margins at FY16 levels (~16% EBITDA).
Higher other income (INR2.5b v/s estimate of INR0.7b) led to PAT of INR7.5b
(down 12.6% QoQ, up 20.5% YoY) higher than our estimate of INR6.9b.
Telecom could add to Enterprise momentum:
Enterprise business’ strong
execution continued with 4.2% QoQ growth. Comviva seasonality and LCC
dragged Telecom’s performance; however, excluding the same, core business
grew ~3% QoQ. With Comviva seasonality behind and LCC likely to stabilize
after one quarter, we expect sequential growth rates at TECHM to improve
(excluding acquisitions).
Expect some valuation catch-up in near term:
We have cut our EBITDA margin
estimates for FY17E/FY18E by 80bp/40bp to factor in the miss in the current
quarter and the impact from Ind-AS. While 1Q margin of 14.9% should be hurt
by ~50bp in 2Q due to GBP depreciation, discontinued visa costs and
operational efficiencies should aid gradual expansion in EBITDA margin. That
said, TECHM’s valuation of 11.9x FY18E EPS has fallen below peers like WPRO
(13.7x FY18E) and HCLT (12.8x FY18E). This quarter’s performance and
commentary demonstrated the gradual improvement in Telecom which begun
only last quarter. This gains further weight with likewise positive commentary
by peers on the vertical. We expect to see some catch up on valuations by
TECHM v/s peers, driving near-term outperformance. Our target price of
INR550 discounts FY18E earnings by 13x, implying 12% upside.
Neutral.
Investors are advised to refer through important disclosures made at the last page of the Research Report.
Motilal Oswal research is available on www.motilaloswal.com/Institutional-Equities, Bloomberg, Thomson Reuters, Factset and S&P Capital.
Ashish Chopra
(Ashish.Chopra@MotilalOswal.com); +91 22 6129 1530
Sagar Lele
(Sagar.Lele@MotilalOswal.com); +91 22 6129 1531

Tech Mahindra
Revenue growth driven lower by Comviva and LCC
TECHM’s constant currency revenue grew 0.4% QoQ, below our estimate of
1.2% CC QoQ.
Reported revenues were USD1,032m, +0.9% QoQ, which included cross
currency tailwinds of 50bp, compared to our estimate of USD1,041m.
Revenue growth was subdued despite the one-month integration of Pininfarina
(~USD9m); ex-Pininfarina, revenue was flat during the quarter.
Organic revenue was bogged down by continued consolidation in LCC and
seasonal weakness in Comviva.
Exhibit 1: Revenue growth at 0.9% QoQ was below our estimate (0% QoQ organic)
USD Revenues
4.7% 4.7%
3.5% 3.7%
4.7% 4.4%
4.3%
Growth QoQ
6.5%
5.2%
3.7%
2.7%
2.2%
0.5%
0.4%
0.8% 0.9%
0.3%
Source: MOSL, Company
In rupee terms, revenue was INR69.2b, +0.5% QoQ, versus our estimate of
INR69.6b (+1.2% QoQ).
Revenue mix split by location moved slightly towards onsite during this quarter,
with onsite revenue contribution at 63.4% (v/s 63.2% in the previous quarter)
Margins lower because of Comviva and visa expenses
EBITDA margin declined by 180bp QoQ to 14.9%, below our estimate of 15.9%.
Gross margins declined 110bp QoQ to 29.5%, versus our expectation of -50bp
QoQ. SGA increased 80bp QoQ to 14.6%, compared to our estimate of 14.1%.
During the quarter, margins were influenced by the following factors: [1]
Seasonal weakness in Comviva (-170bp), [2] Visa expenses (-100bp), and [3]
Operational efficiency improvement (+90bp).
23.3 23.2
20.5
21.1
21.2
18.3
15.8 15.3 16.3 15.9 16.3 16.3 15.5
SGA (%)
20.2 20.3
16.6 16.9 16.9
EBITDA (%)
Exhibit 2: SGA during the quarter inched up by 80bp
21.9 21.5 21.7
15.0
14.6 14.7 14.1 14.4
15.3
14.9
14.3
15.3
13.7 14.6
15.4
14.4
Source: MOSL, Company
1 August 2016
2

Tech Mahindra
Exhibit 3: Consistent uptick in utilization has acted as a margin lever thus far
IT Utilization
80%
78% 78% 79% 78% 77% 77% 78%
IT Utilziation (excluding trainees)
78%
79% 80% 80% 80%
74% 75%
77% 77% 77% 78%
75% 76%
77% 76%
75% 74% 76%
75% 75% 74%
74%
74%
72% 73%
71%
Source: Company, MOSL
The company incurred forex gains during the quarter of INR479m, versus forex
gain of INR64m in 4Q.
Income from interest and dividend was significantly higher (INR2,458m v/s
INR1,659m in the previous quarter). However, this included an exceptional item
of USD14m (INR939m) which was a gain in the books of Pininfarina resulting out
of renegotiation of interest rate. For direct comparison, we have classified this
USD14m gain as an exceptional item.
Tax rate during the quarter was at 25.9% compared to 14.6% in the previous
quarter. ETR was lower in the previous quarter on account of higher benefits
from SEZ, recognition of deferred tax, accumulated losses in the US operations
of LCC, and R&D tax benefits accumulated during the year.
Led by the operational miss, PAT declined by 23.5% QoQ to INR6.6b, versus our
estimate of 22.8% decline.
Revenue growth of ~2.7% QoQ ex. Pininfarina, LCC and Comviva
During the quarter, the integration of Pininfarina (one-month) contributed to
USD9m in revenue. Excluding this, organic revenue was flat QoQ.
During the quarter, Communication vertical revenue was down 2.5% QoQ – led
by consolidation in LCC and seasonal weakness in Comviva. Excluding these
factors, the Communication vertical grew by ~3% QoQ. This marks the second
consecutive quarter of growth in the core communication business (2% QoQ in
4QFY16).
Enterprise segment grew by 4.2% QoQ. However, excluding Pininfarina, growth
was 2.4% QoQ.
Hence, growth in overall revenue (ex. Pininfarina, LCC and Comviva) was ~2.7%
QoQ.
Growth during the quarter was strong in the verticals of BFSI (+7.5% QoQ) and
Retail/Transport/Logistics (+5.8% QoQ).
Manufacturing (ex. Pininfarina) grew by 1.9% QoQ, led lower by the segments of
Energy & Utilities, and Aerospace.
1 August 2016
3

Tech Mahindra
Exhibit 4: Strength seen in the verticals of BFSI and Retail
Verticals
Communication
Manufacturing
Tech | Media | Entertainment
BFSI
Retail | Transport | Logistics
Others
Total
Contr to
Rev. (%)
49.2
18.1
7.5
11.3
6.5
7.3
100.0
Growth -
QoQ (%)
-2.4
7.0
0.9
7.5
5.8
-4.4
0.9
Contr to
incr. rev (%)
-144.8
140.9
7.7
93.9
41.9
-39.6
100.0
4Qtr
CQGR (%)
-0.6
2.6
1.7
4.2
1.3
4.2
1.0
Source: Company, MOSL
Among geographies, Americas drove majority of the incremental growth: +5.6%
QoQ; while Europe was flat during the quarter. The 7% QoQ decline in ROW is a
function of decline in Comviva, excluding which momentum has been picking
up.
Exhibit 5: Revenue growth driven by Americas
Geographies
Americas
Europe
ROW
Total
Contr to
Rev. (%)
49.0
28.3
22.8
100.0
Growth -
QoQ (%)
5.6
0.1
-7.0
0.9
Contr to
Incr. rev (%)
286.2
2.9
-189.1
100.0
4Qtr
CQGR (%)
1.7
0.1
0.9
1.1
Source: Company, MOSL
Top clients have shown volatility in growth over the quarters. However, the
growth seen in top 5 accounts in the quarter is encouraging. The 4.1% QoQ
growth in Top-5 clients is the highest seen in the last six quarters.
Exhibit 6: Top 5 clients showed the highest growth in 6 quarters
Client concentration (QoQ)
Top 5 clients
Top 6-10 clients
Top 11-20 clients
Contr to
Rev. (%)
28.8
11.2
12.6
Growth - QoQ Contr to Incr.
(%)
rev (%)
4.1
1.8
-1.5
126.4
21.7
-20.9
4Qtr
CQGR (%)
-2.3
1.5
0.3
Source: Company, MOSL
Takeaways from management commentary
Wait-and-watch on Brexit:
Brexit is likely to cause temporary instability and
uncertainty, however it is too early to call out any immediate business
implications. Currency depreciation is however likely to result in a negative
impact on USD revenue growth and ~50bp negative impact on EBITDA margin.
Revenue growth momentum picking up in Telecom:
Revenue in the Telecom
vertical declined by 2.5% QoQ. However, this was attributed to the decline in
Comviva and continued consolidation in LCC. Excluding these two, revenue
growth in Telecom was ~3% QoQ. The company expects continued traction in
the core communication business.
Enterprise growth on track:
Enterprise delivered 4.1% QoQ growth (~2.4% QoQ
excluding Pininfarina), which was largely driven by the verticals of BFSI, Retail
and Healthcare. Growth however was driven down by pressure in the verticals
of Energy and Aerospace.
4
1 August 2016

Tech Mahindra
Progress on inorganic growth:
TECHM completed the acquisition of
Pininfarina
and is now able to offer end-to-end services in the Engineering Services space.
The acquisition of
BIO
came to closure and the financials will be consolidated in
2QFY17. The acquisition of
Target
is expected to close in the next few weeks as
some procedures are yet to be completed. Accordingly, this could be integrated
2Q/3Q onwards.
Deal pipeline looks promising:
TECHM won deals with a TCV of USD300m in
1QFY17. The pipeline has grown by 20% QoQ and includes multiple mid-large
deals. The maximum growth in pipeline has resulted out of the Americas. APAC
too has been showing increasing traction.
Aspire to maintain margins at FY16 levels:
1QFY17 margins were lower because
of Comviva seasonality and H1B visa expenses. Margins are expected to improve
in 2Q as the sequential decline in Comviva will seize and H1B expenses won’t be
present. However, 2Q margins are expected to see an impact of 50bp because
of the depreciation of GBP against USD.
Change in estimates
We have cut our revenue estimates by 1.7% in FY17 and FY18 each to factor in
[1] Revenue miss during the quarter, and [2] ~100bp negative impact of
USD/GBP depreciation on USD revenue growth.
Our FY17 USD revenue growth estimate of 8% now breaks into 5% organic
revenue growth, 2% from the acquisition of Pininfarina, and 1% from the
acquisition of Target and BIO. For FY18, we estimate USD revenue growth of
11.3% YoY.
Similarly on margins, we have revised downward our estimates by 80/40bp for
FY17/18E given the miss during the quarter and the 50bp impact expected
because of USD/GBP depreciation.
We now expect EBITDA margin of 15.9/16.5% for FY17/18E. Although the
company aspires
Consequently, our EPS estimates have been cut by 4.3/3.2% for FY17/18E.
Exhibit 7: Change in estimates
Revised
FY17E
FY18E
INR/USD
USD Revenue - m
USD rev Gr.(%)
EBIDTA Margin (%)
EBIT Margin (%)
EPS - INR
67.8
4,359
8.0
15.9
12.9
34.9
70.0
4,851
11.3
16.5
13.4
41.3
Earlier
FY17E
FY18E
67.7
4,434
9.8
16.8
13.6
36.4
70.0
4,936
11.3
16.9
13.7
42.7
Change
FY17E
FY18E
0.1%
-1.7%
-187bp
-81bp
-64bp
-4.3%
0.0%
-1.7%
-4bp
-44bp
-36bp
-3.2%
Source: Company, MOSL
Valuation view:
Marginal uptick in Telecom, but not enough
Excluding the seasonal Comviva business and the restructuring networks
acquisition of LCC, this was the second quarter of sequential uptick in Telecom
business. What was incrementally better this quarter was the growth from top-5
accounts, at 4.2% QoQ – much needed reprieve after 6 tough quarters. Outlook
on Telecom is incrementally better, with closure of 1 large deal last quarter and
the funnel looking healthy.
5
1 August 2016

Tech Mahindra
While Telecom recovery may be gradual, there are some structural strengths in
TECHM’s business to drive much improved growth over the medium-to-long
term:
1. Success in large deal wins and above-industry growth in the Enterprise
segment is an encouraging indicator of improving competitive prowess.
2. Network management services have potentially expanded the addressable
market for TECHM, with directly addressable spend standing at ~USD40b.
That may not start playing out until TECHM brings the LCC house in order
(revenue has been pruned down to ~USD300-310m annualized in run rate
USD430m during acquisition 1 year ago).
3. TECHM also has a sizeable scale in Engineering services, and the opportunity
in the same can be leveraged, especially after the acquisition of Mahindra
Engineering Services (MES)
Profitability took a hit after seeing gradual recovery ensued post 4QFY15.
Improvement of operational parameters, cost optimization methods,
automation and industrialization, pyramid rationalization, offshoring and
integration of acquisitions leaves more room for improvement in the medium
term. However, with multiple acquisitions integrated at lower margins, we
believe TECHM will do well to sustain EBITDA margin in the 16-17% band. Any
further uptick would be a function of stronger revival in Telecom growth.
We expect TECHM to grow its USD revenue at a CAGR of 9.6% over FY16-18 and
EPS at a CAGR of 8.5% during this period. TECHM’s valuation of 11.9x FY18E EPS
has fallen below peers like WPRO (13.7x FY18E) and HCLT (12.8x FY18E). This
quarter’s performance and commentary demonstrated the gradual
improvement in Telecom vertical that begun only last quarter. This gains further
weight with likewise positive commentary by peers too on the segment. We
expect that to facilitate some catch up on valuations by TECHM to peers, driving
near-term outperformance. Our target price of INR550 discounts FY18E earnings
by 13x, implying 12% upside.
Neutral.
Key Triggers
Large deal announcements in enterprise segment
Recovery in Telecom growth
Sustained margin improvement on account of measures taken
Key Risks
Deterioration in cash conversion
Currency fluctuations given higher sensitivity to earnings v/s peers
Slowdown in Enterprise dragged by Oil & Gas / BFSI / Aerospace & Defense
1 August 2016
6

Tech Mahindra
Exhibit 8: TECHM 1-year forward PE chart
100
80
60
40
20
0
16.3
3.8
13.2
PE (x)
Peak(x)
Avg(x)
78.8
Min(x)
Exhibit 9: TECHM 1-year forward PB chart
20.0
15.0
10.0
5.0
0.0
1.2
4.1
2.5
PB (x)
Peak(x)
Avg(x)
17.6
Min(x)
Source: Company, MOSL
Exhibit 10: Comparative Valuation
Company
TCS
Infosys
Wipro
HCL Tech
TechM
Cognizant
Mkt cap
(USD b)
78.7
36.6
20.3
16.3
7.1
35.4
Rating
TP (INR)
Upside
(%)
-2.1
21.7
2.2
15.4
12.2
EPS (INR)
FY17E FY18E
134.0
153.1
62.8
73.2
34.9
40.6
54.9
60.9
33.8
41.3
2.9
3.2
P/E (x)
FY17E FY18E
20.2
17.7
17.3
14.8
16.0
13.7
14.2
12.8
14.5
11.9
19.9
18.0
RoE (%)
FY16-18E CAGR (%)
FY17E FY18E
USD rev.
EPS
33.6
32.7
10.8
11.5
23.2
24.1
11.2
11.3
17.9
18.9
7.3
6.0
25.7
24.6
11.7
6.7
19.8
17.6
9.6
8.5
17.6
16.5
11.8
10.1
Source: MOSL, Company
Neutral 2,650
Buy
1,320
Neutral
570
Buy
900
Neutral
550
Not Rated
1 August 2016
7

Tech Mahindra
Story in charts
Exhibit 11: Telecom prowess reflected in vertical mix
Retail,
Travel,
Logistics,
6.2
BFSI, 10.6
Tech,
Media, Ent,
7.5
Manufactur
ing, 17.1
Source: Company, MOSL
Telecom,
50.9
5.4 (0.9) 8.9
985
8.8
17.7 18.2 10.2
8.0
11.3
Vertical mix (%)
Others, 7.7
Exhibit 12: Scale and diversity lent by Satyam acquisition
Revenue (USD m)
127.7
YoY Growth (%)
977 1063 1156 2633 3098 3664 4037 4359 4851
FY09 FY10 FY11 FY12 FY13 FY14 FY15 FY16 FY17E FY18E
Source: Company, MOSL
Exhibit 13: Deal wins in line with previous quarters
Deal TCV (USD m)
500
400
190
220
270 250 270
220
300 275 300 300
125
Exhibit 14: BFSI showing increased momentum
BFSI
9.9
5.8
-3.6
Growth (QoQ %)
10.4
6.4 5.7
-0.9
3.8
-1.1
-1.9
2.5
9.0
7.5
Source: Company, MOSL
Exhibit 15: Margin recovery has begun after a sharp fall
EBITDA margin (%)
23.3 23.2
21.1
21.2
18.3
15.3 15.0
20.2 20.3
16.6 16.9 16.9
14.9
Exhibit 16: Significantly aided by utilization
IT Utilization
78% 77% 77% 78%
76% 75% 75%
IT Utilziation (excluding trainees)
78%
79% 80% 80% 80%
74% 75%
74%
77% 77% 77% 78%
75% 76%
72% 73%
74%
74%
71%
Source: Company, MOSL
1 August 2016
8

Tech Mahindra
Exhibit 17: Operating metrics
Operating metrics
Revenue by geography (%)
Americas
Europe
Rest of World
Vertical Split (%)
Telecom
Manufacturing
Tech | Media | Entertainment
BFSI
Retail | Transport | Logistics
Others
Onsite-offshore mix (%)
Onsite
Offshore
Client metrics
No. of active clients
% of repeat business
No. of Million $ clients
USD1m+
USD5m+
USD10m+
USD20m+
USD50m+
Client concentration (%)
Top client
Top 5 Clients
Top 6-10
Top 11-20
Headcount (end of period)
Software professionals
BPO
Sales and Support
Total
IT Attrition (LTM) (%)
IT Utilization (%)
IT Utilziation (excluding trainees) (%)
Receivable Days (DSO)-Including Unbilled
Borrowings (USD m)
Cash and Cash Equivalent (USD m)
Capital Expenditure (USD m)
4QFY14 1QFY15 2QFY15 3QFY15 4QFY15 1QFY16 2QFY16 3QFY16 4QFY16 1QFY17
44.9
30.6
24.4
46.8
31.1
22.1
49.1
31.2
19.8
48.8
31.4
19.8
45.4
29.8
24.8
47.7
29.4
22.9
48.9
29.3
21.9
47.8
28.9
23.2
46.8
28.5
24.7
49.0
28.28
22.78
50.8
18.5
8.6
10.1
6.4
5.6
50.7
17.8
8.9
10.3
6.3
6
52
17.7
8.3
9.7
6.2
6.1
50.9
19.7
7.3
9.8
6.4
5.9
55.3
16.5
7
9.1
6.2
5.9
52.7
17.1
7.3
10
6. 5
6.5
52.9
16.7
8.2
9.6
6.0
6.6
51.3
17.1
7.4
9.8
6.8
7.6
50.9
17.1
7.5
10.6
6.2
7.7
49.24
18.14
7.5
11.3
6.5
7.3
52.7
47.3
53.7
46.3
55.2
44.8
55.3
44.7
61.1
38.9
61.0
39.0
61.7
38.3
62.7
37.3
63.2
36.8
63.4
36.6
629
88
632
99
649
97
674
95
767
82
770
99
788
97
801
96
807
96.3
818
96.3
239
75
52
27
11
242
80
51
29
11
245
86
50
30
12
254
88
51
32
13
291
96
56
35
13
296
101
60
36
13
298
102
62
36
14
326
105
63
37
14
319
112
63
40
14
317
120
64
42
14
38
13
12
37
13
12
40
11
12
37
12
12
33
12
12
33
11
13
32
11
13
28
12
12
28
11
13
28.8
11.2
12.6
60,997
21,830
6,614
89,441
15
74
78
96
60.6
600.6
44.6
64,095
21,936
6,698
92,729
16
72
75
102
14.3
609.7
43.6
66,175
22,433
6,701
95,309
18
73
76
102
10.2
556
38.5
67,592 72,952 71,997 71,657 71,892 72,125 73,590
23,566 22,693 24,394 26,513 28,279 27,254 27,326
7,065
6,966
6,851
7,636
7,282
6,053
6,300
98,009 103,281 103,673 105,235 107,137 105,432 107,216
19
74
78
100
10.2
668.4
53.5
19
71
74
104
112
514
30.9
19
74
75
113
125.7
526.3
41.4
20
77
79
108
130.2
532.5
40.0
20
77
80
104
134.3
746.8
19.3
21
77
80
106
164.8
783.3
63.8
21
78
80
106
200
851.2
23.5
Source: Company, MOSL
1 August 2016
9

Tech Mahindra
Exhibit 18: Operating metrics
Operating metrics
Rupee USD Rate
Period closing rate
Period average Rate
Proportion of Revenues From Major Currencies
USD
GBP
EURO
AUD
Others
Consolidated Hedge Position
GBP In Mn
Strike rate (INR)
USD In Mn
Strike rate (INR)
Verticals (QoQ)
Telecom
Manufacturing
Tech | Media | Entertainment
BFSI
Retail | Transport | Logistics
Others
Total
Revenue by geography (QoQ)
Americas
Europe
Rest of World
Total
Client concentration (QoQ)
Top 5
Top 6-10
Top 11-20
Net additions
Software professionals
BPO
Sales and Support
Total
4QFY14 1QFY15 2QFY15 3QFY15 4QFY15 1QFY16 2QFY16 3QFY16 4QFY16 1QFY17
59.92
61.46
60.18
59.87
61.5
60.94
63.04
62.15
62.5
62.07
63.64
63.63
65.58
65.40
66.15
66.03
66.26
67.49
67.52
67.04
48.6
16.4
9.9
7.7
17.4
49.8
16.2
10.2
6.7
17.1
51.5
16.1
10.3
6.4
15.6
51.1
14.9
11.9
5.8
16.4
51.1
12.9
12.6
4.6
18.9
51.1
13.2
11.7
5
18.9
52.4
12.7
11.8
4.5
18.5
51.3
11.4
11.3
4.7
21.3
49.3
10.8
11.3
4.5
24.1
50.0
10.4
11.2
4.7
23.7
170.5 144.3 123.3
108 187.3
185 166.8 173.3 177.9 185.5
95.3
97.1
99.9 103.7 102.1
103 105.8 106.9 108.4 107.1
783.9 1046.8 1224.2 1582.5 1370.2 1459.3 1504.5 1341.7 1297.2 1246.6
68.5
69.5
60.6
61.6
63
65.2
66
66.6
71.1
71.5
8.6
1.6
-1.4
6.4
-3.3
-7.3
4.3
3.5
-0.3
7.3
5.7
2.0
11.1
3.7
7.9
4.6
-1.9
-0.9
3.6
7.0
5.2
0.5
14.3
-9.7
3.8
6.0
-0.7
2.7
15.7
-10.8
2.1
-1.1
3.1
6.5
6.5
-4.2
4.2
4.8
10.4
4.6
9.9
0.5
2.6
-0.2
14.8
-1.9
-4.9
4.6
2.2
-2.7
2.8
-9.4
2.5
13.7
15.6
0.4
0.0
0.8
2.1
9.0
-8.1
2.1
0.8
-2.4
7.0
0.9
7.5
5.8
-4.4
0.9
-0.6
3.3
15.7
4.2
8.0
5.4
-6.1
3.8
10.4
5.6
-5.7
5.3
2.1
3.4
2.7
2.6
-0.9
1.0
33.4
6.5
5.6
-0.8
-7.2
0.5
4.8
1.9
-2.2
2.3
-1.9
-1.0
6.3
0.2
-1.3
-0.6
7.3
0.9
5.6
0.1
-7.0
0.9
7.1
13.0
4.3
0.9
3.7
3.7
13.8
-11.0
5.2
-5.0
12.0
2.7
-5.0
6.5
6.5
0.5
-7.9
8.9
-0.9
2.2
2.2
-12.2
9.5
-7.4
0.4
-6.8
8.3
4.1
1.8
-1.5
3,396
-1,383
29
2,042
4,339
106
-1,157
3,288
2,029
497
54
2,580
1,377
1,133
190
2,700
5,306
-873
839
5,272
-1,002
1,701
-307
392
-401
2,119
-156
1,562
183
1,766
-47
1,902
-703
-1,025
23
-1,705
1,465
72
247
1,784
Source: Company, MOSL
1 August 2016
10

Tech Mahindra
Financials and Valuations
Key assumption
Exhibit 19: Operating metrics
INR/USD Rate
Operating metrics
Revenues (USD m)
Rupee USD Rate
Total Headcount
Period closing rate
Net Addition
Period average Rate
Per Capita Productivity (USD)
Utilization incl. Trainees (%)
Proportion of Revenues From Major Currencies
IT Services (%)
USD
GBP
Income Statement
Y/E Mar
2011
EURO
Net Sales
48,413
AUD
Change (%)
4.7
Others
EBITDA
9,895
EBITDA Margin (%)
20.4
Consolidated Hedge Position
Depreciation
1,435
GBP In Mn
EBIT
rate (INR)
8,460
Strike
USD In Mn
Interest
Strike rate (INR)
Other Income
Extraordinary items
Verticals (QoQ)
PBT
Telecom
Tax
Manufacturing
Tax Rate (%)
Tech | Media | Entertainment
Min. Int. & Assoc. Share
BFSI
Reported PAT
Retail | Transport | Logistics
Adjusted PAT
Others
Change (%)
Total
2011
45.5
2,194
2012
2013
2014
2015
2016
2017E
2018E
47.5
54.4
60.8
61.4
65.6
67.8
70.0
3QFY14 4QFY14 1QFY15 2QFY15 3QFY15 4QFY15 1QFY16 2QFY16 3QFY16 4QFY16
2,463
2,633
3,098
3,664
4,037
4,359
4,851
74,116
83,109
89,441
103,281
105,432
116,702
126,541
61.81 59.92
60.18
61.5 63.04
62.5 63.64 65.58 66.15 66.26
8,993
6,332
13,840
2,151
11,270
9,839
61.92 61.46
59.87 60.94 62.15 62.07 63.63 65.40 66.03 67.49
31,678
34,638
35,471
38,294
37,348
38,332
73.1
73.1
69.9
74.0
76.8
76.8
90.5
90.3
91.7
92.6
93.0
92.9
52.4
51.3
48.8
48.6
49.8
51.5
51.1
51.1
51.1
49.3
12.7
11.4
Million)
(INR
10.8
17.5
16.4
16.2
16.1
14.9
12.9
13.2
2012
9.9
2013
2014
11.9
2015
2016
2017E
11.8
11.3
2018E
9.2
10.2
10.3
12.6
11.7
11.3
54,897
7.7
143,320
224,779
4.6
264,941
295,447
4.7
339,541
4.5
7.1
6.7
188,313
6.4
5.8
5
4.5
13.4 17.4 161.1
31.4 16.4 19.4
17.9
11.5
14.9
18.5
21.3
17.4
17.1
15.6
18.9
18.9
24.1
9,194
30,631
41,836
41,536
43,426
47,105
55,894
16.7
21.4
22.2
18.5
16.4
15.9
16.5
1,614
3,896
5,221
6,079
7,620 166.88,921
173.3 10,515
211 170.5
144.3 123.3
108 187.3
185
177.9
7,580
26,735
36,615
35,457
35,806
105.8 106.9
45,379
38,184
94.2
95.3
97.1
99.9 103.7 102.1
103
108.4
771 783.9 1046.8 1224.2 1582.5 1370.2 1459.3 1504.5 1341.7 1297.2
1,413
922
673
689
961
1,268
1,070
68.5
69.5
59.5
60.6
61.6
63
65.2
66
66.6
71.1
1,368
2,121
1,129
1,006
5,322
4,636
4,560
-1,618
-2,940
-1,117
0
0
0
0
5,917
24,994
35,954
35,774
40,167
41,552
48,868
2.6
-2.7
5.4
8.6
3.5
7.9
0.5
15.7
-4.2
0.0
1,438
6,479
9,790
9,472
8,600
9,996
11,484
-0.2
2.8
6.6
1.6
-0.3
4.6
14.3
-10.8
4.2
0.8
24.3
25.9
27.2
26.5
21.4
24.1
23.5
14.8
-9.4
-9.6
7.3
-1.9
4.8
2.1
714 -1.4 301
336 -9.7 3102.1
412
1,514
700
-1.9
2.5
36,684
9.9
5.7
-0.9
3.8
-1.1
31,155
10.4
9.0
9,299
6.4
18,214
25,828
25,992
30,042
-4.9
13.7
36,684
1.4
2.0
3.6
6.0
4.6
-8.1
10,918
-3.3
19,554
26,945
25,992
3.1
31,155
30,042
4.6 -3.6
15.6
7.8
11.1
7.0
9.9
2.1
24.2 -7.3 79.1
37.8 -0.7 -3.56.5
19.9
22.1
2.2
0.4
4.4
4.3
3.7
5.2
2.7
6.5
0.5
0.8
999
1,174
-1,695
6,940
1,315
18.9
653
7,092
8,787
6.3
2011
1,260
32,254
33,514
12,227
5,199
51,099
6,170
0
6,170
1,105
29,080
23,455
0
12,468
2,666
8,321
8,711
5,631
3,080
14,744
51,099
Balance Sheet
(INR Million)
2018E
Y/E Mar
Revenue by geography (QoQ)
Share Capital
Americas
Reserves
Europe
Net Worth
Rest of World
Debt
Total
Deferred Tax
Total Capital Employed
Client concentration (QoQ)
Gross Fixed Assets
Top 5
Less: Acc Depreciation
Top 6-10
Net Fixed Assets
Top 11-20
Capital WIP
Investments
Net additions
Current Assets
Software professionals
Inventory
BPO
Debtors
Sales and Support
Cash & Bank
Total
& Adv, Others
Loans
Curr Liabs & Provns
Curr. Liabilities
Provisions
Net Current Assets
Total Assets
2012
2013
2014
2015
2016
2017E
1,275
2,316
11.2
-0.6
8.0
42,032
66,214
-2.3
3.3
5.4
43,307
68,530
0.7
15.7
-6.1
11,266
14,702
4.4
4.2
3.8
-998
-3,477
53,575
93,408
6,868
22,318
7.3
7.1
0.9
0
0
4.4
3.7
6,868
13.0
22,318
-3.7
3.7
1,629 4.3 2,595
35,876
14,174
20,437
95,541
2,169 0 3,396
4,339
0
-12
106
13,172 -1,38333,688
8
2934,629
-1,157
2,418
2,165 2,04227,224
3,288
4,847
11,235
41,220
10,377
8,577
858
32,643
9,202
54,321
53,575
93,408
2,335
4,804
10.4
2.1
-0.9
89,469
117,682
5.6
3.4
1.0
91,804
122,486
-5.7
2.7
33.4
8,420
11,287
5.3
2.6
6.5
-3,830
-3,901
110,151
143,780
28,606
40,329
13.8
-5.0
-5.0
0
0
-11.0
28,606
12.0
40,329
6.5
5.2 0
2.7 5,6776.5
14,718
21,028
112,241
127,545
2,029 0 1,377 5,306
0
497
-873
43,486 1,133
52,059
54
190
839
33,202
24,049
2,580 2,700 5,272
35,554
51,438
45,415
50,800
14,722
20,587
30,693
30,213
66,827
76,745
110,151
143,779
4,839
4,373
4.84,373-1.9
5.6
-1.3
138,824
164,846
187,617
1.9
-1.0
-0.8
-0.6
143,663
169,219
191,990
-2.2
6.3
-7.2
7.3
15,564
16,594
13,359
2.3
0.2
0.5
0.9
-5,575
-5,822
-5,822
167,990
196,691
216,227
43,446
56,137
59,238
-0.9
-12.2
0.5
0.4
0
0
0
2.2
9.5
-7.9
-6.8
43,446
56,137
59,238
2.26,724-7.4
8.9
8.3
6,294
6,724
24,934
13,599
17,099
154,821
186,181
213,055
-1,0020 -401
-703
0 183
0
1,701
57,705 2,119 1,766 -1,025
65,809
73,365
-307
23
40,138 -156
59,172 -47 75,554
392
56,978 1,562 1,902 -1,705
61,200
64,136
61,505
Source: Company,
79,888
65,951
MOSL
22,755
27,120
30,635
38,750
38,831
49,253
93,316
120,230
133,167
167,990
196,691
216,227
1 August 2016
11

Tech Mahindra
Financials and Valuations
Ratios
Y/E Mar
Basic (INR)
EPS
Cash EPS
Book Value
DPS
Payout (incl. Div. Tax.)
Valuation(x)
P/E
Cash P/E
Price / Book Value
EV/Sales
EV/EBITDA
Dividend Yield (%)
Profitability Ratios (%)
RoE
RoCE
RoIC
Turnover Ratios (%)
Fixed Asset Turnover (x)
Debtors (No. of Days)
Leverage Ratios (%)
Net Debt/Equity (x)
Y/E Mar
Adjusted EBITDA
Non cash opr. exp (inc)
(Inc)/Dec in Wkg. Cap.
Tax Paid
Other operating activities
CF from Op. Activity
(Inc)/Dec in FA & CWIP
Free cash flows
(Pur)/Sale of Invt
Others
CF from Inv. Activity
Inc/(Dec) in Net Worth
Inc / (Dec) in Debt
Interest Paid
Divd Paid (incl Tax) & Others
CF from Fin. Activity
Inc/(Dec) in Cash
Add: Opening Balance
Closing Balance
2011
13.6
16.3
66.5
1.0
7.4
0.0
0.0
0.0
0.0
0.0
0.0
25.7
17.7
60.7
4.0
86
2012
17.6
20.7
84.9
1.0
5.7
27.8
23.7
5.8
4.6
27.5
0.2
26.0
13.6
36.6
3.9
85
2013
22.0
28.2
81.4
5.0
23.1
22.7
17.4
5.8
2.6
12.0
1.0
32.6
28.7
65.1
5.8
60
2014
30.7
36.9
112.3
5.0
16.3
16.0
13.3
4.4
1.9
8.7
1.0
36.4
26.3
46.5
7.0
75
2015
29.3
36.1
142.2
6.0
20.5
16.7
13.6
3.4
1.8
9.5
1.2
24.5
20.5
30.0
6.0
78
2016
35.1
43.7
165.6
12.0
34.2
14.0
11.2
3.0
1.5
8.9
2.4
23.4
20.1
25.7
5.5
76
2017E
33.8
43.8
193.8
8.8
25.9
14.5
11.2
2.5
1.3
8.1
1.8
19.8
17.3
23.3
5.2
76
2018E
41.3
53.1
219.9
8.8
21.2
11.9
9.2
2.2
1.1
6.4
1.8
17.6
18.0
25.8
5.3
75
0.3
2011
9,895
5,822
-11,261
0
0
4,455
541
4,996
1,065
0
1,606
-3,548
-1,445
0
-590
-5,582
479
2,187
2,666
0.2
2012
9,194
-5,502
7,778
0
0
11,470
-2,836
8,634
-6,796
0
-9,632
-528
-961
0
-597
-2,086
-248
2,666
2,418
-0.3
2013
30,631
-16,372
-7,608
0
37,353
44,004
-3,099
40,905
-1,940
0
-5,039
1,032
-7,036
0
-750
-6,754
32,211
2,418
34,629
-0.3
2014
41,836
-7,901
-12,302
0
0
21,634
-7,854
13,780
-8,539
0
-16,393
19
-1,305
0
-5,381
-6,668
-1,427
34,629
33,202
-0.1
2015
41,536
-9,496
-8,874
0
0
23,167
-21,365
1,802
-9,050
0
-30,415
2,469
2,396
0
-6,771
-1,905
-9,154
33,202
24,048
-0.2
2016
43,426
-8,987
5,456
0
0
39,895
-17,357
22,538
10,611
0
-6,746
35
-3,469
0
-13,626
-17,060
16,089
24,048
40,138
-0.2
2017E
47,105
-10,595
-8,895
0
0
27,615
-9,786
17,829
15,061
0
5,275
-466
-4,387
0
-9,003
-13,855
19,034
40,138
59,172
-0.3
2018E
55,894
-17,094
302
0
0
39,102
-9,910
29,192
-2,830
0
-12,740
0
-978
0
-9,003
-9,981
16,381
59,172
75,553
Cash Flow Statement
(INR Million)
1 August 2016
12

Tech Mahindra
Corporate profile
Company description
Tech Mahindra represents the connected world, offering
innovative and customer-centric information technology
services and solutions, enabling Enterprises, Associates
and the Society to Rise™. It is a USD3.5b company with
~98,000+ professionals across 51 countries, helping over
674 global customers including Fortune 500 companies. It
is a part of the USD 16.7 billion Mahindra Group that
employs more than 180,000 people in over 100 countries.
Source: MOSL/Bloomberg
Exhibit 1: Sensex rebased
Exhibit 2: Shareholding pattern (%)
Promoter
DII
FII
Others
Jun-16
36.3
11.0
39.4
13.3
Mar-16
36.5
11.3
37.9
14.3
Jun-15
36.7
11.1
37.0
15.2
Exhibit 3: Top holders
Holder Name
Europacific Growth Fund
Natl.Westmin.Bank Plc As Depos.Of 1st
Sta.Asia Pac.Lead.Fund A Sub Fund Of 1st
Sta.Invsts.Icvc
Life Insurance Corporation Of India & Life
Insurance Corporation Of India P & Gs Fund
New World Fund Inc
Government Pension Fund Global
% Holding
6.4
3.8
3.6
1.8
1.2
Source: Capitaline
Note: FII Includes depository receipts
Source: Capitaline
Exhibit 4: Top management
Name
Anand G Mahindra
Vineet Nayyar
C P Gurnani
G Jayaraman
Designation
Chairman
Vice Chairman
Managing Director & CEO
Company Secretary
Exhibit 5: Directors
Name
Anupam Puri
M Damodaran
Ravindra Kulkarni
Ulhas N Yargop
Name
Bharat N Doshi
M Rajyalakshmi
T N Manoharan
V S Parthasarathy
Source: Capitaline
*Independent
Exhibit 6: Auditors
Name
Deloitte Haskins & Sells LLP
Type
Statutory
Exhibit 7: MOSL forecast v/s consensus
EPS
(INR)
FY17
FY18
MOSL
forecast
33.8
41.3
Consensus
forecast
37.0
42.5
Variation (%)
-8.7
-2.8
Source: Bloomberg
Source: Capitaline
1 August 2016
13

This document has been prepared by Motilal Oswal Securities Limited (hereinafter referred to as Most) to provide information about the company (ies) and/sector(s), if any, covered in the report and may be distributed by it and/or
Tech Mahindra
its affiliated company(ies). This report is for personal information of the selected recipient/s and does not construe to be any investment, legal or taxation advice to you. This research report does not constitute an offer, invitation or
inducement to invest in securities or other investments and Motilal Oswal Securities Limited (hereinafter referred as MOSt) is not soliciting any action based upon it. This report is not for public distribution and has been furnished to
you solely for your general information and should not be reproduced or redistributed to any other person in any form. This report does not constitute a personal recommendation or take into account the particular investment
objectives, financial situations, or needs of individual clients. Before acting on any advice or recommendation in this material, investors should consider whether it is suitable for their particular circumstances and, if necessary, seek
professional advice. The price and value of the investments referred to in this material and the income from them may go down as well as up, and investors may realize losses on any investments. Past performance is not a guide
for future performance, future returns are not guaranteed and a loss of original capital may occur.
MOSt and its affiliates are a full-service, integrated investment banking, investment management, brokerage and financing group. We and our affiliates have investment banking and other business relationships with a some
companies covered by our Research Department. Our research professionals may provide input into our investment banking and other business selection processes. Investors should assume that MOSt and/or its affiliates are
seeking or will seek investment banking or other business from the company or companies that are the subject of this material and that the research professionals who were involved in preparing this material may educate
investors on investments in such business . The research professionals responsible for the preparation of this document may interact with trading desk personnel, sales personnel and other parties for the purpose of gathering,
applying and interpreting information. Our research professionals are paid on twin parameters of performance & profitability of MOSt.
MOSt generally prohibits its analysts, persons reporting to analysts, and members of their households from maintaining a financial interest in the securities or derivatives of any companies that the analysts cover. Additionally,
MOSt generally prohibits its analysts and persons reporting to analysts from serving as an officer, director, or advisory board member of any companies that the analysts cover. Our salespeople, traders, and other professionals or
affiliates may provide oral or written market commentary or trading strategies to our clients that reflect opinions that are contrary to the opinions expressed herein, and our proprietary trading and investing businesses may make
investment decisions that are inconsistent with the recommendations expressed herein. In reviewing these materials, you should be aware that any or all of the foregoing among other things, may give rise to real or potential
conflicts of interest. MOSt and its affiliated company(ies), their directors and employees and their relatives may; (a) from time to time, have a long or short position in, act as principal in, and buy or sell the securities or derivatives
thereof of companies mentioned herein. (b) be engaged in any other transaction involving such securities and earn brokerage or other compensation or act as a market maker in the financial instruments of the company(ies)
discussed herein or act as an advisor or lender/borrower to such company(ies) or may have any other potential conflict of interests with respect to any recommendation and other related information and opinions.; however the
same shall have no bearing whatsoever on the specific recommendations made by the analyst(s), as the recommendations made by the analyst(s) are completely independent of the views of the affiliates of MOSt even though
there might exist an inherent conflict of interest in some of the stocks mentioned in the research report
Reports based on technical and derivative analysis center on studying charts company's price movement, outstanding positions and trading volume, as opposed to focusing on a company's fundamentals and, as such, may not
match with a report on a company's fundamental analysis. In addition MOST has different business segments / Divisions with independent research separated by Chinese walls catering to different set of customers having various
objectives, risk profiles, investment horizon, etc, and therefore may at times have different contrary views on stocks sectors and markets.
Unauthorized disclosure, use, dissemination or copying (either whole or partial) of this information, is prohibited. The person accessing this information specifically agrees to exempt MOSt or any of its affiliates or employees from,
any and all responsibility/liability arising from such misuse and agrees not to hold MOSt or any of its affiliates or employees responsible for any such misuse and further agrees to hold MOSt or any of its affiliates or employees free
and harmless from all losses, costs, damages, expenses that may be suffered by the person accessing this information due to any errors and delays. The information contained herein is based on publicly available data or other
sources believed to be reliable. Any statements contained in this report attributed to a third party represent MOSt’s interpretation of the data, information and/or opinions provided by that third party either publicly or through a
subscription service, and such use and interpretation have not been reviewed by the third party. This Report is not intended to be a complete statement or summary of the securities, markets or developments referred to in the
document. While we would endeavor to update the information herein on reasonable basis, MOSt and/or its affiliates are under no obligation to update the information. Also there may be regulatory, compliance, or other reasons
that may prevent MOSt and/or its affiliates from doing so. MOSt or any of its affiliates or employees shall not be in any way responsible and liable for any loss or damage that may arise to any person from any inadvertent error in
the information contained in this report. MOSt or any of its affiliates or employees do not provide, at any time, any express or implied warranty of any kind, regarding any matter pertaining to this report, including without limitation
the implied warranties of merchantability, fitness for a particular purpose, and non-infringement. The recipients of this report should rely on their own investigations.
This report is intended for distribution to institutional investors. Recipients who are not institutional investors should seek advice of their independent financial advisor prior to taking any investment decision based on this report or
for any necessary explanation of its contents.
Most and it’s associates may have managed or co-managed public offering of securities, may have received compensation for investment banking or merchant banking or brokerage services, may have received any compensation
for products or services other than investment banking or merchant banking or brokerage services from the subject company in the past 12 months.
Most and it’s associates have not received any compensation or other benefits from the subject company or third party in connection with the research report.
Subject Company may have been a client of Most or its associates during twelve months preceding the date of distribution of the research report
MOSt and/or its affiliates and/or employees may have interests/positions, financial or otherwise of over 1 % at the end of the month immediately preceding the date of publication of the research in the securities mentioned in this
report. To enhance transparency, MOSt has incorporated a Disclosure of Interest Statement in this document. This should, however, not be treated as endorsement of the views expressed in the report.
Motilal Oswal Securities Limited is registered as a Research Analyst under SEBI (Research Analyst) Regulations, 2014. SEBI Reg. No. INH000000412
Pending Regulatory inspections against Motilal Oswal Securities Limited:
SEBI pursuant to a complaint from client Shri C.R. Mohanraj alleging unauthorized trading, issued a letter dated 29th April 2014 to MOSL notifying appointment of an Adjudicating Officer as per SEBI regulations to hold inquiry and
adjudge violation of SEBI Regulations; MOSL replied to the Show Cause Notice whereby SEBI granted us an opportunity of Inspection of Documents. Since all the documents requested by us were not covered we have requested
to SEBI vide our letter dated June 23, 2015 to provide pending list of documents for inspection.
List of associate companies of Motilal Oswal Securities Limited -
Click here to access detailed report
Analyst Certification
The views expressed in this research report accurately reflect the personal views of the analyst(s) about the subject securities or issues, and no part of the compensation of the research analyst(s) was, is, or will be directly or
indirectly related to the specific recommendations and views expressed by research analyst(s) in this report. The research analysts, strategists, or research associates principally responsible for preparation of MOSt research
receive compensation based upon various factors, including quality of research, investor client feedback, stock picking, competitive factors and firm revenues
Disclosure of Interest Statement
Analyst ownership of the stock
Served as an officer, director or employee -
TECH MAHINDRA
No
No
Disclosures
A graph of daily closing prices of securities is available at www.nseindia.com and http://economictimes.indiatimes.com/markets/stocks/stock-quotes
Regional Disclosures (outside India)
This report is not directed or intended for distribution to or use by any person or entity resident in a state, country or any jurisdiction, where such distribution, publication, availability or use would be contrary to law, regulation or
which would subject MOSt & its group companies to registration or licensing requirements within such jurisdictions.
For Hong Kong:
This report is distributed in Hong Kong by Motilal Oswal capital Markets (Hong Kong) Private Limited, a licensed corporation (CE AYY-301) licensed and regulated by the Hong Kong Securities and Futures
Commission (SFC) pursuant to the Securities and Futures Ordinance (Chapter 571 of the Laws of Hong Kong) “SFO”. As per SEBI (Research Analyst Regulations) 2014 Motilal Oswal Securities (SEBI Reg No. INH000000412)
has an agreement with Motilal Oswal capital Markets (Hong Kong) Private Limited for distribution of research report in Kong Kong. This report is intended for distribution only to “Professional Investors” as defined in Part I of
Schedule 1 to SFO. Any investment or investment activity to which this document relates is only available to professional investor and will be engaged only with professional investors.” Nothing here is an offer or solicitation of
these securities, products and services in any jurisdiction where their offer or sale is not qualified or exempt from registration. The Indian Analyst(s) who compile this report is/are not located in Hong Kong & are not conducting
Research Analysis in Hong Kong.
For U.S.
Motilal Oswal Securities Limited (MOSL) is not a registered broker - dealer under the U.S. Securities Exchange Act of 1934, as amended (the"1934 act") and under applicable state laws in the United States. In addition MOSL is
not a registered investment adviser under the U.S. Investment Advisers Act of 1940, as amended (the "Advisers Act" and together with the 1934 Act, the "Acts), and under applicable state laws in the United States. Accordingly, in
the absence of specific exemption under the Acts, any brokerage and investment services provided by MOSL, including the products and services described herein are not available to or intended for U.S. persons.
This report is intended for distribution only to "Major Institutional Investors" as defined by Rule 15a-6(b)(4) of the Exchange Act and interpretations thereof by SEC (henceforth referred to as "major institutional investors"). This
document must not be acted on or relied on by persons who are not major institutional investors. Any investment or investment activity to which this document relates is only available to major institutional investors and will be
engaged in only with major institutional investors. In reliance on the exemption from registration provided by Rule 15a-6 of the U.S. Securities Exchange Act of 1934, as amended (the "Exchange Act") and interpretations thereof by
the U.S. Securities and Exchange Commission ("SEC") in order to conduct business with Institutional Investors based in the U.S., MOSL has entered into a chaperoning agreement with a U.S. registered broker-dealer, Motilal
Oswal Securities International Private Limited. ("MOSIPL"). Any business interaction pursuant to this report will have to be executed within the provisions of this chaperoning agreement.
The Research Analysts contributing to the report may not be registered /qualified as research analyst with FINRA. Such research analyst may not be associated persons of the U.S. registered broker-dealer, MOSIPL, and
therefore, may not be subject to NASD rule 2711 and NYSE Rule 472 restrictions on communication with a subject company, public appearances and trading securities held by a research analyst account.
For Singapore
Motilal Oswal Capital Markets Singapore Pte Limited is acting as an exempt financial advisor under section 23(1)(f) of the Financial Advisers Act(FAA) read with regulation 17(1)(d) of the Financial Advisors Regulations and is a
subsidiary of Motilal Oswal Securities Limited in India. This research is distributed in Singapore by Motilal Oswal Capital Markets Singapore Pte Limited and it is only directed in Singapore to accredited investors, as defined in the
Financial Advisers Regulations and the Securities and Futures Act (Chapter 289), as amended from time to time.
In respect of any matter arising from or in connection with the research you could contact the following representatives of Motilal Oswal Capital Markets Singapore Pte Limited:
Varun Kumar
Varun.kumar@motilaloswal.com
Contact : (+65) 68189232
Office Address:21 (Suite 31),16 Collyer Quay,Singapore 04931
Kadambari Balachandran
kadambari.balachandran@motilaloswal.com
(+65) 68189233 / 65249115
1 August 2016
Motilal Oswal Tower, Level 9, Sayani Road, Prabhadevi, Mumbai 400 025
Phone: +91 22 3982 5500 E-mail: reports@motilaloswal.com
Motilal Oswal Securities Ltd
14