1 August 2016
1QFY17 Results Update | Sector: Technology
Tata Elxsi
Buy
BSE SENSEX
28,003
S&P CNX
8,637
CMP: INR1,645
TP: INR1,965 (+19%)
Motilal Oswal values your support in
the Asiamoney Brokers Poll 2016 for
India Research, Sales and Trading
team. We
request your ballot.
In-line results; focused on futuristic business
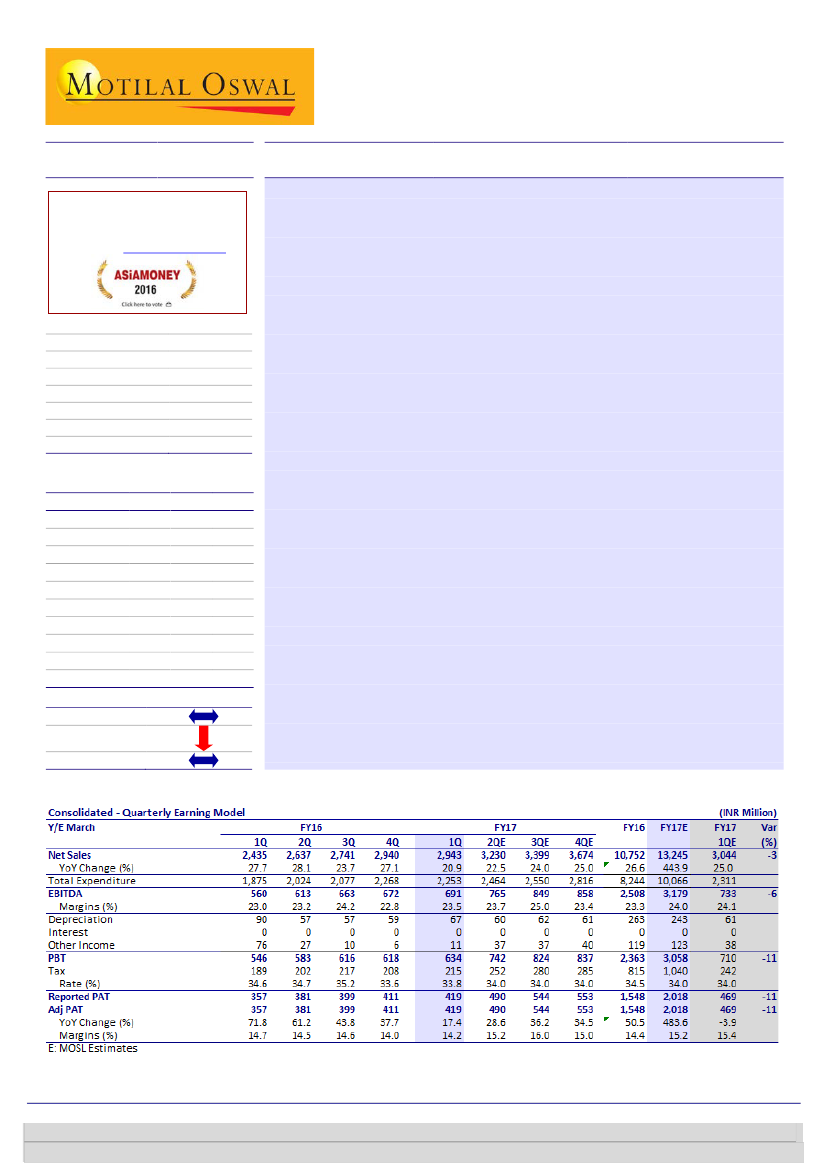
Results in line:
Revenue grew 21% YoY to INR2,943m (est. of INR3,044m), with
Embedded Product Development (EPD) division contributing 80.1% to
revenue, Industrial design and VLC (14.4%) and System integration at 5.5%.
EBITDA grew 23% YoY to INR691m (est. of INR733m) as margins expanded
50bp YoY to 23.5% (est. of 24.1%). PAT grew 17.4% YoY to INR419m (est. of
INR469m).
We met the management of the company in its Investor Meet
2016 where it had also showcased some of its products (details inside).
Focused on futuristic opportunities:
Management highlighted that Over The
Top content (OTT) business is gaining momentum with trend changing
globally. The Broadcasters are incrementally focusing on moving directly to
the customers. TELX key customers in OTT business includes Hotstar, Ditto TV,
Voot, Eros Now, Hungama and Zee living. Additionally, the company believes
that automation in car is on the rise will continue to increase with high
intensity. In this direction the company has taken many initiatives like e-
Cockpit, Driver behavior monitoring and is also working on Driverless Car. The
company intends to refocus on VCL business but will be selective to take
projects where outcome is predictable.
Growth momentum to continue:
Company is confident of continuing the
steady pace of growth. In the automotive segment the company is engaged
with 10OEM’s and 29 suppliers. Within automotive, TELX is focusing on Safety
and Security, Body and Chassis electrical, Powertrain and Hybrids,
Infotainment and Telematics. Employees as at end of 1QFY17 numbered 4,700
and plans to recruit ~1,000 every year (~15% attrition). The management
highlighted that TELX enjoys ~9-12% market share in each business segment.
Valuation and view:
We expect TELX to post 24% revenue CAGR and 28% PAT
CAGR over FY16-18, led by EPD. Given its strong set of capabilities built over
last 25 years in the areas of Technology, Engineering and Design and its
standing as a strong play on IoT, we recommend
Buy
with a price target of
INR1,965—24x FY18E EPS.
Bloomberg
Equity Shares (m)
M.Cap.(INR b)/(USD b)
52-Week Range (INR)
1, 6, 12 Rel. Per (%)
Avg Val, (INR m)
Free float (%)
TELX IN
31.1
51.3/ 0.8
2,396/1,591
-8/-33/-1
1,506
55.4
Financials & Valuations (INR b)
Y/E Mar
2016 2017E 2018E
Sales
10.8
13.2
16.4
EBITDA
2.5
3.2
4.0
PAT
1.5
2.0
2.6
EPS (INR)
49.7
64.8
81.9
EPS Gr. (%)
50.5
30.4
26.3
BV/Sh. (INR)
123.9 162.3 208.2
RoE (%)
46.3
45.3
44.2
RoCE (%)
46.3
45.3
44.2
P/E (x)
33.2
25.5
20.1
P/BV (x)
13.3
10.2
7.9
Estimate change
TP change
Rating change
Niket Shah
(Niket.Shah@MotilalOswal.com); +91 22 39825000
Chintan Modi
(Chintan.Modi@MotilalOswal.com); +91 22 3982 5422
Investors are advised to refer through important disclosures made at the last page of the Research Report.
Motilal Oswal research is available on www.motilaloswal.com/Institutional-Equities, Bloomberg, Thomson Reuters, Factset and S&P Capital.

Tata Elxsi
Key Takeaways from Investor meet 2016
Transportation - Automotive
Within automotive, TELX is focusing on Safety and Security, Body and Chassis
electrical, Powertrain and Hybrids, Infotainment and Telematics.
The company believes that the intensity of automation in cars will continue to
increase at a rapid pace and in that view it is working on multiple projects.
Driver Drives
Car Assists
Car Drives
Driver Assists
Car Drives
Car Assists
Currently, It is engaged with 10OEM’s and 29 suppliers.
Some of the projects that company showcased included ‘e-cockpit’, Driver
behavior monitoring and driverless car.
‘E-cockpit’ concept helps to integrate Instrument cluster and infotainment as a
single software package and it is cost effective solution which runs on single
hardware.
Driver behavior monitoring is product targeted towards fleet operators helps in
coaching and cultivating safe driving skills and reduces the risks related to
collisions, insurance claims, fuel use and vehicle maintenance.
In line with their though process of automation eventually leading to ‘Car drives
and Car Assist’ they have been working on the concept of Driverless car.
Broadcasts and communication
Within this segment, TELX engages with Broadcast service providers for
development of value added applications and help them reduce engineering
costs through cost effective offshore services.
Some of the products include Software solution which detects Audio Video
defects and player errors which has been deployed by TELX for leading operator
and studios. It facilitates easy identification and resolution of issues in content
distribution, enhanced reporting with error snapshots and automated email
alerts with defect details.
Panacea – Artificial intelligence based issue resolution which has in-built
machine learning capabilities and failure prediction mechanisms accompanied
by user friendly mobile app. The same has been deployed for a European
operator.
Another attractive area with immense opportunity is OTT (Over The Top
content). Management highlighted Over The Top content (OTT) business is
gaining momentum with trend changing globally. The Broadcasters are
incrementally focusing on moving directly to the customers. TELX OTT services
help customers launch multi-platform OTT services, supported by tools for
content analysis, content discovery, ad integration and 24/7 monitoring
support. TELX key customers in OTT business includes Hotstar, Ditto TV, Voot,
Eros Now, Hungama and Zee living.
1 August 2016
2

Tata Elxsi
In the communications business, TELX is working with 7 of the top 10
communication OEM and operators.
Healthcare and Medical Equipment
The company participates in three main verticals within the Medical Equipment
segment namely, Therapeutic, Diagnostic and Patient Monitoring.
Some of the products showcased include ‘Drip Monitoring’ and ‘Mobile
Negative Pressure Wound Therapy Device’.
Also, the company sees huge opportunity in IoT based healthcare services.
TELX’s IoT platform TETHER seamlessly integrates all devices with mobile apps
and web based systems; enabling asset tracking, monitoring and control, field
service operation and automation across multiple industries and market
segments.
Other Highlights
Employees as at end of 1QFY17 numbered 4700 and plan to recruit 1000
employees every year (~15% attrition).
The management highlighted that TELX enjoys ~9-12% market share in each
business segment.
Currently, the contract size is of 9-12m and 90% of customers are repeat
customers. 85% of the total revenue is exports.
Results in-line
Revenue grew 21% YoY to INR2,943m (est. of INR3,044m), with Embedded
Product Development (EPD) division contributing 80.1% to revenue, Industrial
design and VLC (14.4%) and System integration at 5.5%.
EBITDA grew 23% YoY to INR691m (est. of INR733m) as margins expanded 50bp
YoY to 23.5% (est. of 24.1%).
PAT grew 17.4% YoY to INR419m (est. of INR469m) due to lower other income
at INR11m vs INR76m in base quarter.
Exhibit 1: Revenue trend (INR m)
Revenue from Operations
28%
22%
18%
10%
8%
11%
9%
29%
Revenue from Operations
28%
28%
24%
27%
21%
1,732 1,900 2,001 2,115 1,908 2,059 2,215 2,313 2,435 2,637 2,741 2,940 2,953
Source: MOSL, Company
1 August 2016
3

Tata Elxsi
Exhibit 2: EBIDTA trend
EBITDA (INR m)
22% 22%
17%
8%
135 324 436 470 377 418 504 474 560 613 663 672 691
20% 20%
23%
EBITDA Margins (%)
20%
23% 23% 24% 23% 23%
Exhibit 3: PAT trend
PAT
PAT Margins (%)
15% 14% 15% 14% 14%
13% 13%
11% 10% 11% 11%
10%
5%
89 199 216 218 208 236 278 298 357 381 399 411 418
Source: MOSL, Company
Software development reports 24% growth, SI de-grows 12%
Software division revenues grew by 24% YoY to INR2,792m, while systems
integration (SI) revenues de-grew 12% YoY to INR161m.
Software division contributed 95% to revenues, SI contributed 5%.
Segment EBIT margins for software development and SI were maintained at 25%
and 14%.
Exhibit 5: System integration business trend
Growth %
31
29
28
System Integration
33
24
139
(55)
169
194
13
(4)
(35)
174
184
(7)
(36)
157
124
204
161
Growth %
18
(12)
Exhibit 4: Software business trend (INR m)
Software Development
27
10
16
24
10
1,769 1,890 2,021 2,139 2,251 2,479 2,616 2,735 2,792
Source: MOSL, Company
Exhibit 6: Software EBIT trend
EBIT (INR m)
20%
21%
24%
25%
25%
EBIT Margins (%)
26%
26%
26%
25%
Exhibit 7: System integration EBIT trend
EBIT (INR m)
11%
8%
3%
1%
19
16
20
25
1
12
28
22
11%
14%
EBIT Margins (%)
14%
10%
14%
352
403
478
534
570
648
680
698
684
4
Source: MOSL, Company
1 August 2016
4

Tata Elxsi
Valuation and view
Higher offshoring in auto to drive multi-year growth:
With higher penetration
of automotive electronics – (software, which comprised 2% of total value of a
vehicle in 2000, now comprises 15% of the total value and expected to reach
20% by 2020), just 0.4% offshoring penetration and 40-50% cost savings -
offshoring to India can be a multi-year growth story. This, we believe can drive
30% CAGR over FY16-18 in automotive revenues for TELX as against 46%
revenue CAGR over FY12-16.
Broadcast – another high growth segment:
Similar to automotive, we expect
20% revenue CAGR over in the broadcast division over FY16-18 as against 25%
revenue CAGR over FY12-16 segment led by investments by operators in
developing newer services and features. With automotive and broadcast
together accounting for ~60% of TELX’s revenues in FY18, we believe TELX can
post 24% overall revenue CAGR between FY16-18.
Medical electronics and Internet of Things (IoT) – could see significant
contribution going forward:
Medical segment is in incubation currently, and is
yet to achieve critical mass. However, given renewed interest in developing this
segment, we believe medical electronics could be the fourth core segment for
TELX in the software solutions business. TELX is targeting medical devices in
point of care and diagnostic segments. Similarly, TELX is working with customers
across industries (retail, energy, smart home, healthcare) for IoT developments
which hold hyper growth potential.
Best in class return rations, cash generation and dividend payout:
With a pure
service business model requiring minimal capital investments, TELX delivers
superior return ratios – 44% RoCE and 44% RoE for FY18E along with ~40%
dividend payout. We expect TELX to derive significant operating and free cash
flows from operations, which should total INR4.7b and INR4.4b, respectively in
FY17 & 18.
We value the stock at 24x FY18E EPS of INR82, arriving at target of INR1,965.
Exhibit 9: 1-year forward PB (x)
15 Yrs Avg(x)
10 Yrs Avg(x)
Exhibit 8: 1-year forward PE (x)
48
P/E (x)
5 Yrs Avg(x)
15.5
12.5
P/B (x)
5 Yrs Avg(x)
15 Yrs Avg(x)
10 Yrs Avg(x)
33
18.0
18
16.3
3
17.0
22.4
9.5
6.5
3.5
0.5
6.0
5.6
5.3
9.1
Source: MOSL
Source: MOSL
1 August 2016
5

Tata Elxsi
Exhibit 10: Key assumptions
Segments
Software Development - (A+B+C)
Systems Integration- (D)
Total Revenues (INR m)
Software Development
Systems Integration
Total Revenue Growth (%)
Software Development
Systems Integration
Total Revenue Mix (%)
Software Development
Systems Integration
Total EBIT (INR m)
Software Development
Systems Integration
Total EBIT Margin (%)
Software Development
Systems Integration
Total EBIT Mix (%)
FY12
4,543
845
5,387
27%
46%
30%
84%
16%
100%
598
84
740
13%
10%
14%
88%
12%
100%
FY13
5,530
687
6,217
22%
-19%
15%
89%
11%
100%
624
17
721
11%
2%
12%
97%
3%
100%
FY14
6,827
921
7,748
23%
34%
25%
88%
12%
100%
1,379
84
1,364
20%
9%
18%
94%
6%
100%
FY15
7,817
676
8,493
15%
-27%
10%
92%
8%
100%
1,829
54
1,765
23%
8%
21%
97%
3%
100%
FY16
10,075
667
10,741
29%
5%
26%
94%
6%
100%
2,597
67
2,471
26%
10%
23%
97%
3%
100%
FY17E
12,545
700
13,245
25%
5%
23%
95%
5%
100%
3,387
70
3,246
27%
10%
25%
98%
2%
100%
FY18E
15,711
735
16,446
25%
5%
24%
96%
4%
100%
4,320
81
4,122
28%
11%
25%
98%
2%
100%
Source: Company, MOSL
1 August 2016
6

Tata Elxsi
Financials and Valuations
Consolidated - Income Statement
Y/E March
Total Income from Operations
Change (%)
EBITDA
Margin (%)
Depreciation
EBIT
Int. and Finance Charges
Other Income
PBT bef. EO Exp.
PBT after EO Exp.
Current Tax
Deferred Tax
Tax Rate (%)
Reported PAT
Adjusted PAT
Change (%)
Margin (%)
FY12
5,387
29.5
740
13.7
205
535
23
42
554
554
144
22
30.1
346
346
6.4
6.4
FY13
6,217
15.4
721
11.6
237
483
39
48
493
334
102
8
32.9
213
320
-7.6
5.1
FY14
7,748
24.6
1,365
17.6
350
1,015
18
126
1,122
1,122
376
24
35.6
723
723
126.1
9.3
FY15
8,494
9.6
1,766
20.8
247
1,518
0
41
1,560
1,560
535
-4
34.0
1,029
1,029
42.3
12.1
FY16
10,752
26.6
2,471
23.0
226
2,245
0
119
2,363
2,363
815
0
34.5
1,548
1,548
50.5
14.4
FY17E
13,245
23.2
3,179
24.0
243
2,935
0
123
3,058
3,058
1,040
0
34.0
2,018
2,018
30.4
15.2
(INR Million)
FY18E
16,446
24.2
3,996
24.3
261
3,735
0
129
3,864
3,864
1,314
0
34.0
2,550
2,550
26.3
15.5
Consolidated - Balance Sheet
Y/E March
Equity Share Capital
Total Reserves
Net Worth
Deferred Liabilities
Total Loans
Capital Employed
Gross Block
Less: Accum. Deprn.
Net Fixed Assets
Capital WIP
Curr. Assets, Loans&Adv.
Inventory
Account Receivables
Cash and Bank Balance
Loans and Advances
Curr. Liability & Prov.
Account Payables
Provisions
Net Current Assets
Deferred Tax assets
Appl. of Funds
E: MOSL Estimates
FY12
311
1,608
1,920
131
342
2,392
1,963
964
999
105
2,243
0
1,369
267
606
1,048
719
329
1,195
93
2,392
FY13
311
1,640
1,952
192
585
2,729
2,190
1,198
992
213
2,449
3
1,567
233
645
1,071
830
241
1,378
147
2,729
FY14
311
2,046
2,357
128
0
2,485
1,821
853
968
126
2,789
0
1,748
515
526
1,458
994
463
1,331
59
2,485
FY15
311
2,523
2,834
0
0
2,834
2,293
1,308
985
26
3,640
3
1,791
1,333
514
1,821
1,139
682
1,819
4
2,834
FY16
311
3,546
3,857
0
0
3,857
2,603
1,534
1,070
19
4,895
0
2,152
1,825
919
2,140
1,250
889
2,756
13
3,857
FY17E
311
4,743
5,054
0
0
5,054
2,803
1,777
1,026
0
6,763
0
2,903
2,850
1,011
2,748
1,560
1,188
4,015
13
5,054
(INR Million)
FY18E
311
6,173
6,484
0
0
6,484
3,003
2,038
965
0
8,991
0
3,605
4,325
1,061
3,485
1,937
1,547
5,506
13
6,484
1 August 2016
7

Tata Elxsi
Financials and Valuations
Ratios
Y/E March
Basic (INR)
EPS
Cash EPS
BV/Share
DPS
Payout (%)
Valuation (x)
P/E
Cash P/E
P/BV
EV/Sales
EV/EBITDA
Return Ratios (%)
RoE
RoCE
RoIC
Working Capital Ratios
Asset Turnover (x)
Debtor (Days)
Leverage Ratio (x)
Current Ratio
Debt/Equity
FY12
11.1
17.7
61.7
7.0
73.2
FY13
10.3
17.9
62.7
5.0
85.5
FY14
23.2
34.5
75.7
9.0
45.3
FY15
33.0
41.0
91.0
11.0
39.9
49.9
40.3
18.1
5.9
28.3
18.5
18.6
19.2
2.3
93
2.1
0.2
16.5
14.9
15.1
2.3
92
2.3
0.3
33.6
30.0
31.7
3.1
82
1.9
0.0
39.6
39.6
60.3
3.0
77
2.0
0.0
FY16
49.7
57.0
123.9
14.0
33.8
33.2
29.0
13.3
4.6
20.1
46.3
46.3
84.3
2.8
73
2.3
0.0
FY17E
64.8
72.6
162.3
22.0
40.7
25.5
22.7
10.2
3.7
15.3
45.3
45.3
91.9
2.6
80
2.5
0.0
FY18E
81.9
90.3
208.2
30.0
43.9
20.1
18.3
7.9
2.9
11.8
44.2
44.2
113.0
2.5
80
2.6
0.0
Consolidated - Cash Flow Statement
Y/E March
OP/(Loss) before Tax
Depreciation
Interest & Finance Charges
Direct Taxes Paid
(Inc)/Dec in WC
CF from Operations
Others
CF from Operating incl EO
(inc)/dec in FA
Free Cash Flow
(Pur)/Sale of Investments
Others
CF from Investments
Issue of Shares
(Inc)/Dec in Debt
Interest Paid
Dividend Paid
Others
CF from Fin. Activity
Inc/Dec of Cash
Opening Balance
Closing Balance
E: MOSL Estimates
FY12
554
205
23
-138
-86
558
66
624
-282
342
0
-51
-332
0
44
-23
-218
-35
-232
59
208
267
FY13
334
237
23
-177
-89
328
51
379
3
382
0
-307
-304
0
183
-39
-218
-35
-109
-34
267
233
FY14
1,122
350
16
-174
-99
1,215
73
1,288
1
1,289
0
-221
-221
0
-585
-18
-156
-26
-786
282
233
515
FY15
1,551
255
-54
-392
74
1,434
-4
1,430
-329
1,101
0
38
-290
0
0
0
-321
0
-321
818
515
1,333
FY16
2,363
226
0
-815
-445
1,329
0
1,329
-304
1,026
0
0
-304
0
0
0
-523
-11
-534
492
1,333
1,825
FY17E
3,058
243
0
-1,040
-234
2,028
0
2,028
-181
1,847
0
0
-181
0
0
0
-821
0
-821
1,025
1,825
2,850
(INR Million)
FY18E
3,864
261
0
-1,314
-15
2,796
0
2,796
-200
2,596
0
0
-200
0
0
0
-1,120
0
-1,120
1,476
2,850
4,325
1 August 2016
8

Tata Elxsi
Corporate profile
Company description
Incorporated in 1989, Tata Elxsi (TELX) operates in
two core segments – software, which contributes
88% to revenues, and systems integration, which
contributes 12% to revenues. In the software
vertical, 77% of revenues are derived from
embedded product development (EPD), followed by
industrial design, which contributes 9% to revenues,
and the balance 2% is derived from visual
computing labs (VCL). Within EPD, TELX caters to
three core industries – automotive (40% of EPD
revenues), broadcast (35% of EPD revenues) and
communications (25% of EPD revenues). TELX
employs 4,200 people and derives approximately
equal revenues from US, Europe and Asia.
Exhibit 2: Shareholding pattern (%)
Jun-16
Promoter
DII
FII
Others
44.6
3.5
12.5
39.4
Mar-16
44.8
3.0
13.4
38.8
Jun-15
45.0
3.7
8.6
42.8
Source: Capitaline
Source: Capitaline
Exhibit 1: Sensex rebased
Source: MOSL/Bloomberg
Exhibit 3: Top holders
Holder Name
Wasatch Emerging Markets small Cap Fund
Life Insurance Corporation
California Public Employees' Retirement
Swiss Finance Corporation Ltd
% Holding
1.3
1.2
1.0
1.0
Note: FII Includes depository receipts
Exhibit 4: Top management
Name
N G Subramaniam
Madhukar Dev
G Vaidyanathan
Designation
Chairman
Managing Director & CEO
Company Secretary
Exhibit 5: Directors
Name
N G Subramaniam
Madhukar Dev
Gopichand Katragadda
M S Ananth*
Name
P G Mankad*
P McGoldrick*
Shyamala Gopinath*
Source: Capitaline
*Independent
Exhibit 6: Auditors
Name
Deloitte Haskins & Sells
Type
Statutory
Exhibit 7: MOSL forecast v/s consensus
EPS
(INR)
MOSL
forecast
64.8
81.9
Consensus
forecast
66.7
87.3
Variation
(%)
-2.8
-6.2
Source: Bloomberg
FY17
FY18
Source: Capitaline
1 August 2016
9

Disclosures
This document has been prepared by Motilal Oswal Securities Limited (hereinafter referred to as Most) to provide information about the company (ies) and/sector(s), if any, covered in the report and may be distributed by it and/or
its affiliated company(ies). This report is for personal information of the selected recipient/s and does not construe to be any investment, legal or taxation advice to you. This research report does not constitute an offer, invitation or
inducement to invest in securities or other investments and Motilal Oswal Securities Limited (hereinafter referred as MOSt) is not soliciting any action based upon it. This report is not for public distribution and has been furnished to
you solely for your general information and should not be reproduced or redistributed to any other person in any form. This report does not constitute a personal recommendation or take into account the particular investment
objectives, financial situations, or needs of individual clients. Before acting on any advice or recommendation in this material, investors should consider whether it is suitable for their particular circumstances and, if necessary, seek
professional advice. The price and value of the investments referred to in this material and the income from them may go down as well as up, and investors may realize losses on any investments. Past performance is not a guide
for future performance, future returns are not guaranteed and a loss of original capital may occur.
MOSt and its affiliates are a full-service, integrated investment banking, investment management, brokerage and financing group. We and our affiliates have investment banking and other business relationships with a some
companies covered by our Research Department. Our research professionals may provide input into our investment banking and other business selection processes. Investors should assume that MOSt and/or its affiliates are
seeking or will seek investment banking or other business from the company or companies that are the subject of this material and that the research professionals who were involved in preparing this material may educate
investors on investments in such business . The research professionals responsible for the preparation of this document may interact with trading desk personnel, sales personnel and other parties for the purpose of gathering,
applying and interpreting information. Our research professionals are paid on twin parameters of performance & profitability of MOSt.
MOSt generally prohibits its analysts, persons reporting to analysts, and members of their households from maintaining a financial interest in the securities or derivatives of any companies that the analysts cover. Additionally,
MOSt generally prohibits its analysts and persons reporting to analysts from serving as an officer, director, or advisory board member of any companies that the analysts cover. Our salespeople, traders, and other professionals or
affiliates may provide oral or written market commentary or trading strategies to our clients that reflect opinions that are contrary to the opinions expressed herein, and our proprietary trading and investing businesses may make
investment decisions that are inconsistent with the recommendations expressed herein. In reviewing these materials, you should be aware that any or all of the foregoing among other things, may give rise to real or potential
conflicts of interest. MOSt and its affiliated company(ies), their directors and employees and their relatives may; (a) from time to time, have a long or short position in, act as principal in, and buy or sell the securities or derivatives
thereof of companies mentioned herein. (b) be engaged in any other transaction involving such securities and earn brokerage or other compensation or act as a market maker in the financial instruments of the company(ies)
discussed herein or act as an advisor or lender/borrower to such company(ies) or may have any other potential conflict of interests with respect to any recommendation and other related information and opinions.; however the
same shall have no bearing whatsoever on the specific recommendations made by the analyst(s), as the recommendations made by the analyst(s) are completely independent of the views of the affiliates of MOSt even though
there might exist an inherent conflict of interest in some of the stocks mentioned in the research report
Reports based on technical and derivative analysis center on studying charts company's price movement, outstanding positions and trading volume, as opposed to focusing on a company's fundamentals and, as such, may not
match with a report on a company's fundamental analysis. In addition MOST has different business segments / Divisions with independent research separated by Chinese walls catering to different set of customers having various
objectives, risk profiles, investment horizon, etc, and therefore may at times have different contrary views on stocks sectors and markets.
Unauthorized disclosure, use, dissemination or copying (either whole or partial) of this information, is prohibited. The person accessing this information specifically agrees to exempt MOSt or any of its affiliates or employees from,
any and all responsibility/liability arising from such misuse and agrees not to hold MOSt or any of its affiliates or employees responsible for any such misuse and further agrees to hold MOSt or any of its affiliates or employees free
and harmless from all losses, costs, damages, expenses that may be suffered by the person accessing this information due to any errors and delays. The information contained herein is based on publicly available data or other
sources believed to be reliable. Any statements contained in this report attributed to a third party represent MOSt’s interpretation of the data, information and/or opinions provided by that third party either publicly or through a
subscription service, and such use and interpretation have not been reviewed by the third party. This Report is not intended to be a complete statement or summary of the securities, markets or developments referred to in the
document. While we would endeavor to update the information herein on reasonable basis, MOSt and/or its affiliates are under no obligation to update the information. Also there may be regulatory, compliance, or other reasons
that may prevent MOSt and/or its affiliates from doing so. MOSt or any of its affiliates or employees shall not be in any way responsible and liable for any loss or damage that may arise to any person from any inadvertent error in
the information contained in this report. MOSt or any of its affiliates or employees do not provide, at any time, any express or implied warranty of any kind, regarding any matter pertaining to this report, including without limitation
the implied warranties of merchantability, fitness for a particular purpose, and non-infringement. The recipients of this report should rely on their own investigations.
This report is intended for distribution to institutional investors. Recipients who are not institutional investors should seek advice of their independent financial advisor prior to taking any investment decision based on this report or
for any necessary explanation of its contents.
Most and it’s associates may have managed or co-managed public offering of securities, may have received compensation for investment banking or merchant banking or brokerage services, may have received any compensation
for products or services other than investment banking or merchant banking or brokerage services from the subject company in the past 12 months.
Most and it’s associates have not received any compensation or other benefits from the subject company or third party in connection with the research report.
Subject Company may have been a client of Most or its associates during twelve months preceding the date of distribution of the research report
MOSt and/or its affiliates and/or employees may have interests/positions, financial or otherwise of over 1 % at the end of the month immediately preceding the date of publication of the research in the securities mentioned in this
report. To enhance transparency, MOSt has incorporated a Disclosure of Interest Statement in this document. This should, however, not be treated as endorsement of the views expressed in the report.
Motilal Oswal Securities Limited is registered as a Research Analyst under SEBI (Research Analyst) Regulations, 2014. SEBI Reg. No. INH000000412
Pending Regulatory inspections against Motilal Oswal Securities Limited:
SEBI pursuant to a complaint from client Shri C.R. Mohanraj alleging unauthorized trading, issued a letter dated 29th April 2014 to MOSL notifying appointment of an Adjudicating Officer as per SEBI regulations to hold inquiry and
adjudge violation of SEBI Regulations; MOSL replied to the Show Cause Notice whereby SEBI granted us an opportunity of Inspection of Documents. Since all the documents requested by us were not covered we have requested
to SEBI vide our letter dated June 23, 2015 to provide pending list of documents for inspection.
List of associate companies of Motilal Oswal Securities Limited -
Click here to access detailed report
Analyst Certification
The views expressed in this research report accurately reflect the personal views of the analyst(s) about the subject securities or issues, and no part of the compensation of the research analyst(s) was, is, or will be directly or
indirectly related to the specific recommendations and views expressed by research analyst(s) in this report. The research analysts, strategists, or research associates principally responsible for preparation of MOSt research
receive compensation based upon various factors, including quality of research, investor client feedback, stock picking, competitive factors and firm revenues
Disclosure of Interest Statement
Analyst ownership of the stock
Served as an officer, director or employee -
Tata Elxsi
TATA ELXSI
No
No
A graph of daily closing prices of securities is available at www.nseindia.com and http://economictimes.indiatimes.com/markets/stocks/stock-quotes
Regional Disclosures (outside India)
This report is not directed or intended for distribution to or use by any person or entity resident in a state, country or any jurisdiction, where such distribution, publication, availability or use would be contrary to law, regulation or
which would subject MOSt & its group companies to registration or licensing requirements within such jurisdictions.
For Hong Kong:
This report is distributed in Hong Kong by Motilal Oswal capital Markets (Hong Kong) Private Limited, a licensed corporation (CE AYY-301) licensed and regulated by the Hong Kong Securities and Futures
Commission (SFC) pursuant to the Securities and Futures Ordinance (Chapter 571 of the Laws of Hong Kong) “SFO”. As per SEBI (Research Analyst Regulations) 2014 Motilal Oswal Securities (SEBI Reg No. INH000000412)
has an agreement with Motilal Oswal capital Markets (Hong Kong) Private Limited for distribution of research report in Kong Kong. This report is intended for distribution only to “Professional Investors” as defined in Part I of
Schedule 1 to SFO. Any investment or investment activity to which this document relates is only available to professional investor and will be engaged only with professional investors.” Nothing here is an offer or solicitation of
these securities, products and services in any jurisdiction where their offer or sale is not qualified or exempt from registration. The Indian Analyst(s) who compile this report is/are not located in Hong Kong & are not conducting
Research Analysis in Hong Kong.
For U.S.
Motilal Oswal Securities Limited (MOSL) is not a registered broker - dealer under the U.S. Securities Exchange Act of 1934, as amended (the"1934 act") and under applicable state laws in the United States. In addition MOSL is
not a registered investment adviser under the U.S. Investment Advisers Act of 1940, as amended (the "Advisers Act" and together with the 1934 Act, the "Acts), and under applicable state laws in the United States. Accordingly, in
the absence of specific exemption under the Acts, any brokerage and investment services provided by MOSL, including the products and services described herein are not available to or intended for U.S. persons.
This report is intended for distribution only to "Major Institutional Investors" as defined by Rule 15a-6(b)(4) of the Exchange Act and interpretations thereof by SEC (henceforth referred to as "major institutional investors"). This
document must not be acted on or relied on by persons who are not major institutional investors. Any investment or investment activity to which this document relates is only available to major institutional investors and will be
engaged in only with major institutional investors. In reliance on the exemption from registration provided by Rule 15a-6 of the U.S. Securities Exchange Act of 1934, as amended (the "Exchange Act") and interpretations thereof by
the U.S. Securities and Exchange Commission ("SEC") in order to conduct business with Institutional Investors based in the U.S., MOSL has entered into a chaperoning agreement with a U.S. registered broker-dealer, Motilal
Oswal Securities International Private Limited. ("MOSIPL"). Any business interaction pursuant to this report will have to be executed within the provisions of this chaperoning agreement.
The Research Analysts contributing to the report may not be registered /qualified as research analyst with FINRA. Such research analyst may not be associated persons of the U.S. registered broker-dealer, MOSIPL, and
therefore, may not be subject to NASD rule 2711 and NYSE Rule 472 restrictions on communication with a subject company, public appearances and trading securities held by a research analyst account.
For Singapore
Motilal Oswal Capital Markets Singapore Pte Limited is acting as an exempt financial advisor under section 23(1)(f) of the Financial Advisers Act(FAA) read with regulation 17(1)(d) of the Financial Advisors Regulations and is a
subsidiary of Motilal Oswal Securities Limited in India. This research is distributed in Singapore by Motilal Oswal Capital Markets Singapore Pte Limited and it is only directed in Singapore to accredited investors, as defined in the
Financial Advisers Regulations and the Securities and Futures Act (Chapter 289), as amended from time to time.
In respect of any matter arising from or in connection with the research you could contact the following representatives of Motilal Oswal Capital Markets Singapore Pte Limited:
Varun Kumar
Varun.kumar@motilaloswal.com
Contact : (+65) 68189232
Office Address:21 (Suite 31),16 Collyer Quay,Singapore 04931
Kadambari Balachandran
kadambari.balachandran@motilaloswal.com
(+65) 68189233 / 65249115
1 August 2016
Motilal Oswal Tower, Level 9, Sayani Road, Prabhadevi, Mumbai 400 025
Phone: +91 22 3982 5500 E-mail: reports@motilaloswal.com
Motilal Oswal Securities Ltd
10