Pidilite Industries
BSE SENSEX
27,982
S&P CNX
8,623
2 August 2016
1QFY17 Results Update | Sector: Consumer
CMP: INR740
TP: INR850 (+15%)
Buy
Motilal Oswal values your support in
the Asiamoney Brokers Poll 2016 for
India Research, Sales and Trading
team. We
request your ballot.
Long-term growth drivers in place
Bloomberg
Equity Shares (m)
M.Cap.(INRb)/(USDb)
52-Week Range (INR)
1, 6, 12 Rel. Per (%)
Avg Val, (INR m)
Free float (%)
PIDI IN
512.7
379.5 / 5.7
770 / 508
0/15/33
355
30.4
Financials & Valuations (INR b)
Y/E Mar
2016 2017E 2018E
Net Sales
53.7
60.7
73.8
EBITDA
11.8
14.0
16.5
PAT
7.6
9.4
11.1
EPS (INR)
14.8
18.3
21.6
Gr. (%)
46.6
23.0
18.2
BV/Sh (INR)
53.4
68.0
82.9
RoE (%)
30.4
30.1
28.6
RoCE (%)
29.1
28.7
27.6
P/E (x)
49.9
40.6
34.3
P/BV (x)
13.9
10.9
8.9
Estimate change
TP change
Rating change
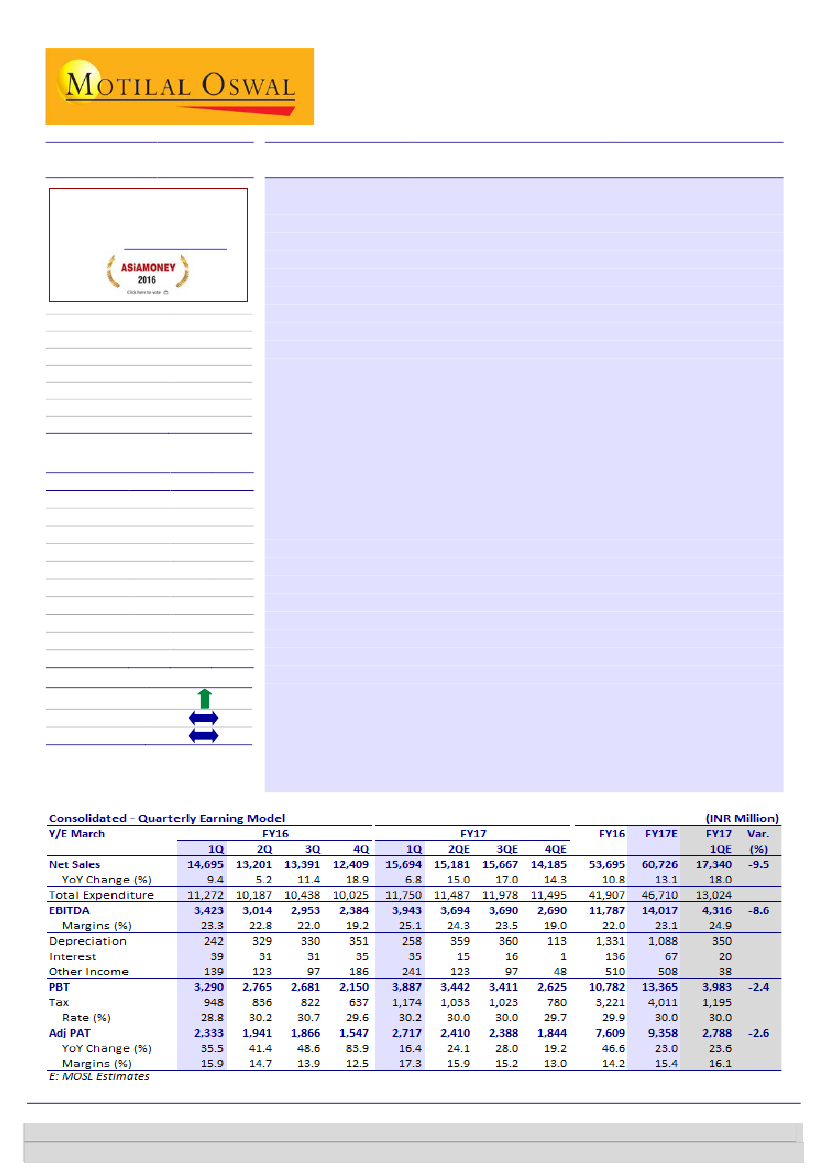
Pidilite Industries’ (PIDI) 1QFY17
performance was below our expectations.
Consolidated sales grew 6.8% YoY (est. of +18% YoY) to INR15.7b (Ind-AS).
Volume growth was reportedly ~9% YoY in the Consumer Bazaar segment.
EBITDA grew 15.2% YoY (est. of +25.6%) to INR3.94b. Adjusted PAT was up
16.4% YoY (est. of +23.6%) at INR2.72b.
Sharp gross margin expansion:
Gross margin expanded sharply by 330bp YoY
to 52.3% aided by benign input costs, but the impact was partly offset by
higher staff costs (+70bp YoY) and other expenses (+80bp YoY). EBITDA margins
expanded 180bp YoY (est. of +150bp) to 25.1%.
Segmental performance:
Consumer Bazaar posted 9.4% YoY revenue growth,
with underlying EBIT margin expansion of 130bp YoY to 27.1%. Industrial
segment’s revenues grew 4.2% YoY, while EBIT margin expanded 270bp YoY to
18.3%.
Standalone highlights:
Sales, EBITDA and adj. PAT grew 4.9%, 8.6% and 20.9%,
respectively, on a YoY basis. Gross and EBITDA margins rose 420bp YoY and
320bp YoY, respectively. Subsidiary revenues exhibited a sharp improvement
YoY to 21.6%, but EBITDA declined to INR76m vs. INR161m in 1QFY16.
Key concall highlights:
(1) VAM costs remain benign around USD900, and at
these levels, the company is unlikely to increase prices. (2) According to
management, its distribution reach, brand, first-to-market status, innovation
and generation of trust give an edge over competition.
Valuation and view:
We believe PIDI offers a high-quality discretionary play
with its strong competitive positioning, proven in-market excellence and
impeccable track record of generating long-term shareholder value over
multiple periods. We continue to like the franchise, despite near-term rich
valuations. While we have reduced our sales forecasts for FY17, we still get an
8.8% EPS upgrade for FY18 as (a) we are assuming faster sales growth in FY18,
led by good monsoon and implementation of 7
th
Pay Commission
recommendations, (b) we are no longer assuming a steep operating margin
decline given the favorable material cost outlook, and (c) due to the absence of
amortization expenses (~25% of D&A) going forward as per Ind-AS. We
maintain our
Buy
rating, with a revised target price of INR850 (37x June 2018
EPS).
Investors are advised to refer through important disclosures made at the last page of the Research Report.
Motilal Oswal research is available on www.motilaloswal.com/Institutional-Equities, Bloomberg, Thomson Reuters, Factset and S&P Capital.
Krishnan Sambamoorthy
(Krishnan.Sambamoorthy@MotilalOswal.com); +91 22 3982 5428
Vishal Punmiya
(Vishal.Punmiya@MotilalOswal.com); +91 22 3980 4261

Pidilite Industries
Key quarterly charts
Exhibit 1: Segmental Performance (Consolidated)
Segmental
Consumer and Bazaar
Sales (INRm)
Sales Growth (%)
EBIT (INRm)
% Contribution
EBIT Growth %
EBIT margin %
Industrial Products
Sales (INR m)
Sales Growth (%)
EBIT (INRm)
% Contribution
EBIT Growth %
EBIT margin %
1QFY14 2QFY14 3QFY14 4QFY14 1QFY15 2QFY15 3QFY15 4QFY15 1QFY16 2QFY16 3QFY16 4QFY16 1QFY17
8,417
13.2
2,415
92.6
20.8
28.7
1,863
0.8
192
7.3
-15.1
10.3
7,883
18.6
1,931
88.9
29.2
24.5
2,162
26.8
247
11.4
48.4
11.4
7,822
15.1
1,559
91.6
-1.8
19.9
1,939
17.0
181
10.6
-1.2
9.3
6,988
19.1
1,228
88.9
-10.0
17.6
2,193
17.2
184
13.3
-21.0
8.4
10,169
20.8
2,413
95.0
-0.1
23.7
2,169
16.4
161
6.3
-16.0
7.4
9,135
15.9
1,997
88.7
3.4
21.9
2,327
7.7
267
11.9
8.2
11.5
8,803
12.5
1,893
89.5
21.4
21.5
2,039
5.2
251
11.8
38.8
12.3
7,668
9.7
1,373
84.4
11.8
17.9
2,157
-1.6
288
17.7
56.9
13.4
10,921
7.4
3,270
91.7
35.5
29.9
2,185
0.7
335
9.4
108.4
15.3
9,612
5.2
2,756
108.5
38.0
28.7
2,116
-9.1
370
14.6
38.6
17.5
9,751
10.8
2,825
88.8
49.2
29.0
2,102
3.1
367
11.5
46.5
17.5
8,618
12.4
2,222
83.8
61.8
25.8
2,319
7.5
463
17.5
60.8
20.0
14,504
15.5
3,926
89.9
15.8
27.1
2,457
12.5
449
10.3
33.8
18.3
Source: Company, MOSL
Exhibit 2: Consol. sales grew 6.8% YoY led by 9% volume
growth in domestic consumer bazaar
Sales growth (%)
Exhibit 3: Gross margins expanded 330bp YoY
Gross Margins (%)
Source: Company, MOSL
Exhibit 4: Employee expenses up 70bp YoY..
Employees Cost (%)
Exhibit 5: ..while other expenses were up by 80bp YoY
Other Expenditure (%)
Source: Company, MOSL
2 August 2016
2

Pidilite Industries
Exhibit 6: EBITDA margins expanded 180bp YoY
EBIDTA Margins (%)
Exhibit 7: Consol. PAT thus grew 16.4% YoY
PAT Growth (%)
Source: Company, MOSL
1QFY17 Geography Wise Performance
Sales for overseas subsidiaries grew 18% YoY to INR1.75b in 1QFY17 on constant
currency terms with EBITDA margin contraction of 420bp to 5.8%. EBITDA stood
at INR102m for 1QFY17.
North America:
Sales growth stood at 16.4% for 1QFY17 led by good growth in
art and craft material business. EBITDA margin however contracted by 320bp to
8.7% with EBITDA decline of 15.2% YoY to INR68.2m.
South America:
Sales declined by 10.8% to INR213.7m impacted by difficult
economic conditions. EBITDA losses reduced from INR7.4m in base quarter
1QFY16 to INR1.3m in 1QFY17.
Middle East & Africa:
Sales grew by 27.9% to INR281.1m with EBITDA loss of
INR45.6m for the quarter higher than INR20.5m loss in 1QFY16 due to lower
plant capacity utilization, higher SG&A expenses and delay in ramp up of sales.
South East Asia:
Sales growth stood at 19% to INR137.5m for 1QFY17. EBITDA
margin declined 940bp to 16.5% with EBITDA declining by 24.1% YoY to
INR22.7m.
SAARC:
Sales grew by 42.1% to INR337.7m with EBITDA decline of 11.8% to
INR58.3m for the quarter as EBITDA margins declined 1050 bps YoY to 17.3% in
1QFY17. Sales performance was due to continued good growth in Bangladesh as
well as impact of acquisition in Sri Lanka in 4QFY16.
2 August 2016
3

Pidilite Industries
Exhibit 8: Quarterly performance of Overseas Subsidiaries
Sales (INR Mn)
North America
South America
Middle East & Africa
South & South East Asia
SAARC
Total
EBITDA (INR M)
North America
South America
Middle East & Africa
South & South East Asia
SAARC
Total
EBITDA Margin (%)
North America
South America
Middle East & Africa
South & South East Asia
SAARC
Total
1QFY16
672
240
220
116
238
1,485
1QFY16
80
(7)
(21)
30
66
149
1QFY16
12.0
-3.1
-9.3
25.9
27.8
10.0
1QFY17
782
214
281
138
338
1,752
1QFY17
68
(1)
(46)
23
58
102
1QFY17
8.7
-0.6
-16.2
16.5
17.3
5.8
Change (%)
16.4
(10.8)
27.9
19.0
42.1
18.0
Change (%)
(15.2)
(82.4)
122.4
(24.1)
(11.8)
(31.1)
Change (bp)
(3.2)
2.5
(6.9)
(9.4)
(10.5)
(4.2)
Source: Company, MOSL
*in constant currency terms and before extraordinary items
Pidilite 1QFY17 conference call highlights
Performance and outlook
Consumer and Bazaar segment reported 9% volume growth, while there was
11% volume growth for industrial products.
9% volume growth has been in line with average of past 3-4 quarters but
nevertheless a bit lower than expectations according to the management.
There was steady volume growth across all segments.
Domestic acquisitions of the past 2 years doing well. Both waterproofing
services Nina and Percept have healthy order book. Blue coat and Falcofix are
also doing well. Ica JV started to contribute.
Premiumization in adhesive and sealants is a stated objective and management
is happy with the progress. Marine, Hyper variant launches Fevicol are examples
of premium products.
Material pricing and margins
VAM costs- no material change, remain benign around USD 900 range.
Value growth is trailing volume growth for the first time in decades off late.
Management believes they have done the required stimulation in terms of
discounts and price cuts in 3QFY16.
There is no direct correlation in the category between price cuts and demand
growth. Management does not believe demand will improve substantially if they
cut prices.
If VAM remains at these levels then unlikely to increase prices.
EBITDA margins not likely to be sustainable if crude moves up. If crude goes
back to $70-80 then 19-20% margins at a consolidated level are likely.
2 August 2016
4

Pidilite Industries
Industrial segment
Industrial margin is now structurally high because of better portfolio. Exited low
price commodity products.
Nevertheless, low material costs do aid margins in the industrial segment.
Competition
Imported furniture has been in vogue for many years and has been steadily
growing. However new customers in woodworking in retail and commercial also
growing. No structural change towards imported furniture.
Management has a strategy and do cater to readymade furniture made in India
as well.
Woodworking, adhesive dependence of Pidilite has anyway reduced over the
years.
On Asian Paints entry, management maintained that it is early to comment.
Large competitors like Henkel and 3M have always been there.
Management believes that distribution and brand are only some parts of their
right to win. Their first to market status, innovation, generations of trust are
other important factors.
There has also been increase in competitive activity in waterproofing. But key
challenge is to grow market. Competition will aid growth of category.
New launches and recent acquisition
In Feviquick have launched a thicker gel type product as a variant.
Recent Kenya acquisition is local entity used for manufacturing.
GST impact
18% GST rate will be beneficial. Excise and VAT put together are around 23%.
GST will also enable them to relook at network and thus take costs out of the
system
They are however not paying the entire 23% as there are exemptions in some
manufacturing plants which will go off in the next couple of years
Management did not comment whether the benefits will be passed on
Overseas business
Happy with growth
Overseas margins have been impacted as (a) Big business in Bangladesh which
had highly inflated margin base in Q1FY16. (b) Middle east manufacturing
facility commissioned in Q3 last year so lower fixed costs in Q1FY16 and Q2
FY16. Going forward after a couple of quarters margins will be back to earlier
high levels and (c) North America inventory provision due to some product
quality issue. Two factors affecting margins were thus one offs and one should
get addressed after a couple of quarters.
Sri Lanka business acquired in Q3 of last year is reporting steady growth
Balance Sheet
Can working capital shrink further? Desire to optimize working capital but
project business has higher working capital
Historical capex 3.5%-4% of sales. Not a capex intensive business
2 August 2016
5

Pidilite Industries
Valuation and view
Pidilite offers a high quality discretionary play with strong competitive
positioning, proven in-market excellence and an impeccable track record of
generating long term shareholder value over multiple periods.
We continue to like the franchise notwithstanding near term rich valuations.
While we have reduced our sales forecasts for FY17, we still get an 8.8% EPS
upgrade for FY18 as (a) we are assuming faster sales growth in FY18 led by good
monsoon and implementation of 7
th
Pay Commission recommendations, (b) we
are no longer assuming steep operating margin decline given favorable material
costs outlook and (c) Absence of amortization expenses (~25% of D&A) going
forward as per Ind AS.
Maintain
Buy,
with a revised target price of INR850 (37x June 2018 EPS).
Exhibit 9: Revise estimates upwards by 8.8%
New
Net Sales
EBITDA
Adjusted PAT
FY17E
60,726
14,017
9,346
FY18E
73,835
16,463
11,052
FY17E
62,747
13,710
8,655
Old
FY18E
74,188
15,962
10,161
% Change
FY17E
FY18E
-3.2
-0.5
2.2
3.1
8.0
8.8
Source: Company, MOSL
Exhibit 10: PIDI P/E (x): Sharp re-rating in last 12 months
53.0
41.0
29.0
17.0
5.0
7.8
24.8
PE (x)
Peak(x)
Avg(x)
40.9
40.0
Min(x)
Exhibit 11: PIDI P/E premium vs. Sensex
Pidilite Inds. PE Relative to Sensex PE (%)
150
100
50
0
-50
45.6
LPA (%)
135.9
Source: Company, MOSL
2 August 2016
6

Pidilite Industries
Exhibit 12: Valuation Matrix of coverage universe
Company
Consumer
Asian Paints
Britannia
Colgate
Dabur*
Emami*
Godrej Consumer
GSK Consumer
Hind. Unilever
ITC
Jyothy Labs
Marico*
Nestle
Page Industries
Parag Milk Foods
Pidilite Inds.
P&G Hygiene
Radico Khaitan
United Spirits
Retail
Jubilant Foodworks
Shopper's Stop
Titan Company
Reco
Neutral
Buy
Buy
Neutral
Buy
Neutral
Buy
Neutral
Buy
Buy
Neutral
Neutral
Buy
Neutral
Buy
Buy
Buy
Buy
Buy
Neutral
Neutral
Price
(INR)
1,115
2,930
933
304
1,138
1,591
6,331
922
252
287
284
7,166
14,318
322
740
6,552
90
2,454
1,222
375
419
Mkt Cap
(USD M)
15,959
5,246
3,788
7,974
3,856
8,088
3,974
29,758
45,484
776
5,470
10,312
2,384
339
5,700
3,174
178
5,322
1,196
460
5,553
EPS Growth YoY (%)
FY16 FY17E FY18E
25.0
41.9
6.9
17.5
16.7
26.1
17.7
12.9
-3.5
24.2
23.7
-7.3
21.0
-66.7
46.6
19.8
-2.6
LP
-6.0
20.3
-11.7
20.1
21.6
8.5
12.3
15.5
22.3
9.7
7.1
17.9
-6.7
14.6
-5.7
25.0
41.1
23.0
12.0
14.7
21.1
54.0
54.3
17.0
16.3
15.2
21.4
15.5
19.5
15.1
14.7
12.8
15.6
12.4
16.6
20.5
31.3
32.5
18.2
19.7
21.0
50.8
46.1
45.4
15.3
P/E (x)
EV/EBITDA (x)
ROE (%) Div. (%)
FY16 FY17E FY18E FY16 FY17E FY18E FY16
FY16
60.1
43.2
42.5
42.6
45.6
47.3
38.8
48.4
32.7
32.9
51.7
59.8
67.3
48.0
49.9
51.3
14.0
79.3
76.7
63.8
51.2
50.1
35.6
39.1
37.9
39.5
38.7
35.3
45.2
27.7
35.3
45.1
63.4
53.9
34.0
40.6
45.8
12.2
65.5
49.8
41.4
43.8
43.0
30.9
32.2
32.8
33.1
33.6
30.8
40.1
24.0
31.4
38.7
52.6
41.0
25.7
34.3
38.3
10.1
43.4
34.1
28.4
38.0
40.2
29.5
27.0
34.3
38.7
36.1
28.6
33.8
20.8
25.3
34.3
42.2
41.9
17.9
31.5
34.4
9.9
36.4
28.5
14.9
41.1
33.3
24.6
23.6
30.6
31.5
28.7
25.7
31.4
18.4
22.5
30.3
36.6
34.1
16.2
26.2
29.5
8.6
34.3
20.8
12.4
32.1
28.6
20.4
19.4
26.5
26.5
25.7
21.6
27.9
15.7
19.9
25.9
30.2
26.4
13.3
22.0
23.9
7.4
25.8
15.3
9.7
27.7
34.4
54.6
66.8
33.2
43.0
23.9
29.9
82.4
29.3
19.2
36.2
40.9
46.9
19.5
30.4
31.2
9.3
36.7
14.1
6.3
21.8
0.8
0.9
1.1
0.7
0.7
0.6
1.1
1.7
2.7
1.4
1.2
0.7
0.6
0.0
0.6
1.0
1.1
0.0
0.2
0.4
0.6
Note: For Nestle FY16 means CY15
Source: Company, MOSL
2 August 2016
7

Pidilite Industries
Financials and Valuations
Income Statement
Y/E March
Net Sales
Change (%)
Raw Materials
Gross Profit
Margin (%)
Operating Expenses
EBITDA
Change (%)
Margin (%)
Depreciation
Int. and Fin. Charges
Other Income
Profit before Taxes
Change (%)
Margin (%)
Tax
Tax Rate (%)
Adj PAT
Change (%)
Margin (%)
FY11
26,714
20.2
14,047
12,666
47.4
7,884
4,783
18.1
17.9
595
314
158
4,031
29.6
15.1
947
23.5
3,084
12.3
11.5
FY12
31,590
18.3
17,403
14,187
44.9
9,026
5,161
7.9
16.3
637
307
110
4,327
7.3
13.7
1,100
25.4
3,226
4.6
10.2
FY13
37,255
17.9
20,152
17,103
45.9
10,698
6,405
24.1
17.2
686
155
231
5,795
33.9
15.6
1,595
27.5
4,200
30.2
11.3
FY14
43,166
15.9
23,613
19,553
45.3
12,504
7,048
10.1
16.3
812
163
115
6,188
6.8
14.3
1,653
26.7
4,536
8.0
10.5
FY15
48,441
12.2
26,686
21,756
44.9
14,017
7,739
9.8
16.0
1,178
157
482
6,886
11.3
14.2
1,694
24.6
5,192
14.5
10.7
FY16
53,695
10.8
25,863
27,832
51.8
16,044
11,787
52.3
22.0
1,331
136
510
10,830
57.3
20.2
3,221
29.7
7,609
46.6
14.2
(INR Million)
FY17E
60,726
13.1
28,682
32,045
52.8
18,028
14,017
18.9
23.1
1,088
67
508
13,369
23.4
22.0
4,011
30.0
9,358
23.0
15.4
FY18E
73,835
21.6
35,673
38,163
51.7
21,700
16,463
17.5
22.3
1,186
67
591
15,801
18.2
21.4
4,740
30.0
11,060
18.2
15.0
Balance Sheet
Y/E March
Share Capital
Reserves
Net Worth
Loans
Deferred Liability
Minority Interest
Capital Employed
Gross Block
Less: Accum. Depn.
Net Fixed Assets
Capital WIP
Goodwill
Others
Investments
Curr. Assets, L&A
Inventory
Account Receivables
Cash and Bank Balance
Others
Curr. Liab. and Prov.
Account Payables
Provisions
Net Current Assets
Application of Funds
E: MOSL Estimates
FY11
506
10,341
10,847
3,356
420
2
14,625
10,599
4,960
5,639
3,500
0
0
2,363
8,897
4,092
3,460
380
966
5,774
4,590
1,184
3,123
14,625
FY12
508
12,698
13,206
3,213
468
5
16,892
11,792
5,616
6,177
3,938
0
10
983
12,536
4,541
3,952
2,732
1,311
6,751
5,463
1,288
5,784
16,892
FY13
513
16,003
16,515
1,112
499
10
18,136
12,623
6,370
6,253
4,280
205
48
2,941
12,434
5,236
4,305
1,506
1,387
8,024
5,785
2,239
4,410
18,136
FY14
513
19,014
19,526
459
537
42
20,565
14,212
7,150
7,062
4,580
230
59
2,603
14,750
5,997
5,244
1,772
1,737
8,719
6,510
2,209
6,031
20,565
FY15
513
22,193
22,706
584
566
51
23,907
17,867
8,298
9,570
4,618
215
68
3,599
15,077
6,410
5,861
860
1,946
9,240
6,933
2,308
5,837
23,907
FY16
513
26,876
27,389
842
670
89
28,989
20,072
9,630
10,443
4,618
239
139
8,490
16,472
6,289
7,294
349
2,540
11,411
8,568
2,843
5,061
28,990
(INR Million)
FY17E
513
34,332
34,845
842
670
89
36,445
22,935
11,081
11,854
4,618
239
139
9,990
21,727
8,305
7,973
2,526
2,923
12,123
8,851
3,271
9,604
36,445
FY18E
513
41,973
42,486
842
670
89
44,086
25,830
12,662
13,168
4,618
239
139
11,490
29,153
10,101
9,697
5,981
3,374
14,721
10,866
3,855
14,432
44,087
2 August 2016
8

Pidilite Industries
Financials and Valuations
Ratios
Y/E March
Basic (INR)
EPS
Cash EPS
BV/Share
DPS
Payout %
Valuation (x)
P/E
Cash P/E
EV/Sales
EV/EBITDA
P/BV
Dividend Yield (%)
Return Ratios (%)
RoE
RoCE
RoIC
Working Capital Ratios
Debtor (Days)
Creditor (Days)
Asset Turnover (x)
Leverage Ratio
Debt/Equity (x)
FY11
6.1
10.6
21.4
1.8
28.6
FY12
6.4
11.4
26.0
1.9
29.8
FY13
8.2
13.8
32.2
2.6
31.6
FY14
8.8
15.3
38.1
2.7
30.3
FY15
10.1
17.4
44.3
2.9
28.7
FY16
14.8
25.6
53.4
4.2
28.3
FY17E
18.3
29.5
68.0
4.9
26.6
FY18E
21.6
34.4
82.9
5.7
26.4
121.5
69.7
14.0
78.5
34.5
0.2
116.5
64.8
11.9
72.7
28.5
0.3
90.4
53.5
10.1
58.7
23.0
0.4
83.7
48.3
8.7
53.3
19.4
0.4
73.1
42.6
7.8
48.5
16.7
0.4
49.9
28.9
6.9
31.5
13.9
0.6
40.6
25.1
6.1
26.2
10.9
0.7
34.3
21.5
4.9
22.0
8.9
0.8
31.5
23.4
39.7
47
76
3.0
26.8
21.9
38.3
46
75
2.6
28.3
24.6
44.5
42
68
3.5
25.2
24.1
43.5
44
66
3.3
24.6
23.9
37.4
44
62
3.1
30.4
29.1
48.4
50
75
3.5
30.1
28.7
51.9
48
69
2.8
28.6
27.6
51.8
48
69
2.7
0.3
0.2
0.1
0.0
0.0
0.0
0.0
0.0
Cash Flow Statement
Y/E March
PBT before Extra Ord
Add: Depreciation
Interest Paid
Less: Taxes Paid
Interest income
(Incr)/Decr in WC
CF from Operations
Extra ordinary items
CFO after extraordinary
Incr in FA
Free Cash Flow
Pur of Investments
CF from Invest.
Change in Networth
Incr in Debt
Dividend Paid
Interest Paid
Others
CF from Fin. Activity
Incr/Decr of Cash
Add: Opening Balance
Closing Balance
E: MOSL Estimates
(INR Million)
FY11
4,031
595
314
947
158
-435
3,401
10
3,411
-1,344
2,067
314
-1,030
-2,008
-1,331
1,029
-314
175
-2,449
-68
449
380
FY12
4,327
637
307
1,100
110
-309
3,751
0
3,751
-1,614
2,138
1,381
-233
-1,959
-143
1,122
-307
121
-1,167
2,352
380
2,732
FY13
5,795
686
155
1,595
231
149
4,958
18
4,977
-1,104
3,873
-1,958
-3,062
-2,459
-2,100
1,559
-155
14
-3,141
-1,226
2,732
1,506
FY14
6,188
812
163
1,653
115
-1,355
4,041
-65
3,976
-1,921
2,055
338
-1,583
-3,068
-653
1,619
-163
138
-2,127
266
1,506
1,772
FY15
6,886
1,178
157
1,694
482
-718
5,327
-107
5,219
-3,723
1,496
-996
-4,719
-3,705
125
1,789
-157
536
-1,411
-912
1,772
860
FY16
10,830
1,331
136
3,221
510
266
8,832
-48
8,784
-2,205
6,579
-4,891
-7,095
-5,285
258
2,519
-136
445
-2,199
-510
860
350
FY17E
13,369
1,088
67
4,011
508
-2,367
7,639
-4
7,635
-2,500
5,135
-1,500
-4,000
-4,800
0
2,909
-67
499
-1,459
2,176
349
2,526
FY18E
15,801
1,186
67
4,740
591
-1,373
10,350
0
10,350
-2,500
7,850
-1,500
-4,000
-3,411
0
0
-67
583
-2,895
3,455
2,526
5,981
2 August 2016
9

Pidilite Industries
Corporate profile
Company description
Pidilite Industries is the largest branded
adhesives player in India, with an iconic brand
like Fevicol. Apart from a strong presence in
adhesives, company has expanded into
emerging segments like mechanized joinery,
modular furniture, flooring, automotive care and
water proofing through Dr Fixit and Roff.
Exhibit 1: Sensex rebased
Source: MOSL/Bloomberg
Exhibit 2: Shareholding pattern (%)
Promoter
DII
FII
Others
Jun-16
69.6
6.1
14.0
10.3
Mar-16
69.6
6.4
13.3
10.8
Jun-15
69.7
5.1
14.7
10.5
Exhibit 3: Top holders
Holder Name
Genesis Indian Investment Company Limited
-General Sub Fund
Life Insurance Corporation Of India
% Holding
6.8
1.2
Note: FII Includes depository receipts
Source: Capitaline
Source: Capitaline
Exhibit 4: Top management
Name
N K Parekh
M B Parekh
Bharat Puri
Savithri Parekh
Designation
Vice Chairman
Executive Chairman
Managing Director
Company Secretary
Exhibit 5: Directors
Name
Bansi S Mehta
Sanjeev Aga
A B Parekh
Meera Shankar
Vinod K Dasari
Name
Ranjan Kapur
Sabyaschi Patnaik
A N Parekh
Uday Khanna
Source: Capitaline
*Independent
Exhibit 6: Auditors
Name
Delloite Haskins & Sells
M M Sheth & Co
Mahajan & Aibara
Type
Statutory
Secretarial Audit
Internal
Exhibit 7: MOSL forecast v/s consensus
EPS
(INR)
FY17
FY18
MOSL
forecast
18.3
21.6
Consensus
forecast
16.8
19.3
Variation (%)
8.8
11.7
Source: Bloomberg
Source: Capitaline
2 August 2016
10

Pidilite Industries
NOTES
2 August 2016
11

Disclosures
Pidilite Industries
This document has been prepared by Motilal Oswal Securities Limited (hereinafter referred to as Most) to provide information about the company (ies) and/sector(s), if any, covered in the report and may be distributed by it and/or its
affiliated company(ies). This report is for personal information of the selected recipient/s and does not construe to be any investment, legal or taxation advice to you. This research report does not constitute an offer, invitation or
inducement to invest in securities or other investments and Motilal Oswal Securities Limited (hereinafter referred as MOSt) is not soliciting any action based upon it. This report is not for public distribution and has been furnished to
you solely for your general information and should not be reproduced or redistributed to any other person in any form. This report does not constitute a personal recommendation or take into account the particular investment
objectives, financial situations, or needs of individual clients. Before acting on any advice or recommendation in this material, investors should consider whether it is suitable for their particular circumstances and, if necessary, seek
professional advice. The price and value of the investments referred to in this material and the income from them may go down as well as up, and investors may realize losses on any investments. Past performance is not a guide for
future performance, future returns are not guaranteed and a loss of original capital may occur.
MOSt and its affiliates are a full-service, integrated investment banking, investment management, brokerage and financing group. We and our affiliates have investment banking and other business relationships with a some
companies covered by our Research Department. Our research professionals may provide input into our investment banking and other business selection processes. Investors should assume that MOSt and/or its affiliates are
seeking or will seek investment banking or other business from the company or companies that are the subject of this material and that the research professionals who were involved in preparing this material may educate investors
on investments in such business . The research professionals responsible for the preparation of this document may interact with trading desk personnel, sales personnel and other parties for the purpose of gathering, applying and
interpreting information. Our research professionals are paid on twin parameters of performance & profitability of MOSt.
MOSt generally prohibits its analysts, persons reporting to analysts, and members of their households from maintaining a financial interest in the securities or derivatives of any companies that the analysts cover. Additionally, MOSt
generally prohibits its analysts and persons reporting to analysts from serving as an officer, director, or advisory board member of any companies that the analysts cover. Our salespeople, traders, and other professionals or affiliates
may provide oral or written market commentary or trading strategies to our clients that reflect opinions that are contrary to the opinions expressed herein, and our proprietary trading and investing businesses may make investment
decisions that are inconsistent with the recommendations expressed herein. In reviewing these materials, you should be aware that any or all of the foregoing among other things, may give rise to real or potential conflicts of interest.
MOSt and its affiliated company(ies), their directors and employees and their relatives may; (a) from time to time, have a long or short position in, act as principal in, and buy or sell the securities or derivatives thereof of companies
mentioned herein. (b) be engaged in any other transaction involving such securities and earn brokerage or other compensation or act as a market maker in the financial instruments of the company(ies) discussed herein or act as an
advisor or lender/borrower to such company(ies) or may have any other potential conflict of interests with respect to any recommendation and other related information and opinions.; however the same shall have no bearing
whatsoever on the specific recommendations made by the analyst(s), as the recommendations made by the analyst(s) are completely independent of the views of the affiliates of MOSt even though there might exist an inherent
conflict of interest in some of the stocks mentioned in the research report Reports based on technical and derivative analysis center on studying charts company's price movement, outstanding positions and trading volume, as
opposed to focusing on a company's fundamentals and, as such, may not match with a report on a company's fundamental analysis. In addition MOST has different business segments / Divisions with independent research
separated by Chinese walls catering to different set of customers having various objectives, risk profiles, investment horizon, etc, and therefore may at times have different contrary views on stocks sectors and markets.
Unauthorized disclosure, use, dissemination or copying (either whole or partial) of this information, is prohibited. The person accessing this information specifically agrees to exempt MOSt or any of its affiliates or employees from,
any and all responsibility/liability arising from such misuse and agrees not to hold MOSt or any of its affiliates or employees responsible for any such misuse and further agrees to hold MOSt or any of its affiliates or employees free
and harmless from all losses, costs, damages, expenses that may be suffered by the person accessing this information due to any errors and delays. The information contained herein is based on publicly available data or other
sources believed to be reliable. Any statements contained in this report attributed to a third party represent MOSt’s interpretation of the data, information and/or opinions provided by that third party either publicly or through a
subscription service, and such use and interpretation have not been reviewed by the third party. This Report is not intended to be a complete statement or summary of the securities, markets or developments referred to in the
document. While we would endeavor to update the information herein on reasonable basis, MOSt and/or its affiliates are under no obligation to update the information. Also there may be regulatory, compliance, or other reasons that
may prevent MOSt and/or its affiliates from doing so. MOSt or any of its affiliates or employees shall not be in any way responsible and liable for any loss or damage that may arise to any person from any inadvertent error in the
information contained in this report. MOSt or any of its affiliates or employees do not provide, at any time, any express or implied warranty of any kind, regarding any matter pertaining to this report, including without limitation the
implied warranties of merchantability, fitness for a particular purpose, and non-infringement. The recipients of this report should rely on their own investigations.
This report is intended for distribution to institutional investors. Recipients who are not institutional investors should seek advice of their independent financial advisor prior to taking any investment decision based on this report or for
any necessary explanation of its contents.
Most and it’s associates may have managed or co-managed public offering of securities, may have received compensation for investment banking or merchant banking or brokerage services, may have received any compensation
for products or services other than investment banking or merchant banking or brokerage services from the subject company in the past 12 months.
Most and it’s associates have not received any compensation or other benefits from the subject company or third party in connection with the research report.
Subject Company may have been a client of Most or its associates during twelve months preceding the date of distribution of the research report
MOSt and/or its affiliates and/or employees may have interests/positions, financial or otherwise of over 1 % at the end of the month immediately preceding the date of publication of the research in the securities mentioned in this
report. To enhance transparency, MOSt has incorporated a Disclosure of Interest Statement in this document. This should, however, not be treated as endorsement of the views expressed in the report.
Motilal Oswal Securities Limited is registered as a Research Analyst under SEBI (Research Analyst) Regulations, 2014. SEBI Reg. No. INH000000412
Pending Regulatory inspections against Motilal Oswal Securities Limited:
SEBI pursuant to a complaint from client Shri C.R. Mohanraj alleging unauthorized trading, issued a letter dated 29th April 2014 to MOSL notifying appointment of an Adjudicating Officer as per SEBI regulations to hold inquiry and
adjudge violation of SEBI Regulations; MOSL replied to the Show Cause Notice whereby SEBI granted us an opportunity of Inspection of Documents. Since all the documents requested by us were not covered we have requested to
SEBI vide our letter dated June 23, 2015 to provide pending list of documents for inspection.
List of associate companies of Motilal Oswal Securities Limited -Click
here to access detailed report
Analyst Certification
The views expressed in this research report accurately reflect the personal views of the analyst(s) about the subject securities or issues, and no part of the compensation of the research analyst(s) was, is, or will be directly or
indirectly related to the specific recommendations and views expressed by research analyst(s) in this report. The research analysts, strategists, or research associates principally responsible for preparation of MOSt research receive
compensation based upon various factors, including quality of research, investor client feedback, stock picking, competitive factors and firm revenues
Disclosure of Interest Statement
Analyst ownership of the stock
Served as an officer, director or employee
PIDILITE INDUSTRIES
No
No
A graph of daily closing prices of securities is available at www.nseindia.com and http://economictimes.indiatimes.com/markets/stocks/stock-quotes
Regional Disclosures (outside India)
This report is not directed or intended for distribution to or use by any person or entity resident in a state, country or any jurisdiction, where such distribution, publication, availability or use would be contrary to law, regulation or which
would subject MOSt & its group companies to registration or licensing requirements within such jurisdictions.
For Hong Kong:
This report is distributed in Hong Kong by Motilal Oswal capital Markets (Hong Kong) Private Limited, a licensed corporation (CE AYY-301) licensed and regulated by the Hong Kong Securities and Futures
Commission (SFC) pursuant to the Securities and Futures Ordinance (Chapter 571 of the Laws of Hong Kong) “SFO”. As per SEBI (Research Analyst Regulations) 2014 Motilal Oswal Securities (SEBI Reg No. INH000000412) has
an agreement with Motilal Oswal capital Markets (Hong Kong) Private Limited for distribution of research report in Kong Kong. This report is intended for distribution only to “Professional Investors” as defined in Part I of Schedule 1 to
SFO. Any investment or investment activity to which this document relates is only available to professional investor and will be engaged only with professional investors.” Nothing here is an offer or solicitation of these securities,
products and services in any jurisdiction where their offer or sale is not qualified or exempt from registration. The Indian Analyst(s) who compile this report is/are not located in Hong Kong & are not conducting Research Analysis in
Hong Kong.
Motilal Oswal Securities Limited (MOSL) is not a registered broker - dealer under the U.S. Securities Exchange Act of 1934, as amended (the"1934 act") and under applicable state laws in the United States. In addition MOSL is not a
registered investment adviser under the U.S. Investment Advisers Act of 1940, as amended (the "Advisers Act" and together with the 1934 Act, the "Acts), and under applicable state laws in the United States. Accordingly, in the
absence of specific exemption under the Acts, any brokerage and investment services provided by MOSL, including the products and services described herein are not available to or intended for U.S. persons.
This report is intended for distribution only to "Major Institutional Investors" as defined by Rule 15a-6(b)(4) of the Exchange Act and interpretations thereof by SEC (henceforth referred to as "major institutional investors"). This
document must not be acted on or relied on by persons who are not major institutional investors. Any investment or investment activity to which this document relates is only available to major institutional investors and will be
engaged in only with major institutional investors. In reliance on the exemption from registration provided by Rule 15a-6 of the U.S. Securities Exchange Act of 1934, as amended (the "Exchange Act") and interpretations thereof by
the U.S. Securities and Exchange Commission ("SEC") in order to conduct business with Institutional Investors based in the U.S., MOSL has entered into a chaperoning agreement with a U.S. registered broker-dealer, Motilal Oswal
Securities International Private Limited. ("MOSIPL"). Any business interaction pursuant to this report will have to be executed within the provisions of this chaperoning agreement.
The Research Analysts contributing to the report may not be registered /qualified as research analyst with FINRA. Such research analyst may not be associated persons of the U.S. registered broker-dealer, MOSIPL, and therefore,
may not be subject to NASD rule 2711 and NYSE Rule 472 restrictions on communication with a subject company, public appearances and trading securities held by a research analyst account.
For Singapore
Motilal Oswal Capital Markets Singapore Pte Limited is acting as an exempt financial advisor under section 23(1)(f) of the Financial Advisers Act(FAA) read with regulation 17(1)(d) of the Financial Advisors Regulations and is a
subsidiary of Motilal Oswal Securities Limited in India. This research is distributed in Singapore by Motilal Oswal Capital Markets Singapore Pte Limited and it is only directed in Singapore to accredited investors, as defined in the
Financial Advisers Regulations and the Securities and Futures Act (Chapter 289), as amended from time to time.
In respect of any matter arising from or in connection with the research you could contact the following representatives of Motilal Oswal Capital Markets Singapore Pte Limited:
Varun Kumar
Varun.kumar@motilaloswal.com
Contact : (+65) 68189232
Office Address:21 (Suite 31),16 Collyer Quay,Singapore 04931
Kadambari Balachandran
kadambari.balachandran@motilaloswal.com
(+65) 68189233 / 65249115
For U.S
2 August 2016
Motilal Oswal Tower, Level 9, Sayani Road, Prabhadevi, Mumbai 400 025
Phone: +91 22 3982 5500 E-mail: reports@motilaloswal.com
Motilal Oswal Securities Ltd
12