8 August 2016
Q1FY17 Results Update | Sector: Consumer
Marico
BSE SENSEX
28,183
S&P CNX
8,711
CMP: INR300
TP: INR305(2%)
Neutral
Motilal Oswal values your support in
the Asiamoney Brokers Poll 2016 for
India Research, Sales and Trading
team. We
request your ballot.
Lower input costs drive profitability
Bloomberg
Equity Shares (m)
M.Cap.(INRb)/(USDb)
52-Week Range (INR)
1, 6, 12 Rel. Per (%)
Avg Val, INRm/ Vol m
Free float (%)
MRCO IN
1,290.2
324.3 / 4.9
307 / 190
10/13/37
388
40.3
Financials & Valuations (INR b)
Y/E Mar
2016 2017E 2018E
Net Sales
60.1
63.0
75.3
EBITDA
10.4
11.8
14.3
PAT
7.2
8.3
10.2
EPS (INR)
5.6
6.4
7.9
Gr. (%)
26.1
14.6
22.8
BV/Sh (INR)
16.3
18.5
21.6
RoE (%)
36.9
37.0
39.3
RoCE (%)
31.4
32.2
34.3
P/E (x)
53.5
46.7
38.0
P/BV (x)
18.5
16.2
13.9
Estimate change
TP change
Rating change
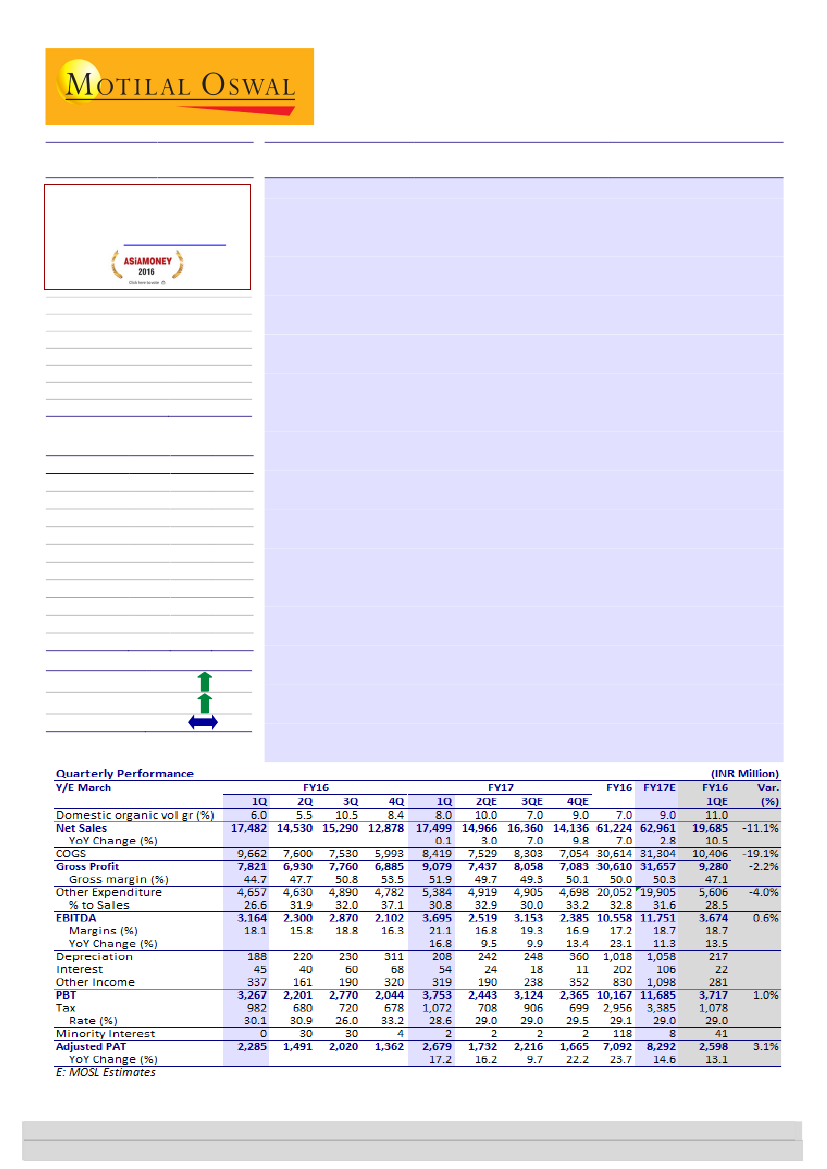
Sales below estimates; EBITDA and PAT exceed expectations:
Marico (MRCO)
posted flat consolidated net sales growth of 0.1% YoY (est. of +10.5% YoY) to
INR17.5b (Ind-AS), EBITDA growth of 16.8% YoY (est. of +13.5% YoY) to INR3.7b
and adjusted PAT growth of 17.2% YoY (est. of +13.1% YoY) to INR2.68b.
Volume growth was 8% for both the domestic (est. of 11%) and international
businesses. Domestic business reported flat revenue growth, with market
shares gained/maintained across all key segments – Parachute (7% volume and
-12% value growth), Saffola (11% volume and value growth) and VAHO (9%
volume and value growth).
Gross margins expanded 720bp YoY
to 51.9%, led by benign RM costs—copra
down 41% YoY (-7% QoQ), Liquid Paraffin down 19% YoY and HDPE down 9%
YoY. Despite higher ad spends (+220bp YoY) and other expenses (+160bp),
EBITDA margin expansion was impressive at 300bp YoY (est. of 50bp) to 21.1%.
PAT grew 17.2% YoY (est. of 13.1%) to INR2.68b.
Concall highlights:
(a) Volume growth guidance of 5-7% for the next three
quarters in Parachute. (b) Saffola volume growth guided at 10% in 2HFY17, and
sees a strong pipeline of products as well in that period (c) Guided for 8-10%
growth in VAHO volumes for the remainder of the year. (d) Monsoons will lead
to lower inflation and thus more spending power for consumers. DBT and 7th
Pay Commission implementation will also help rural demand.
Retain Neutral
:
Volume growth, although lower-than-anticipated, was healthy
across all domestic segments, which is a positive surprise when compared to
peers. Strong gross margin growth ensured EBITDA and PAT beat. While margin
gains may not be as high in the subsequent quarters with hardening input
costs, changes to our model have resulted in 2%/7% upgrade to our FY17/FY18
EPS forecasts. Consistently strong volume performance in an adverse
environment, healthy EPS growth, ROEs of close to 40% and high standards of
disclosures/corporate governance justify the valuation premium. Targeting
36xJune 2018 EPS, we get a TP of INR305. Maintaining
Neutral.
Krishnan Sambamoorthy
(Krishnan.Sambamoorthy@MotilalOswal.com); +91 22 3982 5428
Vishal Punmiya
(Vishal.Punmiya@MotilalOswal.com); +91 22 3980 4261
Investors are advised to refer through important disclosures made at the last page of the Research Report.
Motilal Oswal research is available on www.motilaloswal.com/Institutional-Equities, Bloomberg, Thomson Reuters, Factset and S&P Capital.

Marico
Key quarterly charts
Exhibit 1: Volume growth healthy at 8.4% in 4QFY16
Marico India
Segment growth (%)
Parachute Rigid
Saffola
Value added hair oils
Domestic Business
1QFY16
Volume
Value
8.0
16.0
4.0
7.0
14.0
19.0
6.0
12.0
2QFY16
Volume
Value
11.0
9.0
4.0
4.0
8.0
9.0
5.5
4.0
3QFY16
Volume
Value
4.0
(1.0)
17.0
15.0
21.0
20.0
10.5
7.0
4QFY16
Volume
Value
6.0
(5.0)
13.0
14.0
11.0
12.0
8.4
4.0
1QFY17
Volume
Value
7.0
(12.0)
11.0
11.0
9.0
9.0
8.0
(1.0)
Source: Company, MOSL
Exhibit 2: Domestic volumes posted 8% growth in 1QFY17
Domestic Volume growth (%)
16
10
9
10
4
6
3
7
9
5
6
3
6
Exhibit 3:
Parachute
rigid volumes grew 7%
18
Parachute Volume growth (%)
8
8
8
8
9
6
5
4
1
2
10
6
7
11
8
5
8
4
6
7
Source: MOSL, Company
Exhibit 4:
Saffola
volume growth stood at 11%
Saffola Volume growth (%)
12
6
4
5
10
7
11 10
9
9
3
4
4
17
13
11
Exhibit 5: VAHO volumes grew by 9%
30
25
20
24
16 15
8
5
13
14
5
8
VAHO Volume growth (%)
21
11
10
11
9
(1)
Source: MOSL, Company
Exhibit 6: Segmental Details
Sales (INR m)
Domestic
International
Total
EBIT
Domestic
International
Total
EBIT margins
Domestic EBIT margins
International EBIT margins
Total
1QFY15
12,800
3,430
16,230
2,320
550
2,870
18.1%
16.0%
17.7%
2QFY15
10,790
3,520
14,310
1,550
520
2,070
14.3%
14.8%
14.5%
3QFY15
11,400
3,120
14,520
2,010
470
2,480
17.7%
15.1%
17.1%
4QFY15
9,490
2,770
12,260
1,600
370
1,970
16.9%
13.4%
16.1%
1QFY16
14,037
3,463
17,500
2,955
583
3,539
21.1%
16.8%
20.2%
2QFY16
11,270
3,590
14,860
1,880
570
2,450
16.7%
15.9%
16.5%
3QFY16
12,150
3,410
15,560
2,710
610
3,320
22.3%
17.9%
21.3%
4QFY16
9,775
3,146
12,920
2,134
326
2,461
1QFY17
13,874
3,669
17,543
3,411
701
4,112
21.8%
24.6%
10.4%
19.1%
19.0%
23.4%
Source: Company, MOSL
8 August 2016
2

Marico
Exhibit 7: Consumer offers for the quarter
Source: Company, MOSL
Consol EBITDA and PAT ahead of expectations
Marico’s posted flat consol net sales growth (0.1% vs est. 10.5%) to INR17.5b
(Ind AS).
Gross margin expanded 720bp YoY (est 100 bp) to 51.9% due to benign raw
material costs. Copra costs were down 41% YoY and 7% sequentially. Rice Bran
oil was up 15% and Liquid Paraffin (LP) was down 19% during the quarter as
compared to Q1FY16. The increase in crude oil price has resulted in LLP prices
being up by 11% compared to Q4 FY16. HDPE (a key ingredient in packaging
material) price was down 9% compared to Q1FY16. Management stated in the
press release that they expect Copra prices to increase in the next two quarters.
The company used some of the huge gross margin increase to increase Ad
spends (up 220bp YoY). There was also an increase in other expenditure (up 160
bp YoY) and staff costs (up 40bp YoY). Despite these increases, EBITDA margin
expanded 300bp YoY (est. 50 bp) to 21.1% and EBITDA grew 16.8% YoY (est.
13.5% YoY growth) to INR3.7b (Ind AS).
Adj. PAT growth was up 17.2% YoY (est. 13.1% growth) to INR2.68b (Ind AS).
Domestic: Healthy volume growth in Saffola and VAHO
Domestic volume growth was 8% (est 11%) while. domestic revenues were flat.
Segmental growth- Parachute7% (est.9%), Saffola 9% (est. 12%), Value Added
Hair Oils 11% (est. 13%). Value growth for these key segments was -12%, 9%
and 11% respectively. There was an 18% price decrease in Parachute while
realization in Saffola and VAHO was flat YoY. The Youth brands portfolio grew by
15% in value terms
.
Marico’s rural sales declined by 4% due to higher exposure to the coconut oil
portfolio while the urban sales remained flat in Q1 FY17. Sales in Modern Trade
(9% of the India turnover) continued the good run with growth of 14% in
Q1FY17. CSD and Institutional sales (8% of the India turnover) grew at 3% in
Q1FY17.
Standalone gross margins expanded 660bps YoY to 49.4% while EBITDA margins
grew by 400bps YoY to 21.3%. A&P to sales were up 130 bps YoY to 10.6%
3
8 August 2016

Marico
Parachute (rigid packs): Parachute rigid posted volume growth of 7% while
value growth declined by 12%% (we note, MRCO had initiated weighted price
cut of 6% at the beginning of 3QFY16 and has taken another 6% price cut in
1QFY17. Portfolio market share as on 12 months ended Jun’16 stands at 58%,
maintained YoY.
Value-added hair oils posted 9% and 9% volume and value growth. Marico
continues to grow faster than the market and has gained 147bp in volume and
85 bp in value terms to reach 32% and 25% market share respectively for 12
months ending June 2016.
Saffola posted volume and value growth of 11%. Saffola’s market share has
increased by 261bps to 63% on 12 months ended Jun’16. Saffola Oats exited at
27% value market share (71% value market share in flavored oats market on
MAT basis). Saffola oats franchise crossed INR 1.0b in FY16 (INR2b by FY18).
Youth portfolio:
Youth portfolio increased 15% in value terms in 1QFY17. Set
wet gel brand portfolio saw double digit growth with market share gain of
1039bps in last 12 months to 55%. The company re-launched (new product and
change in packaging & positioning) the deodorants portfolio with a new brand
ambassador Ranveer Singh to gain volume and value market share which stood
at 4% in 1QFY17 and 3% in the past 12 months. The Livon Hair Gain franchise
with a better product formulation and packaging grew in double digits. The
brand communication showcasing real life consumer experiences and the anti-
counterfeit measures adopted by the brand are starting to show results. The
Company has also refreshed Livon Serum- better formulation, refreshed
packaging, celebrity brand ambassador, new communication campaign and low
unit packs at INR 5. Management believes that positive results will follow over
the next couple of quarters.
International Business: 4% constant currency growth
International sales registered a 4% constant currency growth and reported
growth of 6% owing to forex changes.
Bangladesh
revenues reported 6% decline in constant currency terms in 1QFY17
mainly due to price corrections in Parachute coconut oil which declined in sales
by 7% YoY with flat volume growth, while maintaining its 82% market share. The
value added hair oils (VAHO) portfolio posted 6% constant currency growth.
Marico expects non-coconut oil portfolio to account for 80% of incremental
growth in Bangladesh post FY17 with modest growth in coconut oil business.
South East Asia (majorly Vietnam)
sales grew by 15% in constant currency
terms (ex- Beauté Cosmétique Societé Par Actions -divested subsidiary of ICP
Vietnam). The Company continues to scale up its presence in neighboring
countries like Myanmar. Myanmar is poised to be a USD 7 million business by
end of the year.
Middle East and North Africa (MENA)
grew by 6% YoY (constant currency)
primarily. Middle East constant currency sales were flat owing to high base of
24% growth in 1QFY16. Egypt business started reporting positive growth in
4QFY16 and increase sharply again in 1QFY17 with constant currency sales
increasing by 21 YoY%
South Africa
grew by 8% (constant currency) despite tough macro conditions.
8 August 2016
4

Marico
Con-call highlights
Observation on results and outlook
Satisfactory quarter with broad based volume and earnings growth.
Comfortable with medium term margin decline as long as volume growth is
healthy and they invest in the business.
Rural 34% of sales now and LUPs will be one of the key driver of growth in rural.
Pre 2012 both rural and urban growth witnessed strong growth. Between 2012
and 2014 there was much faster growth in rural, which has slowed down in the
past 2 years. Green shoots in urban particularly in modern trade.
Monsoons will lead to lower inflation and also more money in the consumer’s
hands. DBT and 7
th
Pay Commission implementation will also help rural demand.
Parachute
In earlier two cycles had struggled to grow volumes in Parachute unlike now.
18% realization decline in India and 9% in Bangladesh.
Have developed extremely sophisticated pricing model and learnt from last two
cycles and also increased rural presence in Parachute. This has led to higher
growth in volumes compared to other hair oil peers. The management did point
out that coconut oil category has also grown unlike other hair oil segments.
Able to maximize volume growth and increase market share through the
sophisticated model with 80-90% accuracy.
Three sets of 6% price decreases in Parachute anniversarising in 1QFY18.
Guided volume growth of 5-7% for next 3 quarters in Parachute. Was 7% in
1QFY17.
Value growth in Parachute only from 4QFY17.
Why did they take price increase taken in July in Parachute? In anticipation of
cost increases? Copra 6-7% increase in August over July. But crude softer than
impact and monsoons good. Was going to take it in September anyway and was
preponed a bit.
Saffola
Volume growth target 10% in second half. Did 11% in 1QFY17.
What have they done right in Saffola? Differential regional pricing and new
communication. If RM costs increases willing to take up prices.
Exciting and power packed innovation pipeline in Saffola post September.
Oats doing well. Slowed down but still in double digits. Nevertheless,
management mentioned that they need to develop new brands in foods.
VAHO
VAHO broad based growth was witnessed across all brands.
VAHO 8-10% volume growth guidance this year. Was 9% in 1QFY17.
Youth business
Youth business continues to recover. Set Wet on a good wicket need to do more
work on Livon.
International business
Bangladesh improvement only in 2HFY17.
Middle East stable despite consumption headwinds.
8 August 2016
5

Marico
Egypt showing good recovery.
South East Asian business guided for double digit constant currency growth
going forward.
International business also guided for double digit constant currency growth in
2HFY17.
Other points
Slight increase in CSD receivables led to increase in receivables.
Believe GST will be beneficial over the long term.
Currently, Edible oils and Parachute excise nil and VAT is 5-6%. VAHO is 12.5%
VAT.
Total number of new ESOPs is capped at 0.6% of share capital over a 5 year
period.
Using technology for (a) Automatic distributor replenishment, (b) Sales system
ensuring all direct distribution model has SKU wise outlet wise sales enabling, (c)
more sophisticated PDAs with ads etc.
A&P guided for 11.5% to 12% of sales. Working on Project H which enables
more bang for the buck. Use data on outlet wise and SKU wise sales and will
track performance of A&P schemes.
Employee costs at 5.5% to 6% in the last 3-4 years will be maintained. Will use
ESOPs judiciously so that EPS impact is checked and employees are also
rewarded.
New launch Sarson (mustard) oil brand satisfactory. New brands take time to
grow.
Valuation & view
Volume growth while lower than anticipated was healthy across all domestic
segments, a positive surprise compared to peers. Strong gross margin growth
ensured EBITDA and PAT beat. While margin gains may not be as high in the
subsequent quarters with hardening input costs, changes to our model have
resulted in 2%/7% upgrade to our FY17/FY18 EPS forecasts.
Consistently strong volume growth performance in adverse environment,
healthy EPS growth, ROEs of close to 40% and high standards of disclosures and
corporate governance justify the premium valuations. Targeting 36xJune 2018
EPS, we get a target price of INR305. Maintain Neutral.
Exhibit 8: Change estimates by 2%/7%
Old
FY
Sales
EBITDA
PAT
FY17E
68,427
11,833
8,129
FY18E
79,545
13,742
9,482
FY17E
62,961
11,751
8,292
New
FY18E
75,257
14,270
10,178
Change
FY17E
FY18E
-8.0%
-5.4%
-0.7%
3.8%
2.0%
7.3%
Source: Company, MOSL
8 August 2016
6

Marico
Exhibit 9: Marico P/E (x)
45.0
37.0
29.0
21.0
13.0
5.0
24.9
10.6
PE (x)
Peak(x)
Avg(x)
42.7
Min(x)
42.7
Exhibit 10: Marico P/E premium vs. Sensex
180
150
120
90
60
30
0
-30
-60
Marico PE Relative to Sensex PE (%)
LPA (%)
144.3
49.5
Source: Company, MOSL
Exhibit 1: Valuation Matrix of coverage universe
Company
Consumer
Asian Paints
Britannia
Colgate
Dabur*
Emami*
Godrej Consumer
GSK Consumer
Hind. Unilever
ITC
Jyothy Labs
Marico*
Nestle
Page Industries
Parag Milk Foods
Pidilite Inds.
P&G Hygiene
Radico Khaitan
United Spirits
Retail
Jubilant Foodworks
Shopper's Stop
Titan Company
Reco
Neutral
Buy
Buy
Neutral
Buy
Neutral
Neutral
Neutral
Buy
Buy
Neutral
Neutral
Buy
Neutral
Buy
Buy
Buy
Buy
Buy
Neutral
Neutral
Price
(INR)
1,149
3,152
1,016
293
1,149
1,571
6,305
929
250
290
300
6,852
14,172
324
729
6,695
91
2,238
1,208
382
420
Mkt Cap
(USD M)
16,494
5,658
4,137
7,716
3,904
8,004
3,968
30,089
45,162
785
5,791
9,887
2,366
341
5,594
3,252
180
4,867
1,185
470
5,575
EPS Growth YoY (%)
FY16 FY17E FY18E
25.0
41.9
6.9
17.5
17.7
24.4
20.7
12.9
-3.5
24.2
26.1
-7.3
21.0
-66.7
46.6
19.8
-2.6
LP
-6.0
19.3
-13.4
20.1
21.6
8.5
12.3
10.0
22.9
4.6
7.1
17.9
-6.7
14.6
-5.5
25.0
41.1
23.0
12.0
14.7
21.1
54.0
48.9
11.4
16.3
15.2
21.4
15.5
23.9
25.8
9.9
12.8
15.6
12.4
22.8
25.5
31.3
32.5
18.2
19.7
21.0
50.8
46.1
30.9
21.0
P/E (x)
EV/EBITDA (x)
ROE (%) Div. (%)
FY16 FY17E FY18E FY16 FY17E FY18E FY16
FY16
62.0
46.5
46.3
41.1
45.6
47.3
37.6
48.8
32.4
33.2
53.5
57.2
66.6
48.2
49.1
52.5
14.0
72.3
75.8
65.6
52.2
51.6
38.3
42.6
36.6
41.5
38.5
36.0
45.6
27.5
35.6
46.7
60.5
53.3
34.1
39.9
46.8
12.2
59.7
49.2
44.0
46.9
44.4
33.2
35.1
31.7
33.5
30.6
32.8
40.4
23.8
31.6
38.0
48.2
40.6
25.8
33.8
39.1
10.1
39.6
33.7
33.6
38.7
41.5
31.8
29.4
33.1
38.9
35.1
27.6
34.1
20.6
25.5
36.8
40.3
41.5
18.0
31.0
35.1
9.9
33.5
28.2
15.6
43.2
34.4
26.5
25.7
29.5
32.3
29.5
26.3
31.7
18.2
22.7
32.6
35.2
33.8
16.3
25.8
30.2
8.6
31.6
20.5
12.9
35.6
29.5
22.0
21.2
25.5
26.7
24.3
23.3
28.1
15.6
20.1
26.7
28.0
26.1
13.3
21.7
24.5
7.4
23.7
15.2
10.6
29.1
34.4
54.6
66.8
33.2
43.4
23.4
30.7
82.4
29.3
19.2
36.9
40.9
46.9
19.5
30.4
31.2
9.3
36.7
14.1
6.3
21.3
0.8
0.8
1.0
0.7
0.7
0.6
1.0
1.7
2.7
1.4
1.1
0.7
0.6
0.0
0.6
1.0
1.1
0.0
0.2
0.0
0.6
Note: For Nestle FY16 means CY15
Source: Company, MOSL
8 August 2016
7

Marico
Financials and Valuations
Income Statement
(INR Million)
Y/E March
2011
2012
2013
2014
2015
2016
2017E
2018E
Net Sales
31,283
39,682
45,843
46,762
57,203
60,148
62,961
75,257
17.6
26.8
15.5
2.0
22.3
7.0
4.7
19.5
Change (%)
COGS
16,671
21,787
22,414
24,088
31,356
30,777
31,304
37,031
Gross Profit
14612
17895
23429
22674
25847
29371
31657
38226
Margin (%)
46.7
45.1
51.1
48.5
45.2
48.8
50.3
50.8
Operating Expenses
10,515
13,166
17,290
15,301
17,274
18,954
19,905
23,955
EBITDA
4,098
4,729
6,140
7,374
8,574
10,417
11,751
14,270
22.8
12.8
21.4
Change (%)
9.2
15.4
29.8
20.1
16.3
Margin (%)
13.1
11.9
13.4
15.8
15.0
17.3
18.7
19.0
Depreciation
708
725
866
769
843
949
1,058
1,157
Int. and Fin. Charges
393
424
580
345
230
206
106
100
Other Income - Recurring
279
440
494
685
716
1,030
1,098
1,344
Profit before Taxes
3,275
4,021
5,187
6,946
8,217
10,292
11,685
14,358
6.5
22.8
29.0
33.9
18.3
25.8
13.5
22.9
Change (%)
Margin (%)
10.5
10.1
11.3
14.9
14.4
17.1
18.6
19.1
Current Tax (excl MAT Ent)
534
709
1,186
1,793
2,383
3,054
3,385
4,171
Tax Rate (%)
25.9
19.5
28.2
27.4
28.8
29.7
29.0
29.1
Minority Interest
-50
-50
-98
-187
-114
-5
-8
-8
Profit after Taxes
2,375
3,189
3,627
4,854
5,735
7,233
8,292
10,178
-0.3
33.5
15.0
35.3
16.0
25.9
14.6
22.8
Change (%)
Margin (%)
7.6
8.0
7.9
10.4
10.0
12.0
13.2
13.5
Reported PAT
2,864
3,171
3,959
4,854
5,735
7,233
8,292
10,178
Note: We have adjusted FY16, FY17 and FY18 P&L numbers for Ind AS Impact. Since Ind AS Balance Sheet has not been shared we have
retained earlier numbers.
Balance Sheet
Y/E March
Share Capital
Reserves
Net Worth
Loans
Capital Employed
Gross Fixed Assets
Intangibles
Less: Accum. Depn.
Net Fixed Assets
Capital WIP
Goodwill
Investments
Current
Curr. Assets, L&A
Inventory
Account Receivables
Cash and Bank Balance
Others
Curr. Liab. and Prov.
Current Liabilities
Provisions
Net Current Assets
Deferred Tax Liability
Application of Funds
E: MOSL Estimates
2011
1,229
7,926
9,155
7,718
17,092
6,177
1,438
-3,366
4,250
648
3,976
890
890
12,203
6,011
1,880
2,131
2,181
5,175
4,098
1,077
7,028
301
17,092
2012
1,230
10,200
11,430
7,848
19,527
7,058
1,589
-4,031
4,617
402
3,955
2,957
2,957
14,017
7,202
2,083
1,321
3,411
6,643
5,446
1,197
7,374
223
19,527
2013
1,290
18,526
19,815
8,719
28,885
8,091
8,918
-4,261
12,748
1,477
3,955
1,516
1,515
17,377
8,627
1,966
2,668
4,117
8,129
6,919
1,210
9,247
-58
28,885
2014
1,290
12,317
13,606
6,798
20,762
8,614
1,020
-3,301
6,333
44
2,543
3,105
3,105
17,624
7,962
2,232
4,064
3,366
8,791
7,934
857
8,833
-96
20,762
2015
1,290
16,958
18,248
4,279
22,664
8,807
1,034
-3,973
5,868
30
4,892
2,838
2,838
17,625
9,947
1,768
2,049
3,861
8,511
7,471
1,040
9,115
-79
22,664
2016
1,290
19,678
20,968
3,317
24,428
9,267
1,060
-4,868
5,458
367
4,980
4,164
4,164
19,261
9,258
2,524
3,097
4,382
9,804
8,642
1,162
9,458
1
24,428
(INR Million)
2017E
1,290
22,612
23,902
3,767
27,669
10,707
1,020
-5,926
5,801
367
4,980
4,997
4,997
20,400
9,759
2,455
3,154
5,032
8,814
7,382
1,432
11,586
-62
27,669
2018E
1,290
26,583
27,873
4,217
32,090
11,707
1,020
-7,083
5,644
367
4,980
5,996
5,996
24,923
11,665
2,935
4,523
5,800
9,670
8,021
1,649
15,253
-150
32,090
8 August 2016
8

Marico
Financials and Valuations
Ratios
Y/E March
Basic (INR)
EPS
Cash EPS
BV/Share
DPS
Payout %
Valuation (x)
P/E
Cash P/E
EV/Sales
EV/EBITDA
P/BV
Dividend Yield (%)
Return Ratios (%)
RoE
RoCE
Working Capital Ratios
Debtor (Days)
Asset Turnover (x)
Leverage Ratio
Debt/Equity (x)
2011
1.9
2.9
7.5
0.3
17.1
2012
2.6
3.2
9.3
0.3
13.5
2013
2.8
3.7
15.4
0.3
8.9
2014
3.8
4.4
10.5
2.0
53.1
2015
4.4
5.1
14.1
1.2
28.1
2016
5.6
6.4
16.3
3.4
60.2
2017E
6.4
6.3
18.5
2.7
42.0
2018E
7.9
7.7
21.6
3.2
39.9
67.5
58.8
6.8
45.1
21.2
0.4
53.5
46.8
6.4
36.8
18.5
1.1
46.7
47.6
6.1
32.6
16.2
0.9
38.0
39.2
5.1
26.7
13.9
1.0
30.3
19.3
23.4
22
1.8
31.0
19.6
22.8
19
2.0
23.2
17.1
19.9
16
1.6
29.0
21.3
26.1
17
2.3
36.0
27.7
35.2
11
2.5
36.9
31.4
38.6
15
2.5
37.0
32.2
42.3
14
2.3
39.3
34.3
46.1
14
2.3
0.8
0.7
0.4
0.5
0.2
0.2
0.2
0.2
Cash Flow Statement
Y/E March
OP/(loss) before Tax
Int./Div. Received
Depreciation
Interest Paid
Direct Taxes Paid
(Incr)/Decr in WC
CF from Operations
(Incr)/Decr in FA
Free Cash Flow
(Pur)/Sale of Investments
CF from Invest.
(Incr)/Decr in Debt
Dividend Paid
Others
CF from Fin. Activity
Incr/Decr of Cash
Add: Opening Balance
Closing Balance
E: MOSL Estimates
2011
3,275
-279
708
393
-534
-1,178
2,386
-1,842
544
-63
-1,905
3,260
-472
-2,252
536
1,017
1,115
2,131
2012
4,021
-440
725
424
-709
-1,156
2,864
-787
2,077
-2,067
-2,853
130
-500
-450
-821
-810
2,131
1,321
2013
5,187
-494
866
580
-1,186
-527
4,427
-9,436
-5,009
1,440
-7,996
871
-385
4,429
4,915
1,346
1,321
2,667
2014
6,946
-685
769
345
-1,793
1,811
7,391
8,807
16,199
-1,589
7,218
-1,921
-2,673
-8,619
-13,213
1,397
2,668
4,064
2015
8,217
-716
843
230
-2,383
-2,296
3,895
-193
3,702
267
74
-2,519
-1,745
-1,720
-5,984
-2,015
4,064
2,049
2016
10,292
-1,030
949
206
-3,054
705
8,068
-822
7,246
-1,326
-2,148
-963
-5,025
1,115
-4,872
1,048
2,049
3,097
(INR Million)
2017E
11,685
-1,098
1,058
106
-3,385
-2,071
6,295
-1,401
4,894
-833
-2,234
450
-4,075
-379
-4,004
57
3,097
3,154
2018E
14,358
-1,344
1,157
100
-4,171
-2,298
7,801
-1,000
6,801
-999
-1,999
450
-4,754
-128
-4,432
1,369
3,154
4,523
8 August 2016
9

Marico
Corporate profile
Company description
Exhibit 1: Sensex rebased
Marico Limited is one of India's leading consumer
products companies operating in the beauty and
wellness space. Currently present in 25 countries
across emerging markets of Asia and Africa, Marico
has nurtured multiple brands in the categories of hair
care, skin care, health foods, male grooming, and
fabric care. Marico's India business markets household
brands such as Parachute Advansed, Saffola, Hair &
Care, Nihar, Mediker, Revive, Manjal, Setwet, Zatak
and Livon among others that add value to the life of 1
in every 3 Indians.
Exhibit 2: Shareholding pattern (%)
Jun-16
Promoter
DII
FII
Others
59.7
3.6
28.1
8.7
Mar-16
59.7
5.2
27.8
7.4
Jun-15
59.7
6.5
25.9
7.9
Source: Capitaline
Source: MOSL/Bloomberg
Exhibit 3: Top holders
Holder Name
Arisaig Partners Asia Pte Ltd. A/C Arisaig
India Fund Limited
LIC of India
Natl.Westmaster Bank Pil as Depos.of 1st
Sta.Asia Pac.Lead.Fund A Sub Fund of 1st
Sta.Invtmts.Icvc
Hasham Investment and Trading Co Pvt Ltd
% Holding
5.2
1.7
1.4
1.4
Source: Capitaline
Note: FII Includes depository receipts
Exhibit 4: Top management
Name
Harsh Mariwala
Saugata Gupta
Hemangi Ghag
Designation
Chairman
Managing Director &
CEO
Company Secretary
Exhibit 5: Directors
Name
Harsh Mariwala
Saugata Gupta
Rajen Mariwala
B S Nagesh*
Atul Choksey*
Name
Rajeev Bakshi*
Anand Kripalu*
Nikhil Khattau*
Hema Ravichandar*
Source: Capitaline
*Independent
Exhibit 6: Auditors
Name
Ashwin Solanki & Associates
Ernst & Young LLP
K R Chandratre
Price Waterhouse
Internal
Secretarial Audit
Statutory
Source: Capitaline
Type
Cost Auditor
Exhibit 7: MOSL forecast v/s consensus
EPS
(INR)
FY17
FY18
MOSL
forecast
6.4
7.9
Consensus
forecast
6.6
7.7
Variation
(%)
-3.1
2.4
Source: Bloomberg
8 August 2016
10

Marico
NOTES
8 August 2016
11

Disclosures
This document has been prepared by Motilal Oswal Securities Limited (hereinafter referred to as Most) to provide information about the company (ies) and/sector(s), if any, covered in the report and may be distributed by it and/or
Marico
its affiliated company(ies). This report is for personal information of the selected recipient/s and does not construe to be any investment, legal or taxation advice to you. This research report does not constitute an offer, invitation or
inducement to invest in securities or other investments and Motilal Oswal Securities Limited (hereinafter referred as MOSt) is not soliciting any action based upon it. This report is not for public distribution and has been furnished to
you solely for your general information and should not be reproduced or redistributed to any other person in any form. This report does not constitute a personal recommendation or take into account the particular investment
objectives, financial situations, or needs of individual clients. Before acting on any advice or recommendation in this material, investors should consider whether it is suitable for their particular circumstances and, if necessary, seek
professional advice. The price and value of the investments referred to in this material and the income from them may go down as well as up, and investors may realize losses on any investments. Past performance is not a guide
for future performance, future returns are not guaranteed and a loss of original capital may occur.
MOSt and its affiliates are a full-service, integrated investment banking, investment management, brokerage and financing group. We and our affiliates have investment banking and other business relationships with a some
companies covered by our Research Department. Our research professionals may provide input into our investment banking and other business selection processes. Investors should assume that MOSt and/or its affiliates are
seeking or will seek investment banking or other business from the company or companies that are the subject of this material and that the research professionals who were involved in preparing this material may educate
investors on investments in such business . The research professionals responsible for the preparation of this document may interact with trading desk personnel, sales personnel and other parties for the purpose of gathering,
applying and interpreting information. Our research professionals are paid on twin parameters of performance & profitability of MOSt.
MOSt generally prohibits its analysts, persons reporting to analysts, and members of their households from maintaining a financial interest in the securities or derivatives of any companies that the analysts cover. Additionally,
MOSt generally prohibits its analysts and persons reporting to analysts from serving as an officer, director, or advisory board member of any companies that the analysts cover. Our salespeople, traders, and other professionals or
affiliates may provide oral or written market commentary or trading strategies to our clients that reflect opinions that are contrary to the opinions expressed herein, and our proprietary trading and investing businesses may make
investment decisions that are inconsistent with the recommendations expressed herein. In reviewing these materials, you should be aware that any or all of the foregoing among other things, may give rise to real or potential
conflicts of interest. MOSt and its affiliated company(ies), their directors and employees and their relatives may; (a) from time to time, have a long or short position in, act as principal in, and buy or sell the securities or derivatives
thereof of companies mentioned herein. (b) be engaged in any other transaction involving such securities and earn brokerage or other compensation or act as a market maker in the financial instruments of the company(ies)
discussed herein or act as an advisor or lender/borrower to such company(ies) or may have any other potential conflict of interests with respect to any recommendation and other related information and opinions.; however the
same shall have no bearing whatsoever on the specific recommendations made by the analyst(s), as the recommendations made by the analyst(s) are completely independent of the views of the affiliates of MOSt even though
there might exist an inherent conflict of interest in some of the stocks mentioned in the research report
Reports based on technical and derivative analysis center on studying charts company's price movement, outstanding positions and trading volume, as opposed to focusing on a company's fundamentals and, as such, may not
match with a report on a company's fundamental analysis. In addition MOST has different business segments / Divisions with independent research separated by Chinese walls catering to different set of customers having various
objectives, risk profiles, investment horizon, etc, and therefore may at times have different contrary views on stocks sectors and markets.
Unauthorized disclosure, use, dissemination or copying (either whole or partial) of this information, is prohibited. The person accessing this information specifically agrees to exempt MOSt or any of its affiliates or employees from,
any and all responsibility/liability arising from such misuse and agrees not to hold MOSt or any of its affiliates or employees responsible for any such misuse and further agrees to hold MOSt or any of its affiliates or employees free
and harmless from all losses, costs, damages, expenses that may be suffered by the person accessing this information due to any errors and delays. The information contained herein is based on publicly available data or other
sources believed to be reliable. Any statements contained in this report attributed to a third party represent MOSt’s interpretation of the data, information and/or opinions provided by that third party either publicly or through a
subscription service, and such use and interpretation have not been reviewed by the third party. This Report is not intended to be a complete statement or summary of the securities, markets or developments referred to in the
document. While we would endeavor to update the information herein on reasonable basis, MOSt and/or its affiliates are under no obligation to update the information. Also there may be regulatory, compliance, or other reasons
that may prevent MOSt and/or its affiliates from doing so. MOSt or any of its affiliates or employees shall not be in any way responsible and liable for any loss or damage that may arise to any person from any inadvertent error in
the information contained in this report. MOSt or any of its affiliates or employees do not provide, at any time, any express or implied warranty of any kind, regarding any matter pertaining to this report, including without limitation
the implied warranties of merchantability, fitness for a particular purpose, and non-infringement. The recipients of this report should rely on their own investigations.
This report is intended for distribution to institutional investors. Recipients who are not institutional investors should seek advice of their independent financial advisor prior to taking any investment decision based on this report or
for any necessary explanation of its contents.
Most and it’s associates may have managed or co-managed public offering of securities, may have received compensation for investment banking or merchant banking or brokerage services, may have received any compensation
for products or services other than investment banking or merchant banking or brokerage services from the subject company in the past 12 months.
Most and it’s associates have not received any compensation or other benefits from the subject company or third party in connection with the research report.
Subject Company may have been a client of Most or its associates during twelve months preceding the date of distribution of the research report
MOSt and/or its affiliates and/or employees may have interests/positions, financial or otherwise of over 1 % at the end of the month immediately preceding the date of publication of the research in the securities mentioned in this
report. To enhance transparency, MOSt has incorporated a Disclosure of Interest Statement in this document. This should, however, not be treated as endorsement of the views expressed in the report.
Motilal Oswal Securities Limited is registered as a Research Analyst under SEBI (Research Analyst) Regulations, 2014. SEBI Reg. No. INH000000412
Pending Regulatory inspections against Motilal Oswal Securities Limited:
SEBI pursuant to a complaint from client Shri C.R. Mohanraj alleging unauthorized trading, issued a letter dated 29th April 2014 to MOSL notifying appointment of an Adjudicating Officer as per SEBI regulations to hold inquiry and
adjudge violation of SEBI Regulations; MOSL replied to the Show Cause Notice whereby SEBI granted us an opportunity of Inspection of Documents. Since all the documents requested by us were not covered we have requested
to SEBI vide our letter dated June 23, 2015 to provide pending list of documents for inspection.
List of associate companies of Motilal Oswal Securities Limited -
Click here to access detailed report
Analyst Certification
The views expressed in this research report accurately reflect the personal views of the analyst(s) about the subject securities or issues, and no part of the compensation of the research analyst(s) was, is, or will be directly or
indirectly related to the specific recommendations and views expressed by research analyst(s) in this report. The research analysts, strategists, or research associates principally responsible for preparation of MOSt research
receive compensation based upon various factors, including quality of research, investor client feedback, stock picking, competitive factors and firm revenues
Disclosure of Interest Statement
Analyst ownership of the stock
Served as an officer, director or employee -
MARICO
No
No
A graph of daily closing prices of securities is available at www.nseindia.com and http://economictimes.indiatimes.com/markets/stocks/stock-quotes
Regional Disclosures (outside India)
This report is not directed or intended for distribution to or use by any person or entity resident in a state, country or any jurisdiction, where such distribution, publication, availability or use would be contrary to law, regulation or
which would subject MOSt & its group companies to registration or licensing requirements within such jurisdictions.
For Hong Kong:
This report is distributed in Hong Kong by Motilal Oswal capital Markets (Hong Kong) Private Limited, a licensed corporation (CE AYY-301) licensed and regulated by the Hong Kong Securities and Futures
Commission (SFC) pursuant to the Securities and Futures Ordinance (Chapter 571 of the Laws of Hong Kong) “SFO”. As per SEBI (Research Analyst Regulations) 2014 Motilal Oswal Securities (SEBI Reg No. INH000000412)
has an agreement with Motilal Oswal capital Markets (Hong Kong) Private Limited for distribution of research report in Kong Kong. This report is intended for distribution only to “Professional Investors” as defined in Part I of
Schedule 1 to SFO. Any investment or investment activity to which this document relates is only available to professional investor and will be engaged only with professional investors.” Nothing here is an offer or solicitation of
these securities, products and services in any jurisdiction where their offer or sale is not qualified or exempt from registration. The Indian Analyst(s) who compile this report is/are not located in Hong Kong & are not conducting
Research Analysis in Hong Kong.
For U.S.
Motilal Oswal Securities Limited (MOSL) is not a registered broker - dealer under the U.S. Securities Exchange Act of 1934, as amended (the"1934 act") and under applicable state laws in the United States. In addition MOSL is
not a registered investment adviser under the U.S. Investment Advisers Act of 1940, as amended (the "Advisers Act" and together with the 1934 Act, the "Acts), and under applicable state laws in the United States. Accordingly, in
the absence of specific exemption under the Acts, any brokerage and investment services provided by MOSL, including the products and services described herein are not available to or intended for U.S. persons.
This report is intended for distribution only to "Major Institutional Investors" as defined by Rule 15a-6(b)(4) of the Exchange Act and interpretations thereof by SEC (henceforth referred to as "major institutional investors"). This
document must not be acted on or relied on by persons who are not major institutional investors. Any investment or investment activity to which this document relates is only available to major institutional investors and will be
engaged in only with major institutional investors. In reliance on the exemption from registration provided by Rule 15a-6 of the U.S. Securities Exchange Act of 1934, as amended (the "Exchange Act") and interpretations thereof by
the U.S. Securities and Exchange Commission ("SEC") in order to conduct business with Institutional Investors based in the U.S., MOSL has entered into a chaperoning agreement with a U.S. registered broker-dealer, Motilal
Oswal Securities International Private Limited. ("MOSIPL"). Any business interaction pursuant to this report will have to be executed within the provisions of this chaperoning agreement.
The Research Analysts contributing to the report may not be registered /qualified as research analyst with FINRA. Such research analyst may not be associated persons of the U.S. registered broker-dealer, MOSIPL, and
therefore, may not be subject to NASD rule 2711 and NYSE Rule 472 restrictions on communication with a subject company, public appearances and trading securities held by a research analyst account.
For Singapore
Motilal Oswal Capital Markets Singapore Pte Limited is acting as an exempt financial advisor under section 23(1)(f) of the Financial Advisers Act(FAA) read with regulation 17(1)(d) of the Financial Advisors Regulations and is a
subsidiary of Motilal Oswal Securities Limited in India. This research is distributed in Singapore by Motilal Oswal Capital Markets Singapore Pte Limited and it is only directed in Singapore to accredited investors, as defined in the
Financial Advisers Regulations and the Securities and Futures Act (Chapter 289), as amended from time to time.
In respect of any matter arising from or in connection with the research you could contact the following representatives of Motilal Oswal Capital Markets Singapore Pte Limited:
Varun Kumar
Varun.kumar@motilaloswal.com
Contact : (+65) 68189232
Office Address:21 (Suite 31),16 Collyer Quay,Singapore 04931
Kadambari Balachandran
kadambari.balachandran@motilaloswal.com
(+65) 68189233 / 65249115
8 August 2016
Motilal Oswal Tower, Level 9, Sayani Road, Prabhadevi, Mumbai 400 025
Phone: +91 22 3982 5500 E-mail: reports@motilaloswal.com
Motilal Oswal Securities Ltd
12