Grasim Industries
BSE SENSEX
27,860
S&P CNX
8,592
11 August 2016
1QFY17 Results Update | Sector: Cement
CMP: INR4,539
Under Review
Motilal Oswal values your support in
the Asiamoney Brokers Poll 2016 for
India Research, Sales and Trading
team. We
request your ballot.
Strong realizations and cost moderation boost 1QFY17 results
Bloomberg
Equity Shares (m)
M.Cap.(INR b)/(USD b)
52-Week Range (INR)
1, 6, 12 Rel. Per (%)
12M Avg Val (INR M)
Free float (%)
GRASIM IN
93.3
423.7 / 6.3
5,349 / 3,242
-1/13/22
290
68.7
Financials & Valuations (INR b)
2016
2017E
2018E
Y/E Mar
365.9
408.2
459.6
Net Sales
60.2
79.8
101.5
EBITDA
22.6
35.5
44.1
NP
241.7
380.2
472.4
EPS (INR)
26.8
57.3
24.3
EPS Gr. (%)
BV/Sh. (INR) 2,766.8 3,120.6 3,568.1
9.2
12.9
14.1
RoE (%)
10.0
13.2
15.6
RoCE (%)
18.8
11.9
9.6
Payout (%)
132.3
115.4
113.7
Div. Yield
Estimate change
TP change
Rating change
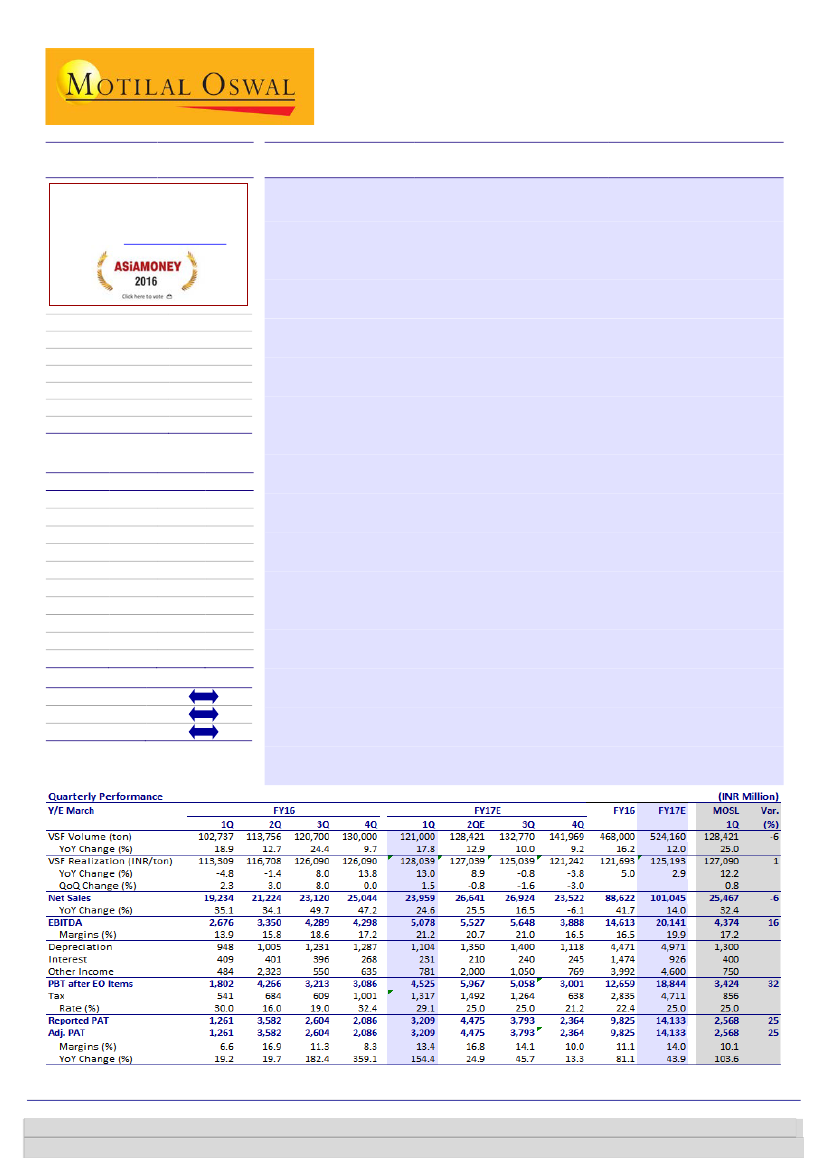
Strong margins led by cost control:
Grasim Industries’ (GRASIM) standalone
1QFY17 EBITDA rose 90% YoY (+18% QoQ) to INR5.1b, translating into margins
of 21.2% (+4pp QoQ, +7.3pp YoY), driven by near-peak utilizations, high pricing
and lower energy costs. Revenues grew 25% YoY to INR24b, while PAT stood at
INR3.2b (2.5x YoY) led by better margins.
VSF – encouraging utilization ramp-up and pricing boost:
VFS revenues grew
32% YoY to INR16.5b (est. of INR17.6b), led by volume growth of 17% YoY (est.
of +25% YoY) and realizations boost of 13% YoY, which translated into (a)
margins of 19% (v/s 11% in 1QFY16) and (b) RoCE of high-teens. Realizations
boost was attributable to uptrend in prices and depreciation of INR. With
commendable ramp-up at the Vilayat plant, overall utilizations stood at 97%.
Healthy demand aids Chemicals business:
Chemicals revenues stood at INR9b
(+18% YoY), with utilization at 100%. Margins improved to 35% from 22% in
1QFY16, led by higher volumes.
Management outlook:
Both VSF and Chemicals businesses are likely to see
improved domestic demand. De-bottlenecking of the Vilayat plant was
completed in 1QFY17, which increased capacity of Chemicals to 8,40,000 tpa
from 8,04,000 tpa. Key medium-term focus areas are: 1) more premium
product mix, (2) expanding domestic reach, (3) additional capex in organic and
inorganic route in right juncture and (4) improvement in cost efficiencies.
Aditya Birla Nuvo-GRASIM merger:
The restructuring will result in the listing of
the merged financial services business, which will be 57% owned by post-
merger GRASIM and the balance by its shareholders on a proportionate basis.
Shareholders will receive three equity shares of GRASIM for every 10 equity
shares of Aditya Birla Nuvo, and seven shares of Aditya Birla Financial Services
for every one equity share of GRASIM.
Valuation and view:
At CMP, GRASIM trades at 11.9x/9.6x FY17/18E EPS,
8.4x/6.3x FY17/18E EV/EBITDA and EV/ton of USD114 (50-55% discount to
UTCEM’s valuation). Considering this proposed merger, we put our rating on
the stock under review.
Investors are advised to refer through important disclosures made at the last page of the Research Report.
Motilal Oswal research is available on www.motilaloswal.com/Institutional-Equities, Bloomberg, Thomson Reuters, Factset and S&P Capital.
Jinesh Gandhi
(Jinesh@MotilalOswal.com); +91 6129 1524
Aashumi Mehta
(Aashumi.Mehta@MotilalOswal.com); +91 22 6129 1537

Grasim Industries
Exhibit 1: Trend in VSF business volumes & realizations
Volumes ('000 Tons)
Realizations (INR/Kg)
36 34
32
Exhibit 2: VSF business EBITDA improved sequentially
VSF EBITDA
39 39
28
26
19
26
22
VSF EBITDA Margins (%)
18 18 19 20
14
10
7
12 11
7
11
15
19
15
19
Source: Company, MOSL
Exhibit 3: VSF business performance
Production (ton)
Sales volume (ton)
Net Turnover (INR M)
Avg Realizations (INR/ton)
PBIDT Margin (%)
PBDIT (INR M)
1QFY17
121,000
121,000
16,541
128,039
19.5
3,220
1QFY16
102,737
102,737
12,541
113,309
11.1
1,390
% YoY
17.8
17.8
31.9
13.0
840bp
131.7
4QFY16
130,000
130,000
17,295
126,090
15.4
2,670
% QoQ
-6.9
-6.9
-4.4
1.5
400bp
20.6
Source: Company, MOSL
Exhibit 4: Snapshot of consolidated performance (INR m)
INR M
Net Sales
EBITDA
EBIDT Margins (%)
Adj.PAT
Adj. EPS (INR)
1QFY17
90,041
19,401
21.5
8,303
89.0
1QFY16
82,756
14,047
17.0
5,566
60.6
% YoY
8.8
38.1
460bp
49.2
46.9
4QFY16
98,964
18,974
19.2
6,961
74.6
% QoQ
-9.0
2.2
240bp
19.3
19.3
Source: Company, MOSL
Grasim and AB nuvo merger
Merger of Aditya Birla Nuvo Limited into Grasim Industries Limited.
Restructuring results in listing ofther financial services business 57% owned by
post-merger Grasim and balance being held by its shareholders (post-merger
Grasim) on a proportionate basis.
Merger will provides shareholders with a well-diversified portfolio of Cement,
Textiles, chemicals, insulators, solar, telecom and financial services.
11 August 2016
2

Grasim Industries
Exhibit 5: Current structure
Exhibit 6: Structure after merger
Source: MOSL, Company
Highlights of management concall
Grasim and AB Nuvo merger:
AB Nuvo has a S/A debt of INR22b and EBITDA of
INR8.7b. Post-merger the net debt of the entity will be INR17b with an EBITDA
of INR32b leading to a net debt/EBITDA of 0.5. The management was clear that
there would be no fund raising for idea.
3 equity shares of Grasim for every 10 equity shares of Aditya Birla Nuvo. 7
shares of Aditya Birla Financial Services for every 1 equity shares of Grasim (post
merger)
Exhibit 7: Capex of ~INR15b and INR 30b in FY17 for S/A business and cement (INR Cr)
11 August 2016
3

Grasim Industries
Exhibit 8: Grasim Operational Results
Y/E MARCH
1Q
VSF
Production (ton)
Volume (ton)
YoY Change (%)
Realisation (INR/ton)
YoY Change (%)
Net Sales (INR M)
YoY Change (%)
PBIDT (INR M)
PBIDT (%)
Chemicals
Production (ton)
Volume (ton)
YoY Change (%)
Realisation (INR/ton)
YoY Change (%)
Net Sales (INR M)
YoY Change (%)
PBIDT (INR M)
PBIDT (%)
102,737
102,737
18.9
113,309
-4.8
12,541
14.6
1,390
11.1
163,055
163,055
69.7
25,850
-6.0
7,671
85.5
1,725
22.5
FY16
2Q
112,263
113,756
12.7
116,708
-1.4
14,370
13.1
2,110
14.7
183,163
183,163
83.1
26,012
1.2
8,201
97.1
1,698
20.7
3Q
4Q
130,000
130,000
9.7
126,090
13.8
17,295
23.1
2,670
15.4
211,000
204,000
94.3
25,970
6.0
9,567
123.3
2,290
23.9
1Q
121,000
121,000
17.8
128,039
13.0
16,541
31.9
3,220
19.5
187,000
187,000
14.7
27,660
7.0
9,035
17.8
2,320
25.7
FY17E
2Q
128,421
128,421
12.9
127,039
8.9
17,611
22.6
2,886
16.4
210,637
210,637
15.0
26,532
2.0
9,471
15.5
2,032
21.5
FY16
3Q
4Q
141,969
141,969
9.2
121,242
-3.8
17,618
1.9
4,897
27.8
228,443
228,443
12.0
25,609
-1.4
9,733
1.7
1,849
19.0
468,000
468,000
16.2
121,693
5.0
60,220
21.1
9,244
15.4
752,218
752,218
84.5
26,012
2.0
34,362
102.0
7,483
21.8
524,160
524,160
12.0
125,193
2.9
69,690
15.7
13,168
18.9
836,160
836,160
11.2
26,532
2.0
37,714
9.8
8,499
22.5
FY17E
126,000
120,700
24.4
126,090
8.0
16,020
33.2
3,080
19.2
195,000
202,000
89.6
25,970
6.0
8,700
96.3
1,770
20.3
132,770
132,770
10.0
125,039
-0.8
17,920
11.9
3,001
16.7
210,080
210,080
4.0
26,532
2.2
9,456
8.7
2,037
21.5
Valuation and view
Market leaders with favorably poised to businesses:
Grasim is market leader in
its operating segments viz. Cement, VSF and Chemical. Its entire segment offers
healthy demand outlook. With significant capacity addition in both businesses
and being low cost producer, Grasim is well placed to capture the growth
resulting in strong earnings growth, cash flow generation and balance sheet
strength.
Capital efficacies to sustain strength:
Both VSF and Chemical segment have
seen strong uptick in RoCEs to 15-18% (6% in FY15) and 19-21% (10-11% in
FY15) respectively. While a part of the improvement is attributable to better VSF
realization (5-8% YoY), more important aspect is 95-100% operating utilization in
both VSF and Chemical segments. This, coupled with revival cement demand,
should lead to consolidation RoCE to 17%/18% in FY17/18E (v/s 13.8% now).
Even in the event of minor moderation in VSF prices (we factor in avg FY17
realization 3% discount to 4QFY16, +2% YoY), we expect with high utilizations to
keep capital efficiencies healthy.
High valuation discount offers attractive play:
Grasim, being the market leader,
is a strong play on improving outlook of all its businesses: UTCEM is out
preferred play on demand recovery in demand due to market leadership, pan
India presence and superior profitability. At CMP, Grasim trades at 11.9/9.6x
FY17/18E EPS, 8.4x/6.3x FY17/18E EV/EBITDA and EV/ton of USD114 (50-55%
discount to UTCEM’s valuation). Considering this proposed merger, we put our
rating on the stock
under review.
11 August 2016
4

Grasim Industries
Exhibit 9: Implied Hold-co discount
CMP
Market Cap
Add: Net Debt
EV
Less: EV of VSF @ 4x EV/EBITDA
Implied EV of Cement
Implied EV/EBITDA (x)
Implied EV/Ton (USD)
Implied Discount to
UltraTech on replacement cost (%)
UltraTech on EV/EBITDA (%)
FY16
4,100
382,809
35,071
417,880
73,066
344,814
13.1
132
30
33
FY17E
4,100
382,809
22,891
405,700
98,157
307,543
9.2
118
36
37
FY18E
4,539
423,761
3,783
427,544
130,019
297,524
6.4
114
44
45
Source: Company, MOSL
11 August 2016
5

Grasim Industries
Financials and Valuations
Title
Chapter
Income Statement
Y/E Mar
Net Sales
Change (%)
EBITDA
EBITDA Margin (%)
Depreciation
EBIT
Interest
Other Income
Extraordinary items
PBT
Tax
Tax Rate (%)
Min. Int. & Assoc. Share
Reported PAT
Adjusted PAT
Change (%)
2011
213,183
6.9
47,635
22.3
11,384
36,251
4,068
9,916
0
42,099
9,542
22.7
6,162
26,395
26,395
-3.5
2011
917
144,668
145,586
67,827
19,616
276,542
228,066
83,749
144,316
13,578
79,185
58,797
27,229
14,346
2,844
14,378
43,524
35,753
7,771
15,273
276,542
2012
249,836
17.2
53,178
21.3
11,544
41,633
3,140
15,852
0
54,345
13,208
24.3
8,840
32,298
32,298
22.4
2012
917
169,768
170,685
70,358
19,790
313,167
245,460
94,933
150,527
24,611
78,758
86,483
30,711
17,288
3,252
35,232
52,176
42,392
9,784
34,307
313,167
2013
276,447
10.7
56,590
20.5
12,521
44,070
3,241
8,841
2,044
51,714
14,672
28.4
9,998
27,044
25,580
-20.8
2013
918
195,648
196,565
95,614
23,013
377,402
283,322
107,804
175,517
60,843
80,108
94,078
37,408
21,863
2,292
32,515
63,240
49,946
13,295
30,837
377,402
2014
290,042
4.9
45,946
15.8
14,575
31,371
4,473
8,964
1,247
37,110
8,595
23.2
7,799
20,715
19,757
-22.8
2014
918
215,226
216,144
96,812
28,033
410,347
352,065
122,379
229,686
30,000
76,108
108,787
42,565
25,092
3,967
37,163
67,003
54,266
12,737
41,784
410,347
2015
324,376
11.8
47,348
14.6
15,632
31,715
6,674
9,487
-95
34,434
10,159
29.5
6,836
17,438
17,505
-11.4
2015
919
230,479
231,398
119,302
34,103
461,620
426,008
138,011
287,997
25,000
72,553
121,964
47,885
26,474
4,617
42,989
78,728
62,765
15,963
43,236
461,620
2016
365,862
12.8
60,198
16.5
17,823
42,375
8,027
8,506
0
42,854
11,658
27.2
8,633
22,563
22,563
28.9
2016
934
257,373
258,307
128,407
42,255
513,814
470,891
155,834
315,057
25,000
76,547
145,884
46,280
31,546
24,247
43,810
82,410
66,698
15,712
63,474
513,814
2017E
408,203
11.6
79,766
19.5
19,045
60,721
(INR Million)
2018E
459,582
12.6
101,547
22.1
19,498
82,048
7,439
11,900
0
86,510
24,396
28.2
18,007
44,107
44,107
24.3
2018E
7,659
11,600
0
64,661
17,406
26.9
11,760
35,495
35,495
57.3
2017E
Balance Sheet
Y/E Mar
Share Capital
Reserves
Net Worth
Debt
Deferred Tax
Total Capital Employed
Gross Fixed Assets
Less: Acc Depreciation
Net Fixed Assets
Capital WIP
Investments
Current Assets
Inventory
Debtors
Cash & Bank
Loans & Adv, Others
Curr Liabs & Provns
Curr. Liabilities
Provisions
Net Current Assets
Total Assets
(INR Million)
934
332,183
333,117
119,756
43,996
611,481
550,891
194,378
356,514
15,000
132,698
163,151
64,341
36,767
6,894
55,150
89,618
72,154
17,464
73,533
611,481
934
290,405
291,339
119,756
43,103
550,803
515,891
174,879
341,012
15,000
99,417
146,953
57,148
32,656
6,123
51,025
85,314
68,578
16,736
61,639
550,803
11 August 2016
6

Grasim Industries
Financials and Valuations
Ratios
Y/E Mar
Basic (INR)
EPS
Book Value
DPS
Payout (incl. Div. Tax.)
Valuation(x)
P/E
Price / Book Value
EV/Sales
EV/EBITDA
EV/Ton (US$)
Dividend Yield (%)
Profitability Ratios (%)
RoE
RoCE
RoIC
Turnover Ratios (%)
Asset Turnover (x)
Debtors (No. of Days)
Leverage Ratios (%)
Net Debt/Equity (x)
Y/E Mar
Adjusted EBITDA
Non cash opr. exp (inc)
(Inc)/Dec in Wkg. Cap.
Tax Paid
Other operating activities
CF from Op. Activity
(Inc)/Dec in FA & CWIP
Free cash flows
(Pur)/Sale of Invt
Others
CF from Inv. Activity
Inc/(Dec) in Net Worth
Inc / (Dec) in Debt
Interest Paid
Divd Paid (incl Tax) & Others
CF from Fin. Activity
Inc/(Dec) in Cash
Add: Opening Balance
Closing Balance
2011
287.8
1587.3
20.0
7.5
2012
352.1
1861.0
22.5
6.7
2013
278.7
2141.5
22.5
8.4
2014
215.1
2353.5
21.0
10.1
2015
190.5
2518.7
18.0
9.7
2016
241.7
2766.8
25.0
11.0
2017E
380.2
3120.6
25.0
6.9
2018E
472.4
3568.1
25.0
5.3
23.8
1.8
2.2
14.8
167.0
0.4
19.5
18.1
16
0.8
25
20.4
19.1
15
0.8
25
13.9
14.2
12
0.7
29
9.6
10.2
8
0.7
32
7.8
8.8
7
0.7
30
18.8
1.6
1.9
10.6
132.3
0.6
9.2
10.0
8
0.7
31
11.9
1.5
1.7
8.4
115.4
0.6
12.9
13.2
11
0.7
29
9.6
1.3
1.5
6.3
113.7
0.6
14.1
15.6
13
0.8
29
0.3
2011
47,635
9,916
-8,311
-9,984
0
39,255
-23,751
15,504
-16,742
0
-40,493
-4,086
11,835
-4,068
-1,970
1,712
474
2,370
2,844
0.3
2012
53,178
15,852
-18,625
-13,033
0
37,371
-28,788
8,583
-347
0
-29,135
-5,016
2,531
-3,140
-2,180
-7,805
431
2,844
3,274
0.4
2013
56,590
8,841
2,509
-11,450
2,044
58,535
-73,743
-15,208
-6,483
0
-80,225
2,458
25,257
-3,241
-2,160
22,313
623
3,252
3,875
0.3
2014
45,946
8,964
-9,272
-3,575
1,247
43,311
-37,901
5,410
1,328
0
-36,573
1,825
1,197
-4,473
-2,003
-3,454
3,284
2,292
5,576
0.4
2015
47,348
9,487
-802
-4,089
595
52,539
-68,943
-16,405
3,489
0
-65,454
-558
22,490
-6,674
-1,694
13,565
650
3,967
4,617
0.3
2016
60,198
8,506
-608
-3,505
0
64,591
-44,883
19,708
-4,896
0
-49,779
6,823
9,105
-8,027
-2,476
5,425
20,237
4,617
24,853
0.3
2017E
79,766
11,600
-16,288
-16,558
0
58,519
-35,000
23,519
-22,870
0
-57,870
1
-8,651
-7,659
-2,463
-18,772
-18,123
24,247
6,124
0.3
2018E
101,547
11,900
-11,124
-23,504
0
78,819
-35,000
43,819
-33,281
0
-68,281
0
0
-7,439
-2,330
-9,768
770
6,123
6,893
Cash Flow Statement
(INR Million)
11 August 2016
7

Grasim Industries
Corporate profile
Company description
Grasim is a diversified company with cement and
VSF being core business, accounting for 65% and
35% of revenues. Its other business includes
chemicals and textiles. Post-acquisition of Jaypee’s
Gujarat plant by UltraTech Cement, it would be in
number one position in the Indian cement industry
with total capacity under control of 70mt.
Source: MOSL/Bloomberg
Exhibit 1: Sensex rebased
Exhibit 2: Shareholding pattern (%)
Jun-16
Promoter
DII
FII
Others
31.3
16.8
22.9
29.0
Mar-16
31.1
17.2
22.8
28.9
Jun-15
25.5
17.6
36.9
20.1
Source: Capitaline
Exhibit 3: Top holders
Holder Name
Citibank N.A. New York NYADR Department
Life Insurance Corporation Of India
Aberdeen Global Indian Equity Limited
Europacific Growth Fund
Aberdeen Emerging Markets Fund
% Holding
8.2
6.7
3.3
1.9
1.8
Source: Capitaline
Note: FII Includes depository receipts
Exhibit 4: Top management
Name
Sushil Agarwal
Designation
Whole Time Director & CFO
Exhibit 5: Directors
Name
Shailendra K Jain
Name
Thomas M Connely
Source: Capitaline
*Independent
Exhibit 6: Auditors
Name
BNP & Associates
Deloitte Haskins & Sells LLP
G P Kapadia & Co
R Nanabhoy & Co
Vidyarthi & Sons
Type
Secretarial Audit
Statutory
Statutory
Cost Auditor
Branch
Source: Capitaline
Exhibit 7: MOSL forecast v/s consensus
EPS
(INR)
FY17
FY18
MOSL
forecast
380.2
472.4
Consensus
forecast
336.2
417.4
Variation (%)
13.1
13.2
Source: Bloomberg
11 August 2016
8

GRASIM INDUSTRIES GALLERY
GRASIM
GRASIM
SECTOR UPDATES

Disclosures
This document has been prepared by Motilal Oswal Securities Limited (hereinafter referred to as Most) to provide information about the company (ies) and/sector(s), if any, covered in the report and may be distributed by it and/or
Grasim Industries
its affiliated company(ies). This report is for personal information of the selected recipient/s and does not construe to be any investment, legal or taxation advice to you. This research report does not constitute an offer, invitation or
inducement to invest in securities or other investments and Motilal Oswal Securities Limited (hereinafter referred as MOSt) is not soliciting any action based upon it. This report is not for public distribution and has been furnished to
you solely for your general information and should not be reproduced or redistributed to any other person in any form. This report does not constitute a personal recommendation or take into account the particular investment
objectives, financial situations, or needs of individual clients. Before acting on any advice or recommendation in this material, investors should consider whether it is suitable for their particular circumstances and, if necessary, seek
professional advice. The price and value of the investments referred to in this material and the income from them may go down as well as up, and investors may realize losses on any investments. Past performance is not a guide
for future performance, future returns are not guaranteed and a loss of original capital may occur.
MOSt and its affiliates are a full-service, integrated investment banking, investment management, brokerage and financing group. We and our affiliates have investment banking and other business relationships with a some
companies covered by our Research Department. Our research professionals may provide input into our investment banking and other business selection processes. Investors should assume that MOSt and/or its affiliates are
seeking or will seek investment banking or other business from the company or companies that are the subject of this material and that the research professionals who were involved in preparing this material may educate
investors on investments in such business . The research professionals responsible for the preparation of this document may interact with trading desk personnel, sales personnel and other parties for the purpose of gathering,
applying and interpreting information. Our research professionals are paid on twin parameters of performance & profitability of MOSt.
MOSt generally prohibits its analysts, persons reporting to analysts, and members of their households from maintaining a financial interest in the securities or derivatives of any companies that the analysts cover. Additionally,
MOSt generally prohibits its analysts and persons reporting to analysts from serving as an officer, director, or advisory board member of any companies that the analysts cover. Our salespeople, traders, and other professionals or
affiliates may provide oral or written market commentary or trading strategies to our clients that reflect opinions that are contrary to the opinions expressed herein, and our proprietary trading and investing businesses may make
investment decisions that are inconsistent with the recommendations expressed herein. In reviewing these materials, you should be aware that any or all of the foregoing among other things, may give rise to real or potential
conflicts of interest. MOSt and its affiliated company(ies), their directors and employees and their relatives may; (a) from time to time, have a long or short position in, act as principal in, and buy or sell the securities or derivatives
thereof of companies mentioned herein. (b) be engaged in any other transaction involving such securities and earn brokerage or other compensation or act as a market maker in the financial instruments of the company(ies)
discussed herein or act as an advisor or lender/borrower to such company(ies) or may have any other potential conflict of interests with respect to any recommendation and other related information and opinions.; however the
same shall have no bearing whatsoever on the specific recommendations made by the analyst(s), as the recommendations made by the analyst(s) are completely independent of the views of the affiliates of MOSt even though
there might exist an inherent conflict of interest in some of the stocks mentioned in the research report
Reports based on technical and derivative analysis center on studying charts company's price movement, outstanding positions and trading volume, as opposed to focusing on a company's fundamentals and, as such, may not
match with a report on a company's fundamental analysis. In addition MOST has different business segments / Divisions with independent research separated by Chinese walls catering to different set of customers having various
objectives, risk profiles, investment horizon, etc, and therefore may at times have different contrary views on stocks sectors and markets.
Unauthorized disclosure, use, dissemination or copying (either whole or partial) of this information, is prohibited. The person accessing this information specifically agrees to exempt MOSt or any of its affiliates or employees from,
any and all responsibility/liability arising from such misuse and agrees not to hold MOSt or any of its affiliates or employees responsible for any such misuse and further agrees to hold MOSt or any of its affiliates or employees free
and harmless from all losses, costs, damages, expenses that may be suffered by the person accessing this information due to any errors and delays. The information contained herein is based on publicly available data or other
sources believed to be reliable. Any statements contained in this report attributed to a third party represent MOSt’s interpretation of the data, information and/or opinions provided by that third party either publicly or through a
subscription service, and such use and interpretation have not been reviewed by the third party. This Report is not intended to be a complete statement or summary of the securities, markets or developments referred to in the
document. While we would endeavor to update the information herein on reasonable basis, MOSt and/or its affiliates are under no obligation to update the information. Also there may be regulatory, compliance, or other reasons
that may prevent MOSt and/or its affiliates from doing so. MOSt or any of its affiliates or employees shall not be in any way responsible and liable for any loss or damage that may arise to any person from any inadvertent error in
the information contained in this report. MOSt or any of its affiliates or employees do not provide, at any time, any express or implied warranty of any kind, regarding any matter pertaining to this report, including without limitation
the implied warranties of merchantability, fitness for a particular purpose, and non-infringement. The recipients of this report should rely on their own investigations.
This report is intended for distribution to institutional investors. Recipients who are not institutional investors should seek advice of their independent financial advisor prior to taking any investment decision based on this report or
for any necessary explanation of its contents.
Most and it’s associates may have managed or co-managed public offering of securities, may have received compensation for investment banking or merchant banking or brokerage services, may have received any compensation
for products or services other than investment banking or merchant banking or brokerage services from the subject company in the past 12 months.
Most and it’s associates have not received any compensation or other benefits from the subject company or third party in connection with the research report.
Subject Company may have been a client of Most or its associates during twelve months preceding the date of distribution of the research report
MOSt and/or its affiliates and/or employees may have interests/positions, financial or otherwise of over 1 % at the end of the month immediately preceding the date of publication of the research in the securities mentioned in this
report. To enhance transparency, MOSt has incorporated a Disclosure of Interest Statement in this document. This should, however, not be treated as endorsement of the views expressed in the report.
Motilal Oswal Securities Limited is registered as a Research Analyst under SEBI (Research Analyst) Regulations, 2014. SEBI Reg. No. INH000000412
Pending Regulatory inspections against Motilal Oswal Securities Limited:
SEBI pursuant to a complaint from client Shri C.R. Mohanraj alleging unauthorized trading, issued a letter dated 29th April 2014 to MOSL notifying appointment of an Adjudicating Officer as per SEBI regulations to hold inquiry and
adjudge violation of SEBI Regulations; MOSL replied to the Show Cause Notice whereby SEBI granted us an opportunity of Inspection of Documents. Since all the documents requested by us were not covered we have requested
to SEBI vide our letter dated June 23, 2015 to provide pending list of documents for inspection.
List of associate companies of Motilal Oswal Securities Limited -
Click here to access detailed report
Analyst Certification
The views expressed in this research report accurately reflect the personal views of the analyst(s) about the subject securities or issues, and no part of the compensation of the research analyst(s) was, is, or will be directly or
indirectly related to the specific recommendations and views expressed by research analyst(s) in this report. The research analysts, strategists, or research associates principally responsible for preparation of MOSt research
receive compensation based upon various factors, including quality of research, investor client feedback, stock picking, competitive factors and firm revenues
Disclosure of Interest Statement
Analyst ownership of the stock
Served as an officer, director or employee -
GRASIM INDUSTRIES
No
No
A graph of daily closing prices of securities is available at www.nseindia.com and http://economictimes.indiatimes.com/markets/stocks/stock-quotes
Regional Disclosures (outside India)
This report is not directed or intended for distribution to or use by any person or entity resident in a state, country or any jurisdiction, where such distribution, publication, availability or use would be contrary to law, regulation or
which would subject MOSt & its group companies to registration or licensing requirements within such jurisdictions.
For Hong Kong:
This report is distributed in Hong Kong by Motilal Oswal capital Markets (Hong Kong) Private Limited, a licensed corporation (CE AYY-301) licensed and regulated by the Hong Kong Securities and Futures
Commission (SFC) pursuant to the Securities and Futures Ordinance (Chapter 571 of the Laws of Hong Kong) “SFO”. As per SEBI (Research Analyst Regulations) 2014 Motilal Oswal Securities (SEBI Reg No. INH000000412)
has an agreement with Motilal Oswal capital Markets (Hong Kong) Private Limited for distribution of research report in Kong Kong. This report is intended for distribution only to “Professional Investors” as defined in Part I of
Schedule 1 to SFO. Any investment or investment activity to which this document relates is only available to professional investor and will be engaged only with professional investors.” Nothing here is an offer or solicitation of
these securities, products and services in any jurisdiction where their offer or sale is not qualified or exempt from registration. The Indian Analyst(s) who compile this report is/are not located in Hong Kong & are not conducting
Research Analysis in Hong Kong.
For U.S.
Motilal Oswal Securities Limited (MOSL) is not a registered broker - dealer under the U.S. Securities Exchange Act of 1934, as amended (the"1934 act") and under applicable state laws in the United States. In addition MOSL is
not a registered investment adviser under the U.S. Investment Advisers Act of 1940, as amended (the "Advisers Act" and together with the 1934 Act, the "Acts), and under applicable state laws in the United States. Accordingly, in
the absence of specific exemption under the Acts, any brokerage and investment services provided by MOSL, including the products and services described herein are not available to or intended for U.S. persons.
This report is intended for distribution only to "Major Institutional Investors" as defined by Rule 15a-6(b)(4) of the Exchange Act and interpretations thereof by SEC (henceforth referred to as "major institutional investors"). This
document must not be acted on or relied on by persons who are not major institutional investors. Any investment or investment activity to which this document relates is only available to major institutional investors and will be
engaged in only with major institutional investors. In reliance on the exemption from registration provided by Rule 15a-6 of the U.S. Securities Exchange Act of 1934, as amended (the "Exchange Act") and interpretations thereof by
the U.S. Securities and Exchange Commission ("SEC") in order to conduct business with Institutional Investors based in the U.S., MOSL has entered into a chaperoning agreement with a U.S. registered broker-dealer, Motilal
Oswal Securities International Private Limited. ("MOSIPL"). Any business interaction pursuant to this report will have to be executed within the provisions of this chaperoning agreement.
The Research Analysts contributing to the report may not be registered /qualified as research analyst with FINRA. Such research analyst may not be associated persons of the U.S. registered broker-dealer, MOSIPL, and
therefore, may not be subject to NASD rule 2711 and NYSE Rule 472 restrictions on communication with a subject company, public appearances and trading securities held by a research analyst account.
For Singapore
Motilal Oswal Capital Markets Singapore Pte Limited is acting as an exempt financial advisor under section 23(1)(f) of the Financial Advisers Act(FAA) read with regulation 17(1)(d) of the Financial Advisors Regulations and is a
subsidiary of Motilal Oswal Securities Limited in India. This research is distributed in Singapore by Motilal Oswal Capital Markets Singapore Pte Limited and it is only directed in Singapore to accredited investors, as defined in the
Financial Advisers Regulations and the Securities and Futures Act (Chapter 289), as amended from time to time.
In respect of any matter arising from or in connection with the research you could contact the following representatives of Motilal Oswal Capital Markets Singapore Pte Limited:
Varun Kumar
Varun.kumar@motilaloswal.com
Contact : (+65) 68189232
Office Address:21 (Suite 31),16 Collyer Quay,Singapore 04931
Kadambari Balachandran
kadambari.balachandran@motilaloswal.com
(+65) 68189233 / 65249115
11 August 2016
Motilal Oswal Tower, Level 9, Sayani Road, Prabhadevi, Mumbai 400 025
Phone: +91 22 3982 5500 E-mail: reports@motilaloswal.com
Motilal Oswal Securities Ltd
10