Manpasand Bev erages
BSE SENSEX
27,860
S&P CNX
8,592
11 August 2016
1QFY17 Results Update | Sector: Others
CMP: INR678
TP: INR850 (+25%)
Buy
Motilal Oswal values your support in
the Asiamoney Brokers Poll 2016 for
India Research, Sales and Trading
team. We
request your ballot.
Bloomberg
Equity Shares (m)
M.Cap.(INR b)/(USD b)
52-Week Range (INR)
1, 6, 12 Rel. Per (%)
12M Avg Val (INR m)
Free float (%)
MANB IN
50.1
34.0/ 0.5
743 / 369
7/41/62
40
49.6
Financials & Valuations (INR b)
Y/E Mar
2016 2017E 2018E
Sales
5.6
8.5
13.0
EBITDA
1.1
1.7
2.6
NP
0.5
0.9
1.4
EPS (INR)
10.1
17.1
28.3
EPS Gr. (%)
26.7
69.1
65.8
BV/Sh. (INR)
120.2 135.6 161.1
RoE (%)
11.4
11.9
17.0
RoCE (%)
12.2
13.4
19.1
P/E (x)
67.1
39.7
23.9
P/BV (x)
5.6
5.0
4.2
Estimate change
TP change
Rating change
Stellar growth, focus on branding through advertisements
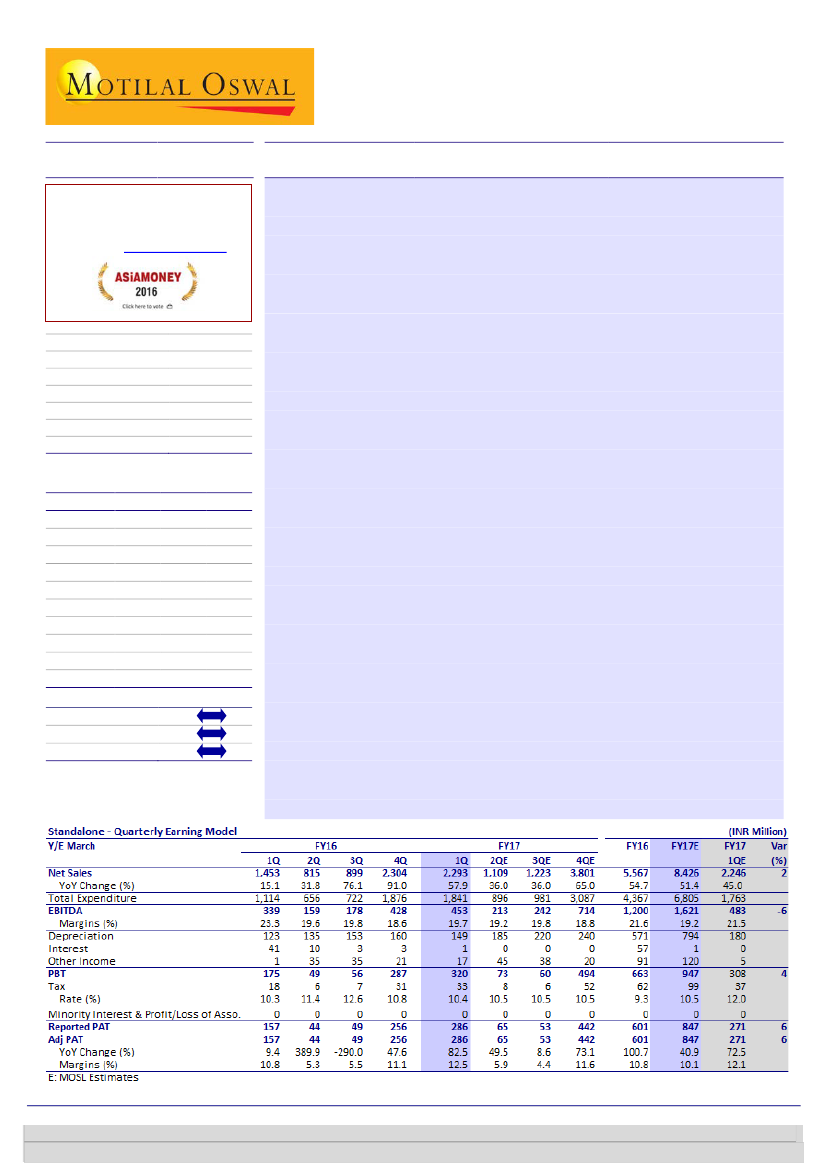
Revenue in line, but EBITDA margins below estimates:
Manpasand Beverages’
(MANB) 1QFY17 revenues grew a stellar 58% YoY to INR2,293m (est. of
INR2,246m) (revenue net of excise duty). Revenue of Mango SIP grew 47% YoY,
while that of Fruits Up grew a robust 120% YoY. Revenue mix for Mango SIP,
Fruits Up and others (incl. ORS and Coco SIP) stood at 77:22:1 v/s 84:16:0 in
1QFY16. Revenues also included contribution of ~INR120m from Modern
Trade, which was absent in the base quarter. EBITDA margin declined 360bp to
19.7% from 23.3% in 1QFY16 due to higher other expenses. EBITDA grew 33.5%
YoY to INR453m. However, due to lower interest expense (INR1m v/s INR41m
in 1QFY16) and higher other income (INR17m v/s INR1m in 1QFY16), adj. PAT
grew robustly by 82% YoY to INR286m (est. of INR271m) in 1QFY17.
Focus on branding and advertisement:
The company more than trebled
spending on advertisements (across TV commercials, radio, wall paintings and
billboards) to INR180m v/s INR50m in 1QFY16. As a result, other expenses (as
% of sales) increased 360bp to 15.1%, which led to EBITDA margin decline of
360bp to 19.7%. The company aims to follow up with another round of
aggressive adspend in 4QFY17.
Coco SIP soft launched in few markets:
MANB soft launched Coco SIP in
Mumbai and some parts of Gujarat in 1QFY17, which was well received by
consumers. However, the company has taken cognizance of some complaints
that the taste of the product differed from across batches due to the usage of
naturally processed coconut water. In this view, MANB is reworking on bringing
uniformity in taste across batches.
Valuation and view:
We believe MANB is on the cusp of a high-growth cycle
due to its capacity expansion, new product launches and increase in
distribution network, which should lead to market share gains from 5% in 2016
to 7.5% in 2018. The launch of Fruits Up and Coco SIP brands is expected to
help tackle seasonality issue and ramp up capacity utilization, thereby driving
margins. We expect sales and PAT CAGR of 53% and 67%, respectively, over
FY16-18E. The stock trades at a P/E of 40x/24x FY17/18E EPS. At a P/E of 30x
FY18 EPS, we value the stock at a target price of INR850 (25% upside) and
maintain our
Buy
rating.
Niket Shah
(Niket.Shah@MotilalOswal.com); +91 22 6129 1535
Chintan Modi
(Chintan.Modi@MotilalOswal.com); +912239825422
Investors are advised to refer through important disclosures made at the last page of the Research Report.
Motilal Oswal research is available on www.motilaloswal.com/Institutional-Equities, Bloomberg, Thomson Reuters, Factset and S&P Capital.

Manpasand Bev erages
Exhibit 1: Revenue trend
Revenue (INR mn)
Growth %
76%
1,453
1,262
619
511
1,207
15%
32%
815
899
2,304
2,293
91%
58%
Source: Company, MOSL
Exhibit 2: EBITDA margins remain stable at ~20%
EBITDA (INR mn)
19%
11%
240
70
10%
53
277
339
159
178
428
453
23%
23%
20%
Margin %
20%
19%
20%
Exhibit 3: PAT trend
PAT (INR mn)
Growth %
286
82%
48%
256
144
9
-26
173
157
44
49
Source: Company, MOSL
Exhibit 4: Revenue mix in 1QFY17
Exhibit 5: Revenue mix in 1QFY16
1
22
Mango SIP
Fruits Up
Other
77
16
Mango SIP
Fruits Up
Other
84
Source: Company, MOSL
11 August 2016
2

Manpasand Bev erages
Valuation and view
We value MANB at PE of 30x FY18E EPS with a target price of INR850, justified by:
Compelling story of India’s booming consumer spends and beverages market.
MANB is expected to improve in market share from 5% in 2016 to 7.5% in 2018
in INR 132bn fruit juice market.
Low penetration of 30% and per capita annual consumption of soft drinks in
India at 16 liters v/s 166 in the US, provide significant market opportunities for
growth.
MANB has planned to increase its capacity by 92% over FY16–18 (85% increase
for fruit drinks and 271% for carbonated fruit drinks) which should drive growth
by reducing supply side constraints.
MANB expanded the product portfolio by launching Fruits Up (Carbonated and
non-carbonated) in FY15 which now contributes 19% to revenues in FY16. It
recently launched natural coconut water under brand Coco Sip.
It has 200,000 retailers, 2,000 distributors, 200+ super stockists, and plans to
add 500–1000 distributors in the medium term with a special focus on south
India.
Focus on urban areas through Fruits Up, increase in distributors (50% additions
in the medium term), and modern trade and on-trade tie-ups would strengthen
presence in urban areas, thereby enabling MANB to be a pan-India player.
The company’s three-pronged strategy: (i) increase available capacity; and (ii)
enhance penetration and distribution in its present 24 states, sets the stage for
a multi-year growth story (iii) Launch of new products.
We believe, margins will remain resilient at 20% as the contribution of high
margin Fruits Up business will increase from 19% in FY16 to 33% in FY18E.
Additionally, company has also recently increased prices of its products to
neutralize the impact of increase in raw material prices and inspite of it the
company continues to face stock out situation at many instances. This also
signifies pricing power and company will be in a situation to pass on any further
increase in raw material prices.
The RoIC for the company will increase from 18% in FY16 to 24% in FY18E which
has further scope of expansion as the capacities will get fully utilized over next
3-4 years as the contribution of Fruits Up will increase. Higher contribution from
Fruits Up over a period of time will help to reduce the seasonality attached to
utilization. Over FY16-18E, utilization will increase from 55% to 58% on an
increased capacity from 125,000 cases per day to 240,000 cases per day over
FY16-18.
We expect sales and PAT CAGR of 53% and 67% respectively over FY16-18
translating into improvement of post tax ROIC/ ROE from 18%/11% in FY16 to
24%/17% respectively in FY18. At current levels, the stock trades at PE of
40x/24x FY17/18E EPS. We value the stock at PE of 30x FY18 EPS of INR28.3
which is justified based on low PEG ratio of 0.4x compared average PEG ratio of
1.6x of peer companies, debt free status and strong CFO generation of
INR1.4b/1.8b in FY17/18. We maintain a
‘Buy’
recommendation with a price
target of INR850, implying 25% upside from current levels.
11 August 2016
3

Manpasand Bev erages
Story in charts
Exhibit
6:
Revenues to post 53% CAGR over FY16–18E
Revenues (INR m)
180.0%
12
19
29
34
Growth (%)
Exhibit
7:
Fruits Up contribution to increase to 34%
Mango SIP
Fruits up
54.7%
22.7%
857
FY12
2,398
FY13
2,943
FY14
22.2%
3,598
FY15
5,567
FY16
51.8%
8,453
FY17E
53.3%
12,963
FY18E
100
100
100
88
81
71
66
FY12
FY13
FY14
FY15
FY16
FY17E
FY18E
Source: MOSL, Company
Exhibit
8:
Margins to remain stable
EBITDA (INR m)
17.8%
Margins (%)
19.8%
19.7%
20.0%
Exhibit
9:
PAT to post 67% CAGR over FY16–18E
PAT (INR m)
268.1%
Growth (%)
16.3%
16.1%
15.5%
46.2%
140
FY12
387
FY13
457
FY14
641
FY15
1,104
FY16
1,665
FY17E
2,593
FY18E
61
FY12
224
FY13
-8.5%
205
FY14
300
FY15
68.8%
506
FY16
69.1%
855
FY17E
65.8%
1,418
FY18E
Source: MOSL, Company
Exhibit
10:
Utilizations to grow on expanded capacities
Capacity (cases/day,'000)
Utilisation (%)
58%
57%
55%
55%
Exhibit
11:
RoCE to gradually improve to 19%
RoCE
24.3%
20.5%
18.2%
16.5%
12.2%
13.4%
19.1%
72.5
FY15
125
FY16
177.5
FY17E
240
FY18E
FY12
FY13
FY14
FY15
FY16
FY17E
FY18E
Source: MOSL, Company
11 August 2016
4

Manpasand Bev erages
Exhibit
12:
Key assumptions (INR m)
FY12
Installed Capacity cases per day
Tetra Pak Case - Fruit Drinks
Pet Bottle Case - Fruit Drinks
Pet Bottle Case - Carbonates
Total
Revenues Gross (INR m)
Fruit Drinks
Carbonates
Others
Revenue Growth (%)
Fruit Drinks
Carbonates
12,000
12,000
-
24000
857
857
-
-
19,750
15,250
-
35000
2,396
2,345
-
52
180%
174%
26,667
30,000
-
56667
2,932
2,850
-
81
22%
22%
30,000
32,500
10,000
72500
3,597
3,332
113
153
23%
17%
40,000
67,500
17,500
125,000
5,567
5,233
334
0
55%
57%
196%
50,000
85,000
42,500
177,500
8,622
7,503
968
150
55%
43%
190%
50,000
125,000
65,000
240,000
13,221
11,040
1,681
500
53%
47%
74%
FY13
FY14
FY15
FY16
FY17E
FY18E
Source: Company, MOSL
11 August 2016
5

Manpasand Bev erages
Financials and Valuations
Standalone - Income Statement
Y/E March
Total Income from Operations
Change (%)
EBITDA
Margin (%)
Depreciation
EBIT
Int. and Finance Charges
Other Income
PBT bef. EO Exp.
EO Items
PBT after EO Exp.
Current Tax
Deferred Tax
Tax Rate (%)
Reported PAT
Adjusted PAT
Change (%)
Margin (%)
FY12
857
140
16.3
46
94
30
4
68
0
68
7
0
10.7
61
61
7.1
FY13
2,398
180.0
387
16.1
102
286
43
3
246
0
246
25
-2
9.1
224
224
268.1
9.3
FY14
2,943
22.7
457
15.5
149
308
77
1
231
0
231
24
2
11.5
205
205
-8.5
7.0
FY15
3,598
22.2
641
17.8
205
436
107
4
334
0
334
36
-2
10.2
300
300
46.2
8.3
FY16
5,567
54.7
1,104
19.8
571
533
57
91
567
0
567
62
0
10.9
506
506
68.8
9.1
FY17E
8,453
51.8
1,665
19.7
805
860
0
100
961
0
961
106
0
11.0
855
855
69.1
10.1
(INR Million)
FY18E
12,963
53.3
2,593
20.0
1,115
1,477
0
115
1,593
0
1,593
175
0
11.0
1,418
1,418
65.8
10.9
Standalone - Balance Sheet
Y/E March
Equity Share Capital
Total Reserves
Net Worth
Deferred Tax Liabilities
Total Loans
Capital Employed
Gross Block
Less: Accum. Deprn.
Net Fixed Assets
Capital WIP
Total Investments
Curr. Assets, Loans&Adv.
Inventory
Account Receivables
Cash and Bank Balance
Loans and Advances
Curr. Liability & Prov.
Account Payables
Other Current Liabilities
Provisions
Net Current Assets
Deferred Tax assets
Appl. of Funds
E: MOSL Estimates
FY12
25
502
536
1
318
855
399
0
399
0
60
528
160
204
41
123
133
79
38
16
395
1
855
FY13
25
722
756
0
548
1,304
927
0
927
0
2
707
207
326
56
118
334
184
95
56
373
2
1,304
FY14
25
923
957
1
743
1,701
1,213
294
919
0
2
1,036
416
478
47
95
257
176
56
26
779
1
1,701
FY15
376
1,534
1,909
0
1,179
3,088
1,345
499
847
1,316
0
1,341
424
593
43
280
417
225
95
98
924
1
3,088
FY16
501
5,515
6,016
0
0
6,016
3,573
1,070
2,503
1,520
6
2,579
704
677
928
270
593
450
130
13
1,986
1
6,016
FY17E
501
6,285
6,785
0
0
6,785
5,373
1,875
3,498
1,200
6
3,166
1,116
857
855
338
1,086
707
254
126
2,080
1
6,785
(INR Million)
FY18E
501
7,560
8,061
0
0
8,061
7,373
2,990
4,383
1,200
6
4,179
1,733
1,243
685
519
1,709
1,137
389
183
2,471
1
8,061
11 August 2016
6

Manpasand Bev erages
Financials and Valuations
Ratios
Y/E March
Basic (INR)
EPS
Cash EPS
BV/Share
DPS
Payout (%)
Valuation (x)
P/E
P/BV
EV/Sales
EV/EBITDA
Dividend Yield (%)
FCF per share
Return Ratios (%)
RoE
RoCE
RoIC
Working Capital Ratios
Asset Turnover (x)
Inventory (Days)
Debtor (Days)
Creditor (Days)
Working Cap. Turnover (Days)
Leverage Ratio (x)
Debt/Equity
FY12
1.6
2.8
14.3
0.0
0.0
FY13
6.0
8.7
20.1
0.1
1.7
FY14
5.5
9.4
25.5
0.1
1.9
FY15
8.0
13.4
50.8
1.3
19.7
85.0
13.3
7.4
41.5
0.2
-28.2
20.3
20.5
22.3
1.0
68
86
34
151
0.6
FY12
68
46
27
-3
-279
-142
2
-140
-521
-660
-60
4
-577
475
318
-30
0
-29
734
18
23
41
31.5
24.3
26.0
1.8
32
49
28
48
0.7
FY13
247
102
40
-61
-13
314
5
319
-553
-234
60
1
-492
0
230
-43
0
0
187
15
41
56
21.2
18.2
18.8
1.7
52
58
22
91
0.8
FY14
232
149
77
-28
-412
17
6
23
-147
-124
0
1
-146
0
195
-77
0
-4
114
-9
56
47
18.8
16.5
23.2
1.2
43
59
23
89
0.6
FY15
333
205
102
-55
-65
521
6
527
-1,586
-1,059
0
4
-1,582
263
436
-101
-4
458
1,051
-4
47
43
FY16
10.1
21.5
120.2
1.0
9.9
67.1
5.6
5.9
29.9
0.1
-38.3
11.4
12.2
18.0
0.9
46
44
30
69
0.0
FY16
567
571
-34
-62
-177
865
-349
516
-2,431
-1,915
-6
91
-2,346
4,000
-1,179
-57
-50
0
2,714
884
43
927
FY17E
17.1
33.2
135.6
1.7
10.0
39.7
5.0
3.9
19.9
0.3
-1.7
11.9
13.4
18.5
1.2
48
36
31
53
0.0
FY17E
961
805
-100
-106
-167
1,393
0
1,393
-1,480
-87
0
100
-1,380
0
0
0
-85
0
-85
-72
927
855
FY18E
28.3
50.6
161.1
2.8
10.0
23.9
4.2
2.6
12.8
0.4
-2.9
17.0
19.1
24.1
1.6
49
34
32
50
0.0
Standalone - Cash Flow Statement
Y/E March
OP/(Loss) before Tax
Depreciation
Interest & Finance Charges
Direct Taxes Paid
(Inc)/Dec in WC
CF from Operations
Others
CF from Operating incl EO
(Inc)/Dec in FA
Free Cash Flow
(Pur)/Sale of Investments
Others
CF from Investments
Issue of Shares
Inc/(Dec) in Debt
Interest Paid
Dividend Paid
Others
CF from Fin. Activity
Inc/Dec of Cash
Opening Balance
Closing Balance
(INR Million)
FY18E
1,593
1,115
-115
-175
-561
1,856
0
1,856
-2,000
-144
0
115
-1,885
0
0
0
-142
0
-142
-170
855
685
11 August 2016
7

Manpasand Bev erages
Corporate profile
Company description
MANB has the unique distinction of being the sole
listed company in the beverages sector. MANB
primarily focuses on mango-based drinks. Mango
Sip, launched in 1997, is the company’s flagship
product, contributing 80% to revenues in FY16 (97%
in FY14). Mango Sip is strategically focused on semi-
urban and rural markets; MANB derives ~55% of
revenues from rural areas, 20–22% through railways
and the remaining from urban areas.
Source: MOSL/Bloomberg
Exhibit 1: Sensex rebased
Exhibit 2: Shareholding pattern (%)
Promoter
DII
FII
Others
Jun-16
50.4
38.5
6.0
5.1
Mar-16
50.4
40.0
6.1
3.5
Jun-15
50.4
14.0
7.9
27.7
Exhibit 3: Top holders
Holder Name
Saif Partners India Iv Limited
SBI Magnum Multiplier Fund
ICICI Prudential Value Fund - Series 6
Goldman Sachs India Fund Limited
Aditya Birla Private Equity Sunrise Fund
Bnp Paribas Equity Fund
% Holding
22.4
6.6
4.0
2.6
2.2
1.9
Source: Capitaline
Note: FII Includes depository receipts
Source: Capitaline
Exhibit 4: Top management
Name
Dhirendra Singh
Abhishek Singh
Bhavesh Jingar
Designation
Chairman & Managing Director
Whole-time Director
Company Secretary
Exhibit 5: Directors
Name
Dhirendra Singh
Bharatkumar Vyas*
Bharti Naik*
Chirag Doshi*
Name
Milindkumar Babar*
Vishal Sood
Abhishek Singh
Source: Capitaline
*Independent
Exhibit 6: Auditors
Name
Deloitte Haskins & Sells
Niraj Trivedi
Sharp & Tannan Associates
Type
Statutory
Secretarial Audit
Internal
Exhibit 7: MOSL forecast v/s consensus
EPS
(INR)
FY17
FY18
MOSL
forecast
17.1
28.3
Consensus
forecast
-
-
Variation
(%)
-
-
Source: Bloomberg
Source: Capitaline
11 August 2016
8

Manpasand Bev erages
NOTES
11 August 2016
9

Disclosures
This document has been prepared by Motilal Oswal Securities Limited (hereinafter referred to as Most) to provide information about the company (ies) and/sector(s), if any, covered in the report and may be distributed by it and/or its
Manpasand Bev erages
affiliated company(ies). This report is for personal information of the selected recipient/s and does not construe to be any investment, legal or taxation advice to you. This research report does not constitute an offer, invitation or
inducement to invest in securities or other investments and Motilal Oswal Securities Limited (hereinafter referred as MOSt) is not soliciting any action based upon it. This report is not for public distribution and has been furnished to
you solely for your general information and should not be reproduced or redistributed to any other person in any form. This report does not constitute a personal recommendation or take into account the particular investment
objectives, financial situations, or needs of individual clients. Before acting on any advice or recommendation in this material, investors should consider whether it is suitable for their particular circumstances and, if necessary, seek
professional advice. The price and value of the investments referred to in this material and the income from them may go down as well as up, and investors may realize losses on any investments. Past performance is not a guide for
future performance, future returns are not guaranteed and a loss of original capital may occur.
MOSt and its affiliates are a full-service, integrated investment banking, investment management, brokerage and financing group. We and our affiliates have investment banking and other business relationships with a some
companies covered by our Research Department. Our research professionals may provide input into our investment banking and other business selection processes. Investors should assume that MOSt and/or its affiliates are
seeking or will seek investment banking or other business from the company or companies that are the subject of this material and that the research professionals who were involved in preparing this material may educate investors
on investments in such business . The research professionals responsible for the preparation of this document may interact with trading desk personnel, sales personnel and other parties for the purpose of gathering, applying and
interpreting information. Our research professionals are paid on twin parameters of performance & profitability of MOSt.
MOSt generally prohibits its analysts, persons reporting to analysts, and members of their households from maintaining a financial interest in the securities or derivatives of any companies that the analysts cover. Additionally, MOSt
generally prohibits its analysts and persons reporting to analysts from serving as an officer, director, or advisory board member of any companies that the analysts cover. Our salespeople, traders, and other professionals or affiliates
may provide oral or written market commentary or trading strategies to our clients that reflect opinions that are contrary to the opinions expressed herein, and our proprietary trading and investing businesses may make investment
decisions that are inconsistent with the recommendations expressed herein. In reviewing these materials, you should be aware that any or all of the foregoing among other things, may give rise to real or potential conflicts of interest.
MOSt and its affiliated company(ies), their directors and employees and their relatives may; (a) from time to time, have a long or short position in, act as principal in, and buy or sell the securities or derivatives thereof of companies
mentioned herein. (b) be engaged in any other transaction involving such securities and earn brokerage or other compensation or act as a market maker in the financial instruments of the company(ies) discussed herein or act as an
advisor or lender/borrower to such company(ies) or may have any other potential conflict of interests with respect to any recommendation and other related information and opinions.; however the same shall have no bearing
whatsoever on the specific recommendations made by the analyst(s), as the recommendations made by the analyst(s) are completely independent of the views of the affiliates of MOSt even though there might exist an inherent
conflict of interest in some of the stocks mentioned in the research report Reports based on technical and derivative analysis center on studying charts company's price movement, outstanding positions and trading volume, as
opposed to focusing on a company's fundamentals and, as such, may not match with a report on a company's fundamental analysis. In addition MOST has different business segments / Divisions with independent research
separated by Chinese walls catering to different set of customers having various objectives, risk profiles, investment horizon, etc, and therefore may at times have different contrary views on stocks sectors and markets.
Unauthorized disclosure, use, dissemination or copying (either whole or partial) of this information, is prohibited. The person accessing this information specifically agrees to exempt MOSt or any of its affiliates or employees from,
any and all responsibility/liability arising from such misuse and agrees not to hold MOSt or any of its affiliates or employees responsible for any such misuse and further agrees to hold MOSt or any of its affiliates or employees free
and harmless from all losses, costs, damages, expenses that may be suffered by the person accessing this information due to any errors and delays. The information contained herein is based on publicly available data or other
sources believed to be reliable. Any statements contained in this report attributed to a third party represent MOSt’s interpretation of the data, information and/or opinions provided by that third party either publicly or through a
subscription service, and such use and interpretation have not been reviewed by the third party. This Report is not intended to be a complete statement or summary of the securities, markets or developments referred to in the
document. While we would endeavor to update the information herein on reasonable basis, MOSt and/or its affiliates are under no obligation to update the information. Also there may be regulatory, compliance, or other reasons that
may prevent MOSt and/or its affiliates from doing so. MOSt or any of its affiliates or employees shall not be in any way responsible and liable for any loss or damage that may arise to any person from any inadvertent error in the
information contained in this report. MOSt or any of its affiliates or employees do not provide, at any time, any express or implied warranty of any kind, regarding any matter pertaining to this report, including without limitation the
implied warranties of merchantability, fitness for a particular purpose, and non-infringement. The recipients of this report should rely on their own investigations.
This report is intended for distribution to institutional investors. Recipients who are not institutional investors should seek advice of their independent financial advisor prior to taking any investment decision based on this report or for
any necessary explanation of its contents.
Most and it’s associates may have managed or co-managed public offering of securities, may have received compensation for investment banking or merchant banking or brokerage services, may have received any compensation
for products or services other than investment banking or merchant banking or brokerage services from the subject company in the past 12 months.
Most and it’s associates have not received any compensation or other benefits from the subject company or third party in connection with the research report.
Subject Company may have been a client of Most or its associates during twelve months preceding the date of distribution of the research report
MOSt and/or its affiliates and/or employees may have interests/positions, financial or otherwise of over 1 % at the end of the month immediately preceding the date of publication of the research in the securities mentioned in this
report. To enhance transparency, MOSt has incorporated a Disclosure of Interest Statement in this document. This should, however, not be treated as endorsement of the views expressed in the report.
Motilal Oswal Securities Limited is registered as a Research Analyst under SEBI (Research Analyst) Regulations, 2014. SEBI Reg. No. INH000000412
Pending Regulatory inspections against Motilal Oswal Securities Limited:
SEBI pursuant to a complaint from client Shri C.R. Mohanraj alleging unauthorized trading, issued a letter dated 29th April 2014 to MOSL notifying appointment of an Adjudicating Officer as per SEBI regulations to hold inquiry and
adjudge violation of SEBI Regulations; MOSL replied to the Show Cause Notice whereby SEBI granted us an opportunity of Inspection of Documents. Since all the documents requested by us were not covered we have requested to
SEBI vide our letter dated June 23, 2015 to provide pending list of documents for inspection.
List of associate companies of Motilal Oswal Securities Limited -Click
here to access detailed report
Analyst Certification
The views expressed in this research report accurately reflect the personal views of the analyst(s) about the subject securities or issues, and no part of the compensation of the research analyst(s) was, is, or will be directly or
indirectly related to the specific recommendations and views expressed by research analyst(s) in this report. The research analysts, strategists, or research associates principally responsible for preparation of MOSt research receive
compensation based upon various factors, including quality of research, investor client feedback, stock picking, competitive factors and firm revenues
Disclosure of Interest Statement
Analyst ownership of the stock
Served as an officer, director or employee
MANPASAND BEVERAGES
No
No
A graph of daily closing prices of securities is available at www.nseindia.com and http://economictimes.indiatimes.com/markets/stocks/stock-quotes
Regional Disclosures (outside India)
This report is not directed or intended for distribution to or use by any person or entity resident in a state, country or any jurisdiction, where such distribution, publication, availability or use would be contrary to law, regulation or which
would subject MOSt & its group companies to registration or licensing requirements within such jurisdictions.
For Hong Kong:
This report is distributed in Hong Kong by Motilal Oswal capital Markets (Hong Kong) Private Limited, a licensed corporation (CE AYY-301) licensed and regulated by the Hong Kong Securities and Futures
Commission (SFC) pursuant to the Securities and Futures Ordinance (Chapter 571 of the Laws of Hong Kong) “SFO”. As per SEBI (Research Analyst Regulations) 2014 Motilal Oswal Securities (SEBI Reg No. INH000000412) has
an agreement with Motilal Oswal capital Markets (Hong Kong) Private Limited for distribution of research report in Kong Kong. This report is intended for distribution only to “Professional Investors” as defined in Part I of Schedule 1 to
SFO. Any investment or investment activity to which this document relates is only available to professional investor and will be engaged only with professional investors.” Nothing here is an offer or solicitation of these securities,
products and services in any jurisdiction where their offer or sale is not qualified or exempt from registration. The Indian Analyst(s) who compile this report is/are not located in Hong Kong & are not conducting Research Analysis in
Hong Kong.
Motilal Oswal Securities Limited (MOSL) is not a registered broker - dealer under the U.S. Securities Exchange Act of 1934, as amended (the"1934 act") and under applicable state laws in the United States. In addition MOSL is not a
registered investment adviser under the U.S. Investment Advisers Act of 1940, as amended (the "Advisers Act" and together with the 1934 Act, the "Acts), and under applicable state laws in the United States. Accordingly, in the
absence of specific exemption under the Acts, any brokerage and investment services provided by MOSL, including the products and services described herein are not available to or intended for U.S. persons.
This report is intended for distribution only to "Major Institutional Investors" as defined by Rule 15a-6(b)(4) of the Exchange Act and interpretations thereof by SEC (henceforth referred to as "major institutional investors"). This
document must not be acted on or relied on by persons who are not major institutional investors. Any investment or investment activity to which this document relates is only available to major institutional investors and will be
engaged in only with major institutional investors. In reliance on the exemption from registration provided by Rule 15a-6 of the U.S. Securities Exchange Act of 1934, as amended (the "Exchange Act") and interpretations thereof by
the U.S. Securities and Exchange Commission ("SEC") in order to conduct business with Institutional Investors based in the U.S., MOSL has entered into a chaperoning agreement with a U.S. registered broker-dealer, Motilal Oswal
Securities International Private Limited. ("MOSIPL"). Any business interaction pursuant to this report will have to be executed within the provisions of this chaperoning agreement.
The Research Analysts contributing to the report may not be registered /qualified as research analyst with FINRA. Such research analyst may not be associated persons of the U.S. registered broker-dealer, MOSIPL, and therefore,
may not be subject to NASD rule 2711 and NYSE Rule 472 restrictions on communication with a subject company, public appearances and trading securities held by a research analyst account.
For Singapore
Motilal Oswal Capital Markets Singapore Pte Limited is acting as an exempt financial advisor under section 23(1)(f) of the Financial Advisers Act(FAA) read with regulation 17(1)(d) of the Financial Advisors Regulations and is a
subsidiary of Motilal Oswal Securities Limited in India. This research is distributed in Singapore by Motilal Oswal Capital Markets Singapore Pte Limited and it is only directed in Singapore to accredited investors, as defined in the
Financial Advisers Regulations and the Securities and Futures Act (Chapter 289), as amended from time to time.
In respect of any matter arising from or in connection with the research you could contact the following representatives of Motilal Oswal Capital Markets Singapore Pte Limited:
Varun Kumar
Varun.kumar@motilaloswal.com
Contact : (+65) 68189232
Office Address:21 (Suite 31),16 Collyer Quay,Singapore 04931
Kadambari Balachandran
kadambari.balachandran@motilaloswal.com
(+65) 68189233 / 65249115
For U.S
11 August 2016
Motilal Oswal Tower, Level 9, Sayani Road, Prabhadevi, Mumbai 400 025
Phone: +91 22 3982 5500 E-mail: reports@motilaloswal.com
Motilal Oswal Securities Ltd
10