Parag Milk Foods
BSE SENSEX
27,860
S&P CNX
8,592
11 August 2016
Q1FY17 Results Update | Sector: Consumer
CMP: INR326
TP: INR340(+4%)
Neutral
Motilal Oswal values your support in
the Asiamoney Brokers Poll 2016 for
India Research, Sales and Trading
team. We
request your ballot.
Long term growth drivers in place
Bloomberg
Equity Shares (m)
M.Cap.(INRb)/(USDb)
52-Week Range (INR)
1, 6, 12 Rel. Per (%)
12M Avg Val (INR M)
Free float (%)
PARAG IN
84.4
27.5 / 0.4
357 / 202
-2/-/-
257
52.5
Financials & Valuations (INR b)
Y/E Mar
2016 2017E 2018E
Net Sales
16.5
18.4
22.8
EBITDA
1.5
1.8
2.3
PAT
0.5
0.8
1.1
EPS (INR)
6.7
9.3
12.8
Gr. (%)
-66.7 38.2
37.9
BV/Sh (INR)
51.4
89.4 102.2
RoE (%)
19.5
14.1
13.4
RoCE (%)
12.4
11.1
11.7
P/E (x)
48.5
35.1
25.4
P/BV (x)
6.3
3.6
3.2
Estimate change
TP change
Rating change
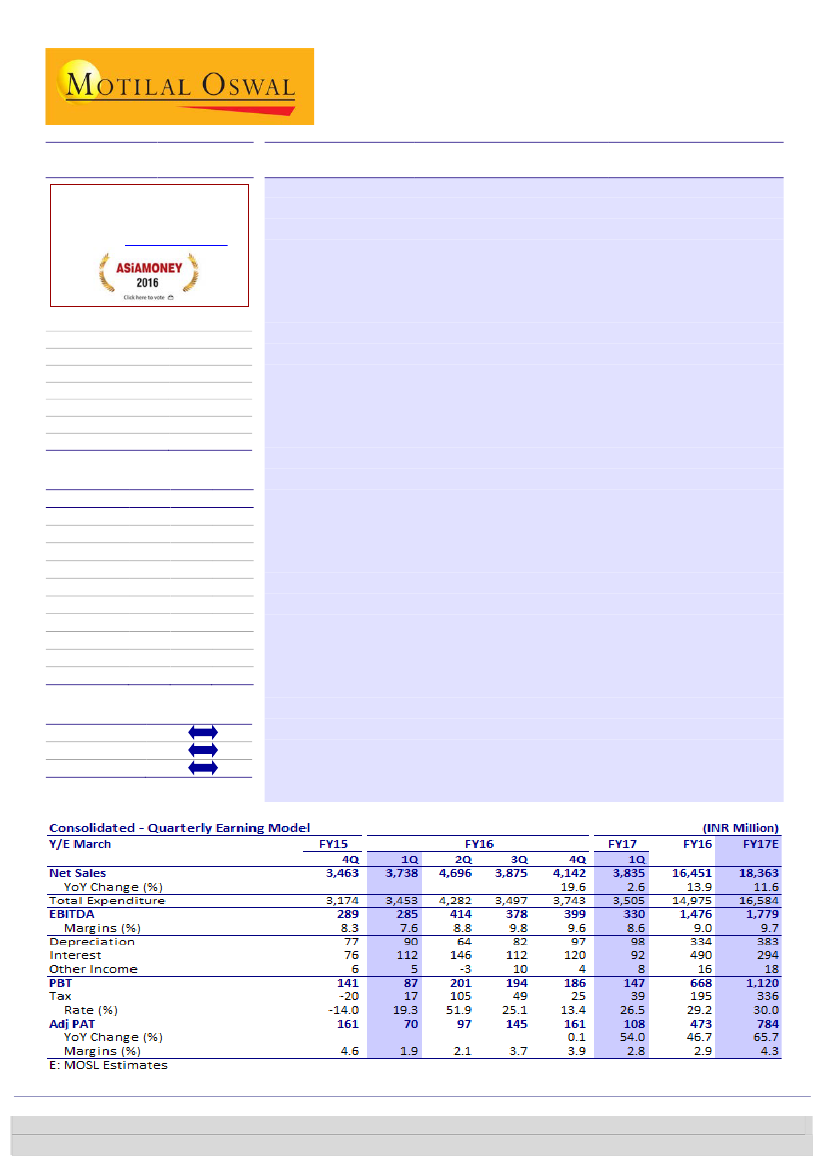
PARAG’s 1QFY17
consolidated sales grew 3% YoY to INR3.8b led by Fresh milk
growth of 25% and Milk products sales growth of 5% (with around 4% volume
growth). SMP sales declined 14% YoY and others segment sales declined by
79%. EBITDA grew 16% YoY to INR330m while PAT grew 54% YoY to INR108m.
Sharp gross margin expansion:
Gross margins expanded sharply by 420bp YoY
to 29.9% aided by improving product mix and utilization of lower cost raw
materials of the previous quarter. Increase in employee costs (up 90bp YoY to
4.6%) and higher other expenses (up 230bp YoY to 16.7%) led to EBITDA
margin expansion of 100bp YoY to 8.6%. EBITDA thus grew 16% YoY to
INR330m.
Debt reduction:
Interest costs declined 17% YoY as debt levels reduced to INR
3b after repayment of loans worth INR1b. Tax rate increased 720bp YoY off a
low base. Full year tax rate is likely to be around 30%, same as last year.
Key concall highlights:
(1) 1st quarter sales and margins are the lowest in
terms of full year performance; summers are also low in terms of sale of milk
and milk products. (2) Price increases were taken at the back end of quarter so
the entire growth for 1QFY17 is mostly due to volume growth. (3) Management
is aiming for 5% PAT margin in FY19 led by price increase, product mix,
economies of scale, cost efficiencies and lower interest cost.
Valuation and view:
Opportunity size in Dairy is huge and in-turn offers strong
growth visibility for branded players. Parag with its strengths on procurement,
distribution, innovation and management bandwidth is best placed among
peers. While rest of the listed Dairy players are either regional in nature or
have dominant B2B positioning, Parag offers a pan-national branded dairy play
with B2C focus. While we are positive on the long term investment story, the
stock has appreciated by 51% since its IPO three months ago, capping the near
term upside at 4%. Maintain Neutral rating and target price of INR 340 (25x
June 2015 EPS). From a medium term perspective, Parag offers a compelling
three year play with potential 23% CAGR returns.
Vishal Punmiya
(Vishal.Punmiya@MotilalOswal.com); +91 2239804261
Krishnan Sambamoorthy
(Krishnan.Sambamoorthy@MotilalOswal.com); +912239825428/Gautam
Duggad
(Gautam.Duggad@motilaloswal.com); +912261291522
Investors are advised to refer through important disclosures made at the last page of the Research Report.
Motilal Oswal research is available on www.motilaloswal.com/Institutional-Equities, Bloomberg, Thomson Reuters, Factset and S&P Capital.