13 August 2016
1QFY17 Results Update | Sector: Healthcare
Granules India
BSE SENSEX
28,152
S&P CNX
8,672
CMP: INR135
TP: INR160 (+19%)
Buy
Motilal Oswal values your support in
the Asiamoney Brokers Poll 2016 for
India Research, Sales and Trading
team. We
request your ballot.
Results largely in line; margins remained robust
Bloomberg
Equity Shares (m)
M.Cap.(INR b)/(USD b)
52-Week Range (INR)
1, 6, 12 Rel. Per (%)
Avg Val, (INR m)
Free float (%)
GRAN IN
216.7
29.3 / 0.4
164 / 101
-10/4/27
218
48.9
Financials & Valuations (INR b)
Y/E Mar
2016 2017E 2018E
Sales
14.3
15.6
19.0
EBITDA
2.8
3.2
4.0
NP
1.2
1.6
2.2
EPS (INR)
5.5
6.8
9.8
EPS Gr. (%)
22.8
25.1
42.6
BV/Sh. (INR)
30.7
39.6
47.5
RoE (%)
21.6
19.9
22.4
RoCE (%)
14.0
14.1
16.4
P/E (x)
24.6
19.7
13.8
P/BV (x)
4.4
3.4
2.8
Estimate change
TP change
Rating change
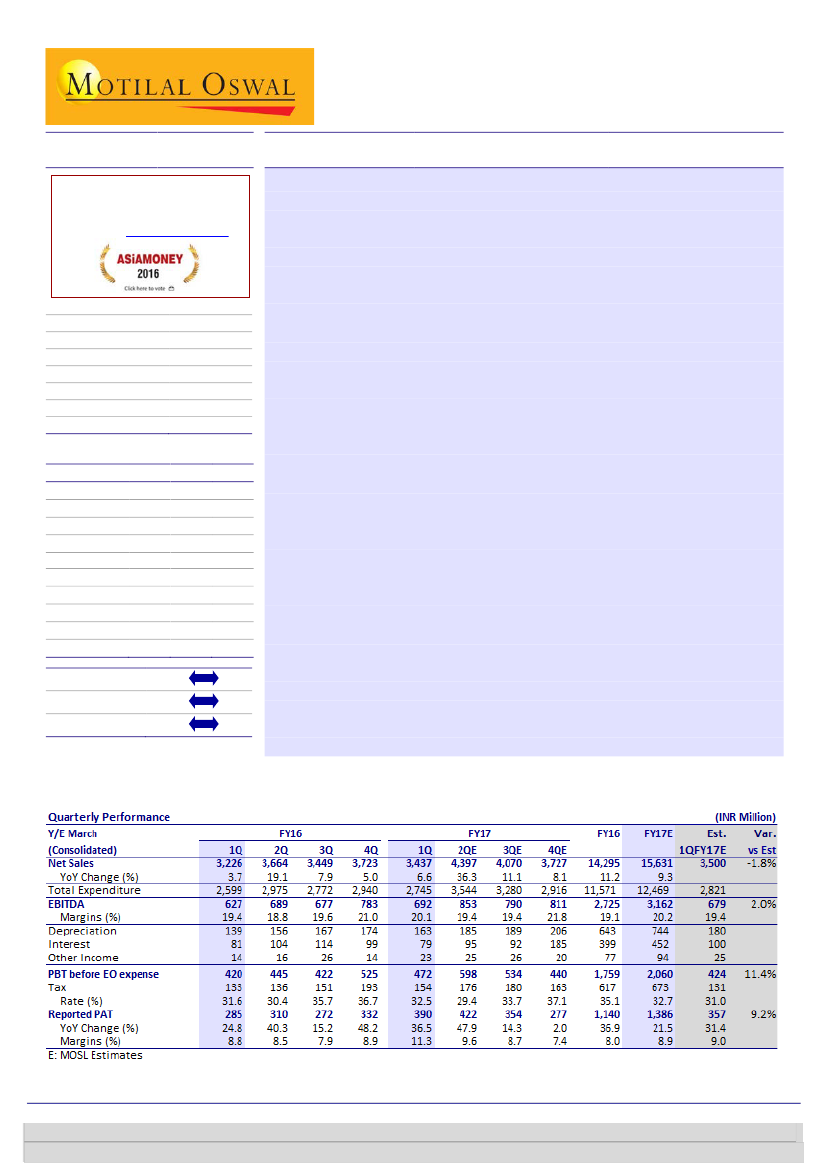
As per Ind-AS, revenues grew 7%YoY to INR3.4b (largely in line) led by sustained
traction in CMO and Rx business. However, EBITDA increased 11% YoY to INR692m
on the back of improved business mix in 1QFY17. EBITDA margins expanded 72bps
YoY, to 20.1% primarily owing to higher gross margins (up 280 bps YoY). PAT grew
37% YoY to INR390m (+9% beat). JV business (Biocause and Omnichem delivered
robust profits of INR71m in 1QFY17.
Finished dosage continues to shine:
Finished dosage segment grew 31%YoY
to ~INR1.2b, driven by scale up in Rx business. PFI segment declined by 13%
YoY and API segment grew at a modest pace of 4.4% YoY to INR1.4b. The
company has been witnessing pricing pressure within the Paracetamol
molecule that has resulted in muted API sales. The company maintained its
consolidated top-line growth of ~15-16% YoY in FY17. Company expects to
launch 1
st
ANDA product from US Pharma acquisition (gLatuda) in 4Q FY18.
Over FY16-18E, we expect GRAN’s revenues to grow at 18% CAGR (adjusted for
JV sales), driven by strong growth in Finished dosages segment.
Margins remained robust on the back of favorable business mix:
EBITDA
margin at 20.1% (up 72bp YoY) was boosted by higher contribution from
finished dosages segment during this quarter (~36% of sales vs 29% in 1Q
FY16). Moreover, The company is also working on improving manufacturing
efficiency that resulted in better yield for some of the key products. We expect
EBITDA margins to expand by 240bp over FY16-18E led by improving business
mix and better operating leverage. Hence, EBITDA is likely to outpace revenue
growth at 21% CAGR over FY16-18E.
Earnings acceleration to drive valuation upside:
We expect GRAN to
report 34% PAT CAGR over FY16-18E, driven by improving traction in finished
dosages formulations. However, the story beyond FY18 is much rosier, as we
see more approvals in the US for the OTC and Rx business and ramp-up is
expected in Omnichem JV, which will drive both revenue and profitability. At
CMP stock trades at 20x FY17E and 14x FY18E EPS. We re-iterate
Buy
with
target price of INR160 (@16x FY18E EPS).
Kumar Saurabh
(Kumar.Saurabh@MotilalOswal.com); +91 22 6129 1519
Gaurav Tinani
(Gaurav.Tinani@motilaloswal.com); +91 22 6129 1552
Investors are advised to refer through important disclosures made at the last page of the Research Report.
Motilal Oswal research is available on www.motilaloswal.com/Institutional-Equities, Bloomberg, Thomson Reuters, Factset and S&P Capital.

Granules India
At a strategic inflection point
US OTC and Rx business to transform business model
On the back of US OTC sales and ramp-up in existing Rx sales (through new
product launches), we project 35%+ revenue CAGR in GRAN's formulations
business over FY16-20E.
Currently, GRAN has five products approvals in the US (2 Rx and 3 OTC). It is
likely to file 10 more ANDAs over the next one year and 7-8 product filings every
year post FY17. These filings would be mostly in OTC products (from existing
molecules), some from Auctus molecules and a few complex products from the
Virginia facility.
We believe GRAN's independent entry into the US store brand OTC segment is a
big game changer. It opens a huge opportunity for GRAN to scale up in a
profitable and sustainable business in the US, currently dominated by only one
player - Perrigo (~45% market share). Upon successful tenders from big retailers,
GRAN's OTC store brand business could grow at over 50% CAGR beyond FY18.
At present, only 31% of sales come from the high margin formulations business.
We believe this contribution would rise to 48-50% by FY20.
GRAN intends to expand API capacities of Paracetamol, Metfomin and
Guaifenecin by 25-30%, 3.5x and 2.7x, respectively, which will support both its
base and emerging businesses.
In FY16, GRAN has also increased its PFI capacity by 38-40% to 18,400MTPA.
This debottlenecking is likely to support 16-18% PFI revenue CAGR over the next
two years.
The company is coming up with a Greenfield multi-product API capacity at Vizag
to support the growing need of internal consumption and new filings.
GRAN has invested heavily in R&D. With the acquisition of the Virginia facility in
the US, it now has two R&D centers - one in Vizag for developing normal ANDAs
and one in Virginia for developing complex ANDAs.
With Omnichem CRAMs JV, GRAN would be entering into manufacturing of high
value APIs for innovators and other big MNCs. We project revenue of INR750m
in FY17 and INR1.25b in FY18. At its peak, the facility can generate revenue of
INR2.25b for Granules. Revenue is likely to grow rapidly beyond FY17 post site
approvals for the customers.
With US OTC, Rx products and Omnichem JV, the revenue contribution from
high margin businesses is likely to increase to ~75% of sales by FY20 from the
current 56%.
This will also be driven by higher operating leverage in the formulations
business, as capacity utilization increases from 50% presently to 100% by FY19,
with ramp-up in US business.
Driven by changing business mix and higher operating leverage, overall EBITDA
margin is likely to expand from 18.8% in FY16E to 23% in FY20E; EBITDA would
grow at a CAGR of 27% over FY16-20.
2
Augmented capacities to support base as well as emerging business
Omnichem CRAMs JV - entry into high value APIs
Not only growth, but profitability as well
13 August 2016

Granules India
Story in Charts
Exhibit 1: Revenues exhibited 7%YoY growth in 1QFY17
Revenue (INR m)
36
3,459
16
13
12
4
3,664
3,449
19
8
17%
3,723
5
3,437
7
528
524
545
490
627
689
677
783
692
17%
17%
14%
% YoY growth
Exhibit 2: EBITDA margins expanded 75bps YoY
EBITDA (INR m)
19%
19%
EBITDA M (%)
20%
21%
20%
3,110 3,076 3,197 3,546
Exhibit 3: Revenues to exhibit 14% CAGR over FY16-18E
Revenues (INR b)
43.4
%YoY growth
Exhibit 4: Formulation contribution to increase
FD (%)
PFI (%)
API (%)
0
34
27
32
5
31
26
32
Omnichem (%)
6
29
25
35
7
26
22
42
7
22
19
48
37.6
4.8
3.1
6.5
16.9
7.6
18.0
18.7
10.6
22.6 25.4
46
33
21
40
31
29
44
29
27
39
29
32
44
24
32
9.3
11.0 12.9 14.3 15.6 18.6 22.8 28.5
Exhibit 5: EBITDA margins to expand to 23.5% by FY20E
EBITDA (INR b)
16.1
EBITDA margin (%)
22.9 23.5
20.5 21.8
19.4
Exhibit 6: FCF to scale up from FY18E
Free Cashflows (INR m)
41.9
(0.9)
(37.0) (29.5)
-1,570
236
-294 -251
(99.2)
3.7
34.7
32.5 29.0
FCF/EBITDA (%)
11.8 12.1 11.1
1
1
1
14.4
2
2
3
3
4
5
7
2.6
103 84 1,317 1,509 2,326
-20
Exhibit 7: Capex needs to continue with growth
Capex (INR m)
2,649
1,163
250
550
1,473 1,335
2,328
1,519
Exhibit 8: Earnings to exhibit 34% CAGR over FY16-18E
EPS (INR/share)
2,002 2,097
1.0
1.5
1.6
3.7
4.5
5.5
6.8
9.8
13.6 18.6
Source: AIOCD, MOSL
Source: AIOCD, MOSL
13 August 2016
3

Granules India
Valuation and view
Over the last six years, GRAN reported 39% earnings CAGR on improved profitability,
higher operating leverage and superior business mix. It expanded its finished
dosages business at a CAGR of 36% over FY11-16, leading to higher profitability and
improved utilization of the existing capacity of 18b tablets. Profitability of the PFI
business has also improved substantially, with the implementation of 6MT order
capacity. As a result, GRAN has expanded its EBITDA margins from 11.8% in FY11 to
19.4% in FY16.
Going ahead, we expect 34% earnings CAGR to continue for next four years,
supported by 19% revenue CAGR and 410bp margin expansion. Our target price of
INR160 discounts GRAN’s FY18E EPS at 16x, which (a) is at 20% discount to sector
average, and (b) implies a PEG of 0.5x (FY16-18E EPS CAGR of 34%).
GRAN is currently trading at 19.9x FY17E and 13.8x FY18E EPS – at 30%+ discount to
sector average, which is unjustified, in our view. We argue for a P/E re-rating for
GRAN, given (a) strong EPS outlook – 34% CAGR over FY16-18E, backed by 19%
revenue CAGR (b) RoCE improvement from 14.0% to 16.4% by FY18E, and 23.0% by
FY20E (c) deleveraging – we expect net D/E to improve to 0.3x by FY18 (v/s 0.7x in
FY16).
Key catalysts to drive stock’s performance over the medium term
Finished dosages product approvals from regulated markets.
Greater traction in Auctus portfolio.
Higher than expected realizations from Omnichem JV.
Risks to our investment thesis
Pricing pressure on existing products.
Regulatory risks related to already approved manufacturing facilities.
Exhibit 10: P/E relative to Sensex
150
45.9
100
50
0
17.7
-50
-100
3.4
Exhibit 9: P/E band–Significant re-rating over past 24 mon.
50
40
30
20
10
0
2.6
7.8
12.5
PE (x)
Median(x)
Peak(x)
Min(x)
Avg(x)
Granules India PE Relative to Sensex PE (%)
LPA (%)
-30.2
Source: MOSL, Company
13 August 2016
4

Granules India
Financials and Valuations
Consolidated - Income Statement
Y/E March
Income from Operations
Less: Excise Duty
Total Income from Operations
Change (%)
Total Expenditure
% of Sales
EBITDA
Margin (%)
Depreciation
EBIT
Int. and Finance Charges
Other Income
PBT
Current Tax
Deferred Tax
Tax Rate (%)
Reported PAT
Adjusted PAT
Change (%)
Margin (%)
FY12
6,636
96
6,540
37.6
5,747
87.9
793
12.1
207
586
170
14
430
99
32
30.3
300
300
43.3
4.6
FY13
7,838
194
7,644
16.9
6,793
88.9
851
11.1
231
620
177
21
464
124
14
29.7
326
326
8.8
4.3
FY14
11,167
209
10,959
43.4
9,376
85.6
1,583
14.4
298
1,285
204
43
1,124
305
66
33.0
753
753
130.8
6.9
FY15
13,279
350
12,929
18.0
10,843
83.9
2,086
16.1
527
1,560
323
43
1,280
287
83
29.0
909
909
20.8
7.0
FY16
14,603
308
14,295
10.6
11,528
80.6
2,767
19.4
643
2,124
399
77
1,802
535
82
34.2
1,185
1,185
30.3
8.3
FY17E
15,983
352
15,631
9.3
12,427
79.5
3,204
20.5
744
2,461
452
94
2,103
673
0
32.0
1,560
1,560
31.7
10.0
(INR Million)
FY18E
18,977
417
18,560
18.7
14,514
78.2
4,046
21.8
891
3,155
321
111
2,945
884
0
30.0
2,224
2,224
42.6
12.0
Consolidated - Balance Sheet
Y/E March
Equity Share Capital
Total Reserves
Net Worth
Minority Interest
Deferred Liabilities
Total Loans
Capital Employed
Gross Block
Less: Accum. Deprn.
Net Fixed Assets
Capital WIP
Total Investments
Curr. Assets, Loans&Adv.
Inventory
Account Receivables
Cash and Bank Balance
Loans and Advances
Curr. Liability & Prov.
Account Payables
Other Current Liabilities
Provisions
Net Current Assets
Appl. of Funds
E: MOSL Estimates
FY12
201
2,250
2,451
0
236
2,036
4,723
3,545
1,041
2,504
293
2
2,914
1,099
950
320
545
996
755
179
62
1,918
4,723
FY13
201
2,547
2,749
0
258
2,705
5,712
3,874
1,240
2,635
1,088
97
3,007
1,365
710
417
515
1,128
918
143
68
1,879
5,712
FY14
203
3,357
3,560
0
403
4,417
8,380
6,539
1,714
4,825
1,246
2
3,848
1,742
1,109
418
580
1,640
1,355
162
123
2,208
8,379
FY15
204
4,107
4,312
0
549
4,872
9,732
8,438
2,272
6,166
620
2
5,184
2,245
1,326
653
959
2,295
1,887
233
175
2,888
9,732
FY16
217
6,444
6,660
0
646
4,767
12,074
9,622
2,941
6,681
766
2
7,080
3,071
1,526
1,419
1,065
2,521
1,791
608
122
4,559
12,074
FY17E
228
8,797
9,025
0
646
4,267
13,939
11,622
3,684
7,938
1,094
2
7,722
3,310
1,668
1,580
1,164
2,884
1,931
665
288
4,839
13,938
(INR Million)
FY18E
228
10,609
10,837
0
646
3,767
15,251
13,122
4,575
8,547
1,114
2
9,003
3,866
1,981
1,774
1,383
3,481
2,255
789
436
5,522
15,251
13 August 2016
5

Granules India
Financials and Valuations
Ratios
Y/E March
Basic (INR)
EPS
Cash EPS
BV/Share
DPS
Payout (%)
Valuation (x)
P/E
Cash P/E
P/BV
EV/Sales
EV/EBITDA
Dividend Yield (%)
Return Ratios (%)
RoE
RoCE
RoIC
Working Capital Ratios
Asset Turnover (x)
Inventory (Days)
Debtor (Days)
Creditor (Days)
Leverage Ratio (x)
Debt/Equity
FY12
1.5
2.5
12.2
0.2
15.6
FY13
1.6
2.8
13.7
0.2
14.4
FY14
3.7
5.2
17.6
0.4
11.0
FY15
4.5
7.0
21.1
0.5
13.6
30.2
19.1
6.4
2.4
15.0
0.4
12.9
10.6
10.8
1.4
61
52
67
0.8
12.5
9.1
10.6
1.3
65
33
72
1.0
23.9
13.2
15.9
1.3
58
36
77
1.2
23.1
13.3
14.6
1.3
63
36
92
1.1
FY16
5.5
8.4
30.7
0.6
13.9
24.6
15.9
4.4
2.1
11.0
0.5
21.6
14.0
15.2
1.2
78
38
86
0.7
FY17E
6.8
10.1
39.6
1.0
17.2
19.7
13.3
3.4
1.9
9.3
0.7
19.9
14.1
15.8
1.1
77
38
87
0.5
FY18E
9.8
13.7
47.5
1.5
18.5
13.8
9.8
2.8
1.6
7.2
1.1
22.4
16.4
18.7
1.2
76
38
87
0.3
Consolidated - Cash Flow Statement
Y/E March
OP/(Loss) before Tax
Depreciation
Interest & Finance Charges
Direct Taxes Paid
(Inc)/Dec in WC
CF from Operations
Others
CF from Operating incl EO
(inc)/dec in FA
(Pur)/Sale of Investments
Others
CF from Investments
Issue of Shares
(Inc)/Dec in Debt
Interest Paid
Dividend Paid
CF from Fin. Activity
Inc/Dec of Cash
Opening Balance
Closing Balance
E: MOSL Estimates
FY12
430
207
164
-115
-436
249
7
256
-550
2
3
-545
0
691
-168
-35
489
200
120
320
FY13
463
231
165
-112
146
893
19
912
-1,163
-95
-20
-1,278
6
682
-178
-47
463
97
320
417
FY14
1,124
298
190
-238
-310
1,064
16
1,080
-2,649
95
8
-2,546
11
1,709
-205
-47
1,467
0
417
417
FY15
1,280
527
309
-317
-363
1,435
18
1,453
-1,473
0
17
-1,456
11
628
-319
-83
238
236
417
653
FY16
1,801
643
347
-490
-915
1,387
51
1,438
-1,335
0
53
-1,281
1,059
191
-406
-234
609
766
653
1,419
FY17E
2,103
744
358
-673
-119
2,413
0
2,413
-2,328
0
94
-2,235
1,203
-500
-452
-268
-17
161
1,419
1,580
(INR Million)
FY18E
2,945
891
210
-884
-326
2,836
0
2,836
-1,519
0
111
-1,408
0
-500
-321
-412
-1,234
194
1,580
1,774
13 August 2016
6

Granules India
Corporate profile
Company description
Exhibit 1: Sensex rebased
Incorporated in 1991, the Hyderabad-based
Granules India (GRAN) is a vertically integrated
manufacturer of pharmaceutical products. It is
among the largest manufacturers of Paracetamol
and Iboprofen in the world. It derives 63% of its
business from Europe and the US. GRAN also has a
formulations plant, with a capacity to produce 18b
tablets per annum. It has its own Abbreviated New
Drug Applications (ANDAs) and dossiers. GRAN
services more than 300 customers across 60 nations
(exports are ~87% of revenues).
Source: MOSL/Bloomberg
Exhibit 2: Shareholding pattern (%)
Mar-16
51.1
1.2
6.4
41.3
Promoter
DII
FII
Others
Dec-15
49.5
1.1
5.8
43.6
Mar-15
48.6
0.1
4.0
47.3
Source: Capitaline
Exhibit 3: Top holders
Holder Name
BASAVA SANKARA RAO KOLLI
Government Pension Fund Global
% Holding
1.7
1.6
Note: FII Includes depository receipts
Source: Capitaline
Exhibit 4: Top management
Name
C Krishna Prasad
Uma Devi Chigurupati
Chaitanya Tummala
Designation
Chairman & Managing Director
Executive Director
Company Secretary
Exhibit 5: Directors
Name
A Arun Rao Akinepally
C Parthasarathy
Krishna M Ella
Harsha Chigurupati
Name
A P Kurian
K B Sankara Rao
L S Sarma
Source: Capitaline
*Independent
Exhibit 6: Auditors
Name
Dhanunjaya & Haranath
Kumar & Giri
Internal
Statutory
Type
Exhibit 7: MOSL forecast v/s consensus
EPS
(INR)
FY17
FY18
MOSL
forecast
6.8
9.8
Consensus
forecast
7.4
9.9
Variation (%)
-8.1
-1.0
Source: Bloomberg
Source: Capitaline
13 August 2016
7

Disclosures
This document has been prepared by Motilal Oswal Securities Limited (hereinafter referred to as Most) to provide information about the company (ies) and/sector(s), if any, covered in the report and may be distributed by it and/or its
Granules India
affiliated company(ies). This report is for personal information of the selected recipient/s and does not construe to be any investment, legal or taxation advice to you. This research report does not constitute an offer, invitation or
inducement to invest in securities or other investments and Motilal Oswal Securities Limited (hereinafter referred as MOSt) is not soliciting any action based upon it. This report is not for public distribution and has been furnished to
you solely for your general information and should not be reproduced or redistributed to any other person in any form. This report does not constitute a personal recommendation or take into account the particular investment
objectives, financial situations, or needs of individual clients. Before acting on any advice or recommendation in this material, investors should consider whether it is suitable for their particular circumstances and, if necessary, seek
professional advice. The price and value of the investments referred to in this material and the income from them may go down as well as up, and investors may realize losses on any investments. Past performance is not a guide for
future performance, future returns are not guaranteed and a loss of original capital may occur.
MOSt and its affiliates are a full-service, integrated investment banking, investment management, brokerage and financing group. We and our affiliates have investment banking and other business relationships with a some
companies covered by our Research Department. Our research professionals may provide input into our investment banking and other business selection processes. Investors should assume that MOSt and/or its affiliates are
seeking or will seek investment banking or other business from the company or companies that are the subject of this material and that the research professionals who were involved in preparing this material may educate investors
on investments in such business . The research professionals responsible for the preparation of this document may interact with trading desk personnel, sales personnel and other parties for the purpose of gathering, applying and
interpreting information. Our research professionals are paid on twin parameters of performance & profitability of MOSt.
MOSt generally prohibits its analysts, persons reporting to analysts, and members of their households from maintaining a financial interest in the securities or derivatives of any companies that the analysts cover. Additionally, MOSt
generally prohibits its analysts and persons reporting to analysts from serving as an officer, director, or advisory board member of any companies that the analysts cover. Our salespeople, traders, and other professionals or affiliates
may provide oral or written market commentary or trading strategies to our clients that reflect opinions that are contrary to the opinions expressed herein, and our proprietary trading and investing businesses may make investment
decisions that are inconsistent with the recommendations expressed herein. In reviewing these materials, you should be aware that any or all of the foregoing among other things, may give rise to real or potential conflicts of interest.
MOSt and its affiliated company(ies), their directors and employees and their relatives may; (a) from time to time, have a long or short position in, act as principal in, and buy or sell the securities or derivatives thereof of companies
mentioned herein. (b) be engaged in any other transaction involving such securities and earn brokerage or other compensation or act as a market maker in the financial instruments of the company(ies) discussed herein or act as an
advisor or lender/borrower to such company(ies) or may have any other potential conflict of interests with respect to any recommendation and other related information and opinions.; however the same shall have no bearing
whatsoever on the specific recommendations made by the analyst(s), as the recommendations made by the analyst(s) are completely independent of the views of the affiliates of MOSt even though there might exist an inherent
conflict of interest in some of the stocks mentioned in the research report Reports based on technical and derivative analysis center on studying charts company's price movement, outstanding positions and trading volume, as
opposed to focusing on a company's fundamentals and, as such, may not match with a report on a company's fundamental analysis. In addition MOST has different business segments / Divisions with independent research
separated by Chinese walls catering to different set of customers having various objectives, risk profiles, investment horizon, etc, and therefore may at times have different contrary views on stocks sectors and markets.
Unauthorized disclosure, use, dissemination or copying (either whole or partial) of this information, is prohibited. The person accessing this information specifically agrees to exempt MOSt or any of its affiliates or employees from,
any and all responsibility/liability arising from such misuse and agrees not to hold MOSt or any of its affiliates or employees responsible for any such misuse and further agrees to hold MOSt or any of its affiliates or employees free
and harmless from all losses, costs, damages, expenses that may be suffered by the person accessing this information due to any errors and delays. The information contained herein is based on publicly available data or other
sources believed to be reliable. Any statements contained in this report attributed to a third party represent MOSt’s interpretation of the data, information and/or opinions provided by that third party either publicly or through a
subscription service, and such use and interpretation have not been reviewed by the third party. This Report is not intended to be a complete statement or summary of the securities, markets or developments referred to in the
document. While we would endeavor to update the information herein on reasonable basis, MOSt and/or its affiliates are under no obligation to update the information. Also there may be regulatory, compliance, or other reasons that
may prevent MOSt and/or its affiliates from doing so. MOSt or any of its affiliates or employees shall not be in any way responsible and liable for any loss or damage that may arise to any person from any inadvertent error in the
information contained in this report. MOSt or any of its affiliates or employees do not provide, at any time, any express or implied warranty of any kind, regarding any matter pertaining to this report, including without limitation the
implied warranties of merchantability, fitness for a particular purpose, and non-infringement. The recipients of this report should rely on their own investigations.
This report is intended for distribution to institutional investors. Recipients who are not institutional investors should seek advice of their independent financial advisor prior to taking any investment decision based on this report or for
any necessary explanation of its contents.
Most and it’s associates may have managed or co-managed public offering of securities, may have received compensation for investment banking or merchant banking or brokerage services, may have received any compensation
for products or services other than investment banking or merchant banking or brokerage services from the subject company in the past 12 months.
Most and it’s associates have not received any compensation or other benefits from the subject company or third party in connection with the research report.
Subject Company may have been a client of Most or its associates during twelve months preceding the date of distribution of the research report
MOSt and/or its affiliates and/or employees may have interests/positions, financial or otherwise of over 1 % at the end of the month immediately preceding the date of publication of the research in the securities mentioned in this
report. To enhance transparency, MOSt has incorporated a Disclosure of Interest Statement in this document. This should, however, not be treated as endorsement of the views expressed in the report.
Motilal Oswal Securities Limited is registered as a Research Analyst under SEBI (Research Analyst) Regulations, 2014. SEBI Reg. No. INH000000412
Pending Regulatory inspections against Motilal Oswal Securities Limited:
SEBI pursuant to a complaint from client Shri C.R. Mohanraj alleging unauthorized trading, issued a letter dated 29th April 2014 to MOSL notifying appointment of an Adjudicating Officer as per SEBI regulations to hold inquiry and
adjudge violation of SEBI Regulations; MOSL replied to the Show Cause Notice whereby SEBI granted us an opportunity of Inspection of Documents. Since all the documents requested by us were not covered we have requested to
SEBI vide our letter dated June 23, 2015 to provide pending list of documents for inspection.
List of associate companies of Motilal Oswal Securities Limited -Click
here to access detailed report
Analyst Certification
The views expressed in this research report accurately reflect the personal views of the analyst(s) about the subject securities or issues, and no part of the compensation of the research analyst(s) was, is, or will be directly or
indirectly related to the specific recommendations and views expressed by research analyst(s) in this report. The research analysts, strategists, or research associates principally responsible for preparation of MOSt research receive
compensation based upon various factors, including quality of research, investor client feedback, stock picking, competitive factors and firm revenues
Disclosure of Interest Statement
Analyst ownership of the stock
Served as an officer, director or employee
GRANULES INDIA
No
No
A graph of daily closing prices of securities is available at www.nseindia.com and http://economictimes.indiatimes.com/markets/stocks/stock-quotes
Regional Disclosures (outside India)
This report is not directed or intended for distribution to or use by any person or entity resident in a state, country or any jurisdiction, where such distribution, publication, availability or use would be contrary to law, regulation or which
would subject MOSt & its group companies to registration or licensing requirements within such jurisdictions.
For Hong Kong:
This report is distributed in Hong Kong by Motilal Oswal capital Markets (Hong Kong) Private Limited, a licensed corporation (CE AYY-301) licensed and regulated by the Hong Kong Securities and Futures
Commission (SFC) pursuant to the Securities and Futures Ordinance (Chapter 571 of the Laws of Hong Kong) “SFO”. As per SEBI (Research Analyst Regulations) 2014 Motilal Oswal Securities (SEBI Reg No. INH000000412) has
an agreement with Motilal Oswal capital Markets (Hong Kong) Private Limited for distribution of research report in Kong Kong. This report is intended for distribution only to “Professional Investors” as defined in Part I of Schedule 1 to
SFO. Any investment or investment activity to which this document relates is only available to professional investor and will be engaged only with professional investors.” Nothing here is an offer or solicitation of these securities,
products and services in any jurisdiction where their offer or sale is not qualified or exempt from registration. The Indian Analyst(s) who compile this report is/are not located in Hong Kong & are not conducting Research Analysis in
Hong Kong.
Motilal Oswal Securities Limited (MOSL) is not a registered broker - dealer under the U.S. Securities Exchange Act of 1934, as amended (the"1934 act") and under applicable state laws in the United States. In addition MOSL is not a
registered investment adviser under the U.S. Investment Advisers Act of 1940, as amended (the "Advisers Act" and together with the 1934 Act, the "Acts), and under applicable state laws in the United States. Accordingly, in the
absence of specific exemption under the Acts, any brokerage and investment services provided by MOSL, including the products and services described herein are not available to or intended for U.S. persons.
This report is intended for distribution only to "Major Institutional Investors" as defined by Rule 15a-6(b)(4) of the Exchange Act and interpretations thereof by SEC (henceforth referred to as "major institutional investors"). This
document must not be acted on or relied on by persons who are not major institutional investors. Any investment or investment activity to which this document relates is only available to major institutional investors and will be
engaged in only with major institutional investors. In reliance on the exemption from registration provided by Rule 15a-6 of the U.S. Securities Exchange Act of 1934, as amended (the "Exchange Act") and interpretations thereof by
the U.S. Securities and Exchange Commission ("SEC") in order to conduct business with Institutional Investors based in the U.S., MOSL has entered into a chaperoning agreement with a U.S. registered broker-dealer, Motilal Oswal
Securities International Private Limited. ("MOSIPL"). Any business interaction pursuant to this report will have to be executed within the provisions of this chaperoning agreement.
The Research Analysts contributing to the report may not be registered /qualified as research analyst with FINRA. Such research analyst may not be associated persons of the U.S. registered broker-dealer, MOSIPL, and therefore,
may not be subject to NASD rule 2711 and NYSE Rule 472 restrictions on communication with a subject company, public appearances and trading securities held by a research analyst account.
For Singapore
Motilal Oswal Capital Markets Singapore Pte Limited is acting as an exempt financial advisor under section 23(1)(f) of the Financial Advisers Act(FAA) read with regulation 17(1)(d) of the Financial Advisors Regulations and is a
subsidiary of Motilal Oswal Securities Limited in India. This research is distributed in Singapore by Motilal Oswal Capital Markets Singapore Pte Limited and it is only directed in Singapore to accredited investors, as defined in the
Financial Advisers Regulations and the Securities and Futures Act (Chapter 289), as amended from time to time.
In respect of any matter arising from or in connection with the research you could contact the following representatives of Motilal Oswal Capital Markets Singapore Pte Limited:
Varun Kumar
Varun.kumar@motilaloswal.com
Contact : (+65) 68189232
Office Address:21 (Suite 31),16 Collyer Quay,Singapore 04931
Kadambari Balachandran
kadambari.balachandran@motilaloswal.com
(+65) 68189233 / 65249115
For U.S
13 August 2016
Motilal Oswal Tower, Level 9, Sayani Road, Prabhadevi, Mumbai 400 025
Phone: +91 22 3982 5500 E-mail: reports@motilaloswal.com
Motilal Oswal Securities Ltd
8