22 August 2016
1QFY17 Results Update | Sector: Real Estate
Oberoi Realty
Buy
BSE SENSEX
28,077
Bloomberg
Equity Shares (m)
M.Cap.(INRb)/(USDb)
52-Week Range (INR)
1, 6, 12 Rel. Per (%)
Avg Val, INRm
Free float (%)
S&P CNX
8,667
OBER IN
339.3
98.9 / 1.6
316 / 209
-2/13/15
66.0
27.5
CMP: INR298
TP: INR352(+18%)
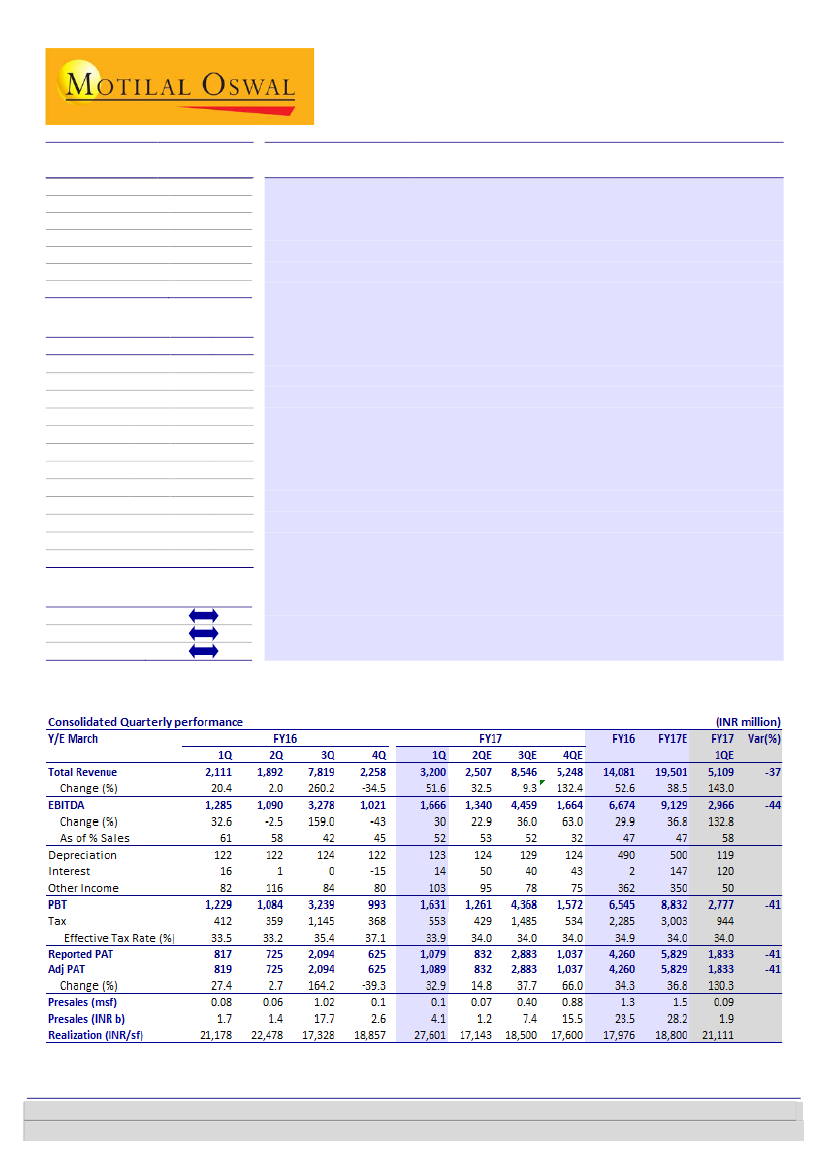
Operationally strong quarter, led by bookings in Three Sixty West
Strong P&L:
Revenue grew 52% YoY to INR3.2b, EBITDA grew 30% YoY to
INR1.7b, and PAT grew 30% YoY to INR1.1b. EBITDA margin shrank 9pp YoY but
expanded 6pp QoQ to 52%. The P&L strength is attributable to strong revenue
recognition from
Esquire
in 1QFY17. Rental income was down 1.3% QoQ/YoY to
INR0.7b, led by decline in rentals from
Westin.
Average monthly rental per
square foot from
Commerz II
Phase-I increased from INR117 in 4QFY16 to
INR122.
Three Sixty West boosts presales:
Presales were strong at 0.15msf (INR4.1b)
on bookings in
Three Sixty West
(58%), Borivli project (11%),
Exquisite
(10%),
Prisma
(9%), and
Esquire
(4%).
Collections down; gearing near zero:
Collections declined 26% YoY (and 36%
QoQ) to INR2.4b. Net debt went up by INR0.6b QoQ to INR2.7b (0.05x).
Financials & Valuations (INR b)
2016 2017E 2018E
Y/E Mar
Net Sales
14.1
19.5
33.9
EBITDA
6.7
9.1
20.1
Adj PAT
4.3
5.8
13.1
Adj EPS (INR)
13.0
17.8
39.9
EPS Growth (%)
34.3
36.8 124.7
BV/Share (INR) 156.3 170.0 203.9
RoE (%)
8.6
10.5
20.6
RoCE (%)
7.4
9.4
18.4
Payout (%)
18.6
20.4
12.1
P/E (x)
22.5
16.4
7.3
P/BV (x)
1.9
1.7
1.4
EV/EBITDA (x)
14.8
9.2
4.1
Preferred Mumbai play, Buy:
Despite a sluggish market, OBER’s new operating
cycle has been strong, with the success of
Three Sixty West
and its Borivli project.
This speaks volumes about the company’s brand equity, product attractiveness,
and cash flow strength. We maintain our positive bias on the stock. It trades at
16.8x FY17E EPS, 1.8x FY17E BV, and at an 18% discount to NAV of INR352.
Maintain
Buy;
OBER is our preferred Mumbai play.
Estimate change
TP change
Rating change
Aashumi Mehta
(Aashumi.Mehta@MotilalOswal.com); +91 22 6129 1537
Investors are advised to refer through important disclosures made at the last page of the Research Report.
Motilal Oswal research is available on www.motilaloswal.com/Institutional-Equities, Bloomberg, Thomson Reuters, Factset and S&P Capital.

Oberoi Realty
Exhibit 1: EBITDA margins (%) improved QoQ
1QFY15
90
70
50
30
10
Overall Annuity (incl Hotel)
Hotel
Dev Co
Source: Company, MOSL
(8.7)
(7.4)
(4.5) (4.7)
2QFY16
2QFY15
3QFY16
3QFY15
4QFY16
4QFY15
1QFY17
1QFY16
Exhibit 2: Net debt stood at INR2.7b, up INR0.6 b QoQ
6.0
7.4 7.1
6.1
2.1 3.0 2.1 2.7
Source: Company, MOSL
Exhibit 3:
Annuity income down 1.3%QoQ (INR m)
Exhibit 4:
Asset wise break up of annuity income (INR m)
Oberoi Mall (INR m)
Commerz (INR m)
Westin (INR m)
Source: Company, MOSL
Exhibit 5:
Strong pre-sales led by three sixty west
Sales value (INR b)
12.3
17.7
Exhibit 6:
Collections reduced as well (INR m)
3.0
2.1 2.2 2.2 2.2
0.9 0.8 0.6 1.1 1.4 1.0
1.7 1.4
4.06
2.65
Source: Company, MOSL
22 August 2016
2

Oberoi Realty
Valuation and views
Management’s strategy to monetize assets, till it recovers cost and then holding
the balance inventories to maximize profitability, has resulted into matured
unsold inventories in place viz. Commerz II, Oasis (Worli), and Exquisite.
New launches has led to to increase in presales/collections (up ~53% in FY16 v/s
FY15) while RoE/RoCE stood at 8.6%/11.4% vs~20% in FY11. Nonetheless, with
economic sentiment turning positive, it placed the company well prepared for
up-cycle with ready assets and accumulated benefits.
New operating cycle starting with huge success of Mulund, JVLR and Borvali
projects (in CY15) speak volumes on company’s brand equity, product
attractiveness and strength of cash flow in forthcoming period.
Despite, weak Mumbai market, we maintain our positive bias on the stock due
to visibility of sustenance of improving cash flows and P&L (RoE/RoCE of
15%/21% by FY17 v/s 8.6%/11.4% now).
Despite a sluggish market, OBER’s new operating cycle has been strong, with the
success of
Three Sixty West
and its Borivli project. This speaks volumes about
the company’s brand equity, product attractiveness, and cash flow strength. We
maintain our positive bias on the stock. It trades at 16.8x FY17E EPS, 1.8x FY17E
BV, and at an 18% discount to NAV of INR352. Maintain
Buy;
OBER is our
preferred Mumbai play.
Key triggers
Success in Worli launch and improvement in operating cash flow
Improvement in Mumbai realty market dynamics providing demand impetus
Key risk factors
Delay in incremental leasing at Commerz II
Regulatory uncertainties on account of DP Plan
Delay in new launches
Exhibit 8:
Project
-wise value contribution (%)
Exquisite,
10%
Esquire , 4%
Three sixty
west, 58%
Enigma, 6%
Exhibit 7: We estimate OBER’s NAV at INR337/share
Particulars
INR m
INR/sh
% GAV
Dev Co
Commercial
Retail
Hotel
Gross Asset Value
Net Cash
(-) Other Op Exp
(-) Tax
Net Asset Value
142,430
31,170
14,210
8,006
195,816
-2,133
15,665
58,745
119,273
420
92
42
24
577
-6
46
173
352
73
16
7
4
100
-1
8
30
61
Prisma, 9%
Sky City,
11%
Source: MOSL, Company
22 August 2016
3

Oberoi Realty
Story in charts
Exhibit 9:
Commerz
II leasing key levers to rentals (INR b)
4.3
3.3
2.1
2.2
2.5
2.6
2.7
18
9
0.7
FY11
Source: Company, MOSL
10
0.7
FY12
9
4
0.5
FY13
0.2
FY14
1.0
FY15
1.5
1.5
1.1
Exhibit 10:
New
operating cycle to trigger presales and CF
Presales (msf)
Presales (INR b)
27
28
26
1.8
0.7
0.8
FY16E FY17E FY18E
Source: Company, MOSL
Exhibit 11: Leveraging of balance sheet on new land
acquisition (INR b)
6.1
2.1
Exhibit 12: Re-leveraging and new launch should improve
return ratios (%)
27.6
18.6
22.7
17.9
18.9
27.6
27.7
19.9
19.9
13.1 12.8
13.1
12.8
7.2
7.3
6.3
7.0
7.4
9.4
RoE
RoCE
18.4
20.6
8.6 10.5
-2.3 -2.9 -1.7
-4.4
-12.9
-10.7
-4.8
-11.8
-13.1
15.9
-14.6
Source: Company, MOSL
FY13
7.8
2.2
-
2.7
0.9
2.2
0.7
1.5
0.6
1.7
0.3
1.4
1.8
(0.4)
1.2
(0.6)
0.8
(1.3)
FY14
3.5
2.5
0.9
2.1
(2.2)
2.4
0.9
1.7
0.7
(1.2)
0.3
(1.5)
1.5
(3.0)
2.6
(5.0)
0.8
(5.8)
FY15
9.0
1.1
0.5
2.9
5.4
2.4
0.8
1.6
0.9
6.1
0.2
5.9
1.7
4.2
13.9
(9.5)
0.8
(10.3)
FY16
16.9
4.6
-
3.5
8.8
2.7
0.9
1.8
1.1
9.5
0.3
9.2
2.3
7.0
5.8
4.8
0.8
4.0
FY17E
25.4
8.7
3.0
2.2
17.5
3.2
1.0
2.2
1.2
18.5
1.2
17.4
4.3
13.0
4.0
9.4
1.2
8.2
FY18E
20.0
10.3
11.9
-
21.5
4.2
1.3
2.9
1.3
23.1
1.3
21.8
6.7
15.1
5.0
10.5
1.6
8.9
Exhibit 13: Cash flow to improve gradually (INR b)
Oberoi cash flows to
improve when benefits of
matured assets and new
launches are accrued
Cash flow from sales
Dev Co (Ex Worli)
Construction (Ex Worli)
Worli inflow
Worli outflow
Dev Co
Rental
Opex
Rent Co
Admin
Operating surplus
Capex construction
Cash EBITDA
Tax expense
Core OCF
Fungible FSI
FCFE
Dividend
Net Surplus from core operation
22 August 2016
4

Oberoi Realty
Exhibit 14: Operating metrics
Annuity portfolio performance
Occupancy
EBITDA Margin
Rental/sf/month
Oberoi Mall (INR m)
Occupancy
EBITDA Margin
Rental/sf/month
Commerz (INR m)
Occupancy
EBITDA Margin
ARR (INR/day)
Westin (INR m)
Total rental income
EBITDA Margin (%)
Overall
Annuity (incl Hotel)
Hotel
Dev Co
Development Business
Sales volume (msf)
Sales value (INR b)
Average realization (INR/sf)
Collection (INR m)
Operating cash flow (INR m)
Construction
Splendor
Exquisite
Grande
Priviera
Esquire
Revenue booking
Priviera
Splendor
Exquisite
Grande
Rental
Total
-
-
1.0
-
0.6
1.8
-
0.0
1.1
-
0.6
1.9
0.7
2.2
0.7
3.4
0.7
2.1
0.7
1.9
0.7
7.8
0.7
2.3
0.7
3.2
1.3
1.6
1.2
0.9
0.3
0.4
0.4
100%
96%
100%
43%
0%
100%
98%
100%
43%
0%
100%
99%
100%
69%
0%
100%
100%
100%
100%
0%
100%
100%
100%
100%
0%
100%
100%
100%
100%
0%
100%
100%
100%
100%
39%
100%
100%
100%
100%
43%
100%
100%
100%
100%
53%
0.07
1.4
20,058
1,411
(343)
0.04
0.99
23,947
1,909
(1,224)
0.15
2.95
19,952
1,531
726
0.78
12.31
15,868
4,762
1,977
0.08
1.71
21,178
3,203
2,158
0.06
1.41
22,478
2,574
732
1.02
17.74
17,328
5,245
(728)
0.14
2.65
18,629
3,688
2,104
0.15
4.06
27,601
2,374
(356)
55.3
60.5
13.0
68.2
60.3
66.2
27.7
75.6
58.3
65.7
31.3
72.8
51.8
65.8
36.4
58.1
60.6
66.1
31.9
74.2
57.6
65.6
31.1
71.5
41.9
64.8
32.6
45.0
45.5
63.5
34.1
55.1
52.1
64.6
29.2
60.3
1QFY15
99%
96%
140
229
86%
100%
130
122
77.3%
13.0%
7,747
272
623
2QFY15
100%
97%
142
235
84%
100%
129
118
77.9%
27.7%
8,025
290
643
3QFY15
100%
96%
146
241
83%
100%
128
116
76.9%
31.3%
8,953
329
687
4QFY15
99%
96%
143
235
83%
100%
128
116
81.9%
36.4%
8,908
334
691
1QFY16
99%
95%
145
239
83%
100%
132
120
78.7%
31.9%
8,161
308
684
2QFY16
100%
96%
140
232
95%
100%
128
117
77.5%
31.1%
8,425
306
671
3QFY16
99%
95%
148
243
97%
100%
127
117
76.2%
32.6%
9,079
340
717
4QFY16
99%
94%
138
228
88%
99%
132
112
77.5%
34.1%
9,041
326
694
1QFY17
91%
93%
161.76
244
88%
99%
140.68
119
77.3%
29.2%
8,166
287
684
Source: MOSL, Company
22 August 2016
5

Oberoi Realty
Financials and Valuations
Income Statement
Y/E March
Net Sales
Change (%)
Construction exp.
Staff Cost
EBITDA
% of Net Sales
Depreciation
Interest
Other Income
PBT
Tax
Rate (%)
Adjusted PAT
Change (%)
2011
9,960
27.1
3,920
270
5,770
57.9
237
2
627
6,159
983
16.0
5,172
12.9
2012
8,247
(17.2)
3,083
329
4,835
58.6
269
3
1,501
6,063
1,430
23.6
4,629
(10.5)
2013
10,476
27.0
3,972
383
6,121
58.4
285
4
999
6,831
1,783
26.1
5,048
9.1
2014
7,985
(23.8)
3,194
442
4,348
54.5
272
3
571
4,644
1,533
33.0
3,111
(38.4)
2015
9,227
15.6
3,562
527
5,138
55.7
403
18
175
4,892
1,721
35.2
3,171
1.9
2016
14,081
52.6
6,873
533
6,674
47.4
490
2
362
6,545
2,285
34.9
4,260
34.3
2017E
19,501
38.5
9,786
586
9,129
46.8
500
147
350
8,832
3,003
34.0
5,829
36.8
(INR Million)
2018E
33,935
74.0
13,182
645
20,108
59.3
501
161
400
19,846
6,748
34.0
13,098
124.7
Balance Sheet
Y/E March
Share Capital
Reserves
Net Worth
Loans
Capital Employed
Gross Fixed Assets
Less: Depreciation
Net Fixed Assets
Capital WIP
Investments
Curr. Assets
Inventory
Debtors
Cash & Bank Balance
Loans & Advances
Current Liab. & Prov.
Creditors
Provisions
Net Current Assets
Misc. Expenses
Application of Funds
E: MOSL Estimates
2011
3,282
29,834
33,476
-
33,476
7,996
415
7,581
1,728
650
29,947
7,906
468
13,990
7,583
6,438
6,029
410
23,508
-
33,476
2012
3,282
34,059
37,342
-
37,420
7,687
678
7,009
2,841
-
35,342
10,360
679
12,934
11,368
10,426
9,642
783
24,916
-
37,420
2013
3,282
38,339
41,621
-
41,769
7,796
929
6,867
3,848
0
39,522
12,580
522
10,725
15,695
11,121
10,331
790
28,400
-
41,769
2014
3,282
40,682
43,964
761
44,944
7,849
1,192
6,658
4,337
496
40,805
16,545
862
5,078
18,321
10,007
9,138
869
30,799
-
44,944
2015
3,282
43,061
46,343
9,061
55,646
11,743
1,595
10,148
218
0
58,180
34,853
828
2,937
19,562
15,554
14,713
841
42,627
-
55,646
2016
3,393
49,650
53,043
6,086
59,357
8,225
2,085
6,140
-
744
63,889
39,573
1,170
3,209
19,938
18,240
18,197
44
45,649
-
59,357
2017E
3,393
54,288
57,681
8,570
66,480
8,225
2,294
5,932
945
-
76,495
35,422
1,229
20,344
19,501
19,547
19,501
46
56,949
-
66,480
(INR Million)
2018E
3,393
65,799
69,192
7,499
76,919
8,225
2,523
5,702
2,256
-
95,200
47,893
1,290
20,565
25,451
28,893
28,845
48
66,307
-
76,919
22 August 2016
6

Oberoi Realty
Financials and Valuations
Ratios
Y/E March
Basic (INR)
Adjusted EPS
Growth (%)
Cash EPS
Book Value
DPS
Payout (incl. Div. Tax.)
Valuation (x)
P/E
Cash P/E
EV/EBITDA
EV/Sales
Price/Book Value
Dividend Yield (%)
Profitability Ratios (%)
RoE
RoCE
RoIC
Turnover Ratios
Debtors (Days)
Asset Turnover (x)
Leverage Ratio
Debt/Equity (x)
2011
15.8
12.9
16.5
102.0
1.0
7.3
2012
14.1
(10.5)
14.9
113.8
2.0
16.6
2013
15.4
9.1
16.2
126.8
2.0
15.2
2014
9.5
(38.4)
10.3
133.9
2.0
24.7
2015
9.7
1.9
10.9
141.2
2.0
24.2
2016
13.0
34.3
14.5
156.3
2.0
18.6
2017E
17.8
36.8
19.3
170.0
3.0
20.4
2018E
39.9
124.7
41.4
203.9
4.0
12.1
19.4
18.3
14.2
8.3
2.4
0.7
31.4
28.9
21.5
11.7
2.2
0.7
30.8
27.4
20.2
11.3
2.1
0.7
23.0
20.6
15.1
7.2
1.9
0.7
16.8
15.5
9.4
4.4
1.8
1.0
7.5
7.2
4.2
2.5
1.5
1.3
19.9
19.9
35.5
17
0.3
13.1
13.1
18.0
30
0.2
12.8
12.8
17.7
18
0.3
7.3
7.2
8.8
39
0.2
7.0
6.3
7.0
33
0.2
8.6
7.4
7.5
30
0.2
10.5
9.4
11.3
23
0.3
20.6
18.4
26.1
14
0.4
-
-
-
0.0
0.2
0.1
0.1
0.1
Cash Flow Statement
Y/E March
PBT before Extraordinary Items
Add : Depreciation
Interest
Less : Direct Taxes Paid
(Inc)/Dec in WC
CF from Operations
(Inc)/Dec in FA
Free Cash Flow
(Pur)/Sale of Investments
CF from Investments
(Inc)/Dec in Net Worth
(Inc)/Dec in Debt
Less : Interest Paid
Dividend Paid
CF from Fin. Activity
Inc/Dec of Cash
Add: Beginning Balance
Closing Balance
E: MOSL Estimates
2011
6,159
237
2
983
3,474
1,936
(1,364)
572
140
(1,224)
10,037
-
2
377
9,658
10,359
3,631
13,990
2012
6,059
269
3
1,430
2,464
2,438
(3,458)
(1,020)
650
(2,808)
92
-
3
768
(679)
(1,056)
13,990
12,934
2013
6,831
285
4
1,783
5,694
(357)
(1,116)
(1,473)
(0)
(1,116)
69
-
4
768
(703)
(2,209)
12,934
10,725
2014
4,644
272
3
1,533
8,045
(4,660)
(543)
(5,203)
(496)
(1,039)
72
761
3
768
62
(5,647)
10,725
5,078
2015
4,892
403
18
1,721
13,969
(10,377)
226
(10,151)
496
722
(1)
8,300
18
768
7,513
(2,141)
5,078
2,937
2016
6,545
490
2
2,285
2,751
2,001
3,735
5,736
(744)
2,991
3,220
(2,975)
2
794
(550)
4,442
2,937
7,379
2017E
8,832
500
147
3,003
(5,835)
12,021
(945)
11,076
744
(201)
(0)
2,484
147
1,191
1,146
12,965
3,209
16,174
(INR Million)
2018E
19,846
501
161
6,748
9,137
4,332
(1,311)
3,022
-
(1,311)
0
(1,071)
161
1,588
(2,819)
221
20,344
20,565
22 August 2016
7

Oberoi Realty
Corporate profile
Company description
Exhibit 1: Sensex rebased
Oberoi Realty Limited is a Mumbai-based real
estate developer. It was incorporated in May 1998
as Kingston Properties Private Ltd. ORL's primary
focus is to develop residential property but it has
diversified into retail, commercial, hospitality and
social infrastructure projects. ORL has delivered
~5msf of RE development across 35 projects so far.
Source: MOSL/Bloomberg
Exhibit 2: Shareholding pattern (%)
Jun-16
Promoter
DII
FII
Others
72.5
0.7
22.1
4.7
Mar-16
72.6
0.8
21.3
5.4
Jun-15
75.0
2.9
17.0
5.2
Source: Capitaline
Exhibit 3: Top holders
Holder Name
Aranda Investments (Mauritius) Pte Ltd
SSIII Indian Investments Two Ltd
Morgan Stanley Asia (Singapore)Pte
Stichting Depositary Apg Emerging Markets
Equity Pool
Oppenheimer International Small Company
Fund
% Holding
3.7
3.3
1.6
1.5
1.4
Source: Capitaline
Note: FII Includes depository receipts
Exhibit 4: Top management
Name
Vikas Oberoi
Saumil Daru
Bhaskar Kshirsagar
Designation
Chairman & Managing director
Director (Finance) & CFO
Company Secretary
Exhibit 5: Directors
Name
Anil Harish
Karamjit Singh Kalsi
Venkatesh Mysore
Name
Bindu Oberoi
Tilokchand P Ostwal
Source: Capitaline
*Independent
Exhibit 6: Auditors
Name
P Raj & Co
Type
Statutory
Exhibit 7: MOSL forecast v/s consensus
EPS
(INR)
FY17
FY18
MOSL
forecast
17.8
39.9
Consensus
forecast
18.4
32.4
Variation
(%)
-3.4
23.0
Source: Bloomberg
Source: Capitaline
22 August 2016
8

Oberoi Realty
NOTES
22 August 2016
9

Disclosures
This document has been prepared by Motilal Oswal Securities Limited (hereinafter referred to as Most) to provide information about the company (ies) and/sector(s), if any, covered in the report and may
Oberoi Realty
be distributed by it and/or
its affiliated company(ies). This report is for personal information of the selected recipient/s and does not construe to be any investment, legal or taxation advice to you. This research report does not constitute an offer, invitation or
inducement to invest in securities or other investments and Motilal Oswal Securities Limited (hereinafter referred as MOSt) is not soliciting any action based upon it. This report is not for public distribution and has been furnished to
you solely for your general information and should not be reproduced or redistributed to any other person in any form. This report does not constitute a personal recommendation or take into account the particular investment
objectives, financial situations, or needs of individual clients. Before acting on any advice or recommendation in this material, investors should consider whether it is suitable for their particular circumstances and, if necessary, seek
professional advice. The price and value of the investments referred to in this material and the income from them may go down as well as up, and investors may realize losses on any investments. Past performance is not a guide
for future performance, future returns are not guaranteed and a loss of original capital may occur.
MOSt and its affiliates are a full-service, integrated investment banking, investment management, brokerage and financing group. We and our affiliates have investment banking and other business relationships with a some
companies covered by our Research Department. Our research professionals may provide input into our investment banking and other business selection processes. Investors should assume that MOSt and/or its affiliates are
seeking or will seek investment banking or other business from the company or companies that are the subject of this material and that the research professionals who were involved in preparing this material may educate
investors on investments in such business . The research professionals responsible for the preparation of this document may interact with trading desk personnel, sales personnel and other parties for the purpose of gathering,
applying and interpreting information. Our research professionals are paid on twin parameters of performance & profitability of MOSt.
MOSt generally prohibits its analysts, persons reporting to analysts, and members of their households from maintaining a financial interest in the securities or derivatives of any companies that the analysts cover. Additionally,
MOSt generally prohibits its analysts and persons reporting to analysts from serving as an officer, director, or advisory board member of any companies that the analysts cover. Our salespeople, traders, and other professionals or
affiliates may provide oral or written market commentary or trading strategies to our clients that reflect opinions that are contrary to the opinions expressed herein, and our proprietary trading and investing businesses may make
investment decisions that are inconsistent with the recommendations expressed herein. In reviewing these materials, you should be aware that any or all of the foregoing among other things, may give rise to real or potential
conflicts of interest. MOSt and its affiliated company(ies), their directors and employees and their relatives may; (a) from time to time, have a long or short position in, act as principal in, and buy or sell the securities or derivatives
thereof of companies mentioned herein. (b) be engaged in any other transaction involving such securities and earn brokerage or other compensation or act as a market maker in the financial instruments of the company(ies)
discussed herein or act as an advisor or lender/borrower to such company(ies) or may have any other potential conflict of interests with respect to any recommendation and other related information and opinions.; however the
same shall have no bearing whatsoever on the specific recommendations made by the analyst(s), as the recommendations made by the analyst(s) are completely independent of the views of the affiliates of MOSt even though
there might exist an inherent conflict of interest in some of the stocks mentioned in the research report
Reports based on technical and derivative analysis center on studying charts company's price movement, outstanding positions and trading volume, as opposed to focusing on a company's fundamentals and, as such, may not
match with a report on a company's fundamental analysis. In addition MOST has different business segments / Divisions with independent research separated by Chinese walls catering to different set of customers having various
objectives, risk profiles, investment horizon, etc, and therefore may at times have different contrary views on stocks sectors and markets.
Unauthorized disclosure, use, dissemination or copying (either whole or partial) of this information, is prohibited. The person accessing this information specifically agrees to exempt MOSt or any of its affiliates or employees from,
any and all responsibility/liability arising from such misuse and agrees not to hold MOSt or any of its affiliates or employees responsible for any such misuse and further agrees to hold MOSt or any of its affiliates or employees free
and harmless from all losses, costs, damages, expenses that may be suffered by the person accessing this information due to any errors and delays. The information contained herein is based on publicly available data or other
sources believed to be reliable. Any statements contained in this report attributed to a third party represent MOSt’s interpretation of the data, information and/or opinions provided by that third party either publicly or through a
subscription service, and such use and interpretation have not been reviewed by the third party. This Report is not intended to be a complete statement or summary of the securities, markets or developments referred to in the
document. While we would endeavor to update the information herein on reasonable basis, MOSt and/or its affiliates are under no obligation to update the information. Also there may be regulatory, compliance, or other reasons
that may prevent MOSt and/or its affiliates from doing so. MOSt or any of its affiliates or employees shall not be in any way responsible and liable for any loss or damage that may arise to any person from any inadvertent error in
the information contained in this report. MOSt or any of its affiliates or employees do not provide, at any time, any express or implied warranty of any kind, regarding any matter pertaining to this report, including without limitation
the implied warranties of merchantability, fitness for a particular purpose, and non-infringement. The recipients of this report should rely on their own investigations.
This report is intended for distribution to institutional investors. Recipients who are not institutional investors should seek advice of their independent financial advisor prior to taking any investment decision based on this report or
for any necessary explanation of its contents.
Most and it’s associates may have managed or co-managed public offering of securities, may have received compensation for investment banking or merchant banking or brokerage services, may have received any compensation
for products or services other than investment banking or merchant banking or brokerage services from the subject company in the past 12 months.
Most and it’s associates have not received any compensation or other benefits from the subject company or third party in connection with the research report.
Subject Company may have been a client of Most or its associates during twelve months preceding the date of distribution of the research report
MOSt and/or its affiliates and/or employees may have interests/positions, financial or otherwise of over 1 % at the end of the month immediately preceding the date of publication of the research in the securities mentioned in this
report. To enhance transparency, MOSt has incorporated a Disclosure of Interest Statement in this document. This should, however, not be treated as endorsement of the views expressed in the report.
Motilal Oswal Securities Limited is registered as a Research Analyst under SEBI (Research Analyst) Regulations, 2014. SEBI Reg. No. INH000000412
Pending Regulatory inspections against Motilal Oswal Securities Limited:
SEBI pursuant to a complaint from client Shri C.R. Mohanraj alleging unauthorized trading, issued a letter dated 29th April 2014 to MOSL notifying appointment of an Adjudicating Officer as per SEBI regulations to hold inquiry and
adjudge violation of SEBI Regulations; MOSL replied to the Show Cause Notice whereby SEBI granted us an opportunity of Inspection of Documents. Since all the documents requested by us were not covered we have requested
to SEBI vide our letter dated June 23, 2015 to provide pending list of documents for inspection.
List of associate companies of Motilal Oswal Securities Limited -
Click here to access detailed report
Analyst Certification
The views expressed in this research report accurately reflect the personal views of the analyst(s) about the subject securities or issues, and no part of the compensation of the research analyst(s) was, is, or will be directly or
indirectly related to the specific recommendations and views expressed by research analyst(s) in this report. The research analysts, strategists, or research associates principally responsible for preparation of MOSt research
receive compensation based upon various factors, including quality of research, investor client feedback, stock picking, competitive factors and firm revenues
Disclosure of Interest Statement
Analyst ownership of the stock
Served as an officer, director or employee -
OBEROI REALTY
No
No
A graph of daily closing prices of securities is available at www.nseindia.com and http://economictimes.indiatimes.com/markets/stocks/stock-quotes
Regional Disclosures (outside India)
This report is not directed or intended for distribution to or use by any person or entity resident in a state, country or any jurisdiction, where such distribution, publication, availability or use would be contrary to law, regulation or
which would subject MOSt & its group companies to registration or licensing requirements within such jurisdictions.
For Hong Kong:
This report is distributed in Hong Kong by Motilal Oswal capital Markets (Hong Kong) Private Limited, a licensed corporation (CE AYY-301) licensed and regulated by the Hong Kong Securities and Futures
Commission (SFC) pursuant to the Securities and Futures Ordinance (Chapter 571 of the Laws of Hong Kong) “SFO”. As per SEBI (Research Analyst Regulations) 2014 Motilal Oswal Securities (SEBI Reg No. INH000000412)
has an agreement with Motilal Oswal capital Markets (Hong Kong) Private Limited for distribution of research report in Kong Kong. This report is intended for distribution only to “Professional Investors” as defined in Part I of
Schedule 1 to SFO. Any investment or investment activity to which this document relates is only available to professional investor and will be engaged only with professional investors.” Nothing here is an offer or solicitation of
these securities, products and services in any jurisdiction where their offer or sale is not qualified or exempt from registration. The Indian Analyst(s) who compile this report is/are not located in Hong Kong & are not conducting
Research Analysis in Hong Kong.
For U.S.
Motilal Oswal Securities Limited (MOSL) is not a registered broker - dealer under the U.S. Securities Exchange Act of 1934, as amended (the"1934 act") and under applicable state laws in the United States. In addition MOSL is
not a registered investment adviser under the U.S. Investment Advisers Act of 1940, as amended (the "Advisers Act" and together with the 1934 Act, the "Acts), and under applicable state laws in the United States. Accordingly, in
the absence of specific exemption under the Acts, any brokerage and investment services provided by MOSL, including the products and services described herein are not available to or intended for U.S. persons.
This report is intended for distribution only to "Major Institutional Investors" as defined by Rule 15a-6(b)(4) of the Exchange Act and interpretations thereof by SEC (henceforth referred to as "major institutional investors"). This
document must not be acted on or relied on by persons who are not major institutional investors. Any investment or investment activity to which this document relates is only available to major institutional investors and will be
engaged in only with major institutional investors. In reliance on the exemption from registration provided by Rule 15a-6 of the U.S. Securities Exchange Act of 1934, as amended (the "Exchange Act") and interpretations thereof by
the U.S. Securities and Exchange Commission ("SEC") in order to conduct business with Institutional Investors based in the U.S., MOSL has entered into a chaperoning agreement with a U.S. registered broker-dealer, Motilal
Oswal Securities International Private Limited. ("MOSIPL"). Any business interaction pursuant to this report will have to be executed within the provisions of this chaperoning agreement.
The Research Analysts contributing to the report may not be registered /qualified as research analyst with FINRA. Such research analyst may not be associated persons of the U.S. registered broker-dealer, MOSIPL, and
therefore, may not be subject to NASD rule 2711 and NYSE Rule 472 restrictions on communication with a subject company, public appearances and trading securities held by a research analyst account.
For Singapore
Motilal Oswal Capital Markets Singapore Pte Limited is acting as an exempt financial advisor under section 23(1)(f) of the Financial Advisers Act(FAA) read with regulation 17(1)(d) of the Financial Advisors Regulations and is a
subsidiary of Motilal Oswal Securities Limited in India. This research is distributed in Singapore by Motilal Oswal Capital Markets Singapore Pte Limited and it is only directed in Singapore to accredited investors, as defined in the
Financial Advisers Regulations and the Securities and Futures Act (Chapter 289), as amended from time to time.
In respect of any matter arising from or in connection with the research you could contact the following representatives of Motilal Oswal Capital Markets Singapore Pte Limited:
Varun Kumar
Varun.kumar@motilaloswal.com
Contact : (+65) 68189232
Office Address:21 (Suite 31),16 Collyer Quay,Singapore 04931
Kadambari Balachandran
kadambari.balachandran@motilaloswal.com
(+65) 68189233 / 65249115
22 August 2016
Motilal Oswal Tower, Level 9, Sayani Road, Prabhadevi, Mumbai 400 025
Phone: +91 22 3982 5500 E-mail: reports@motilaloswal.com
Motilal Oswal Securities Ltd
10