27 August 2016
1QFY17 Results Update | Sector: Automobiles
Tata Motors
Buy
BSE SENSEX
27,782
Bloomberg
Equity Shares (m)
M.Cap.(INR b)/(USD b)
52-Week Range (INR)
1, 6, 12 Rel. Per (%)
Avg Val, (INR m)
Free float (%)
S&P CNX
8,573
TTMT IN
3,395.9
1,710.3 / 25.5
522/266
1/47/41
4,037
67.0
CMP: INR504
TP: INR562 (+12%)
Below estimates; JLR Margins impacted by lower China incentive & MTM
Fx impact; Expect recovery from 2QFY17
Financials & Valuations (INR b)
Y/E Mar
2016 2017E
Net Sales
2,755.6 2,879.2
EBITDA
402.4
410.2
NP
125.2
134.5
Adj.EPS(INR)
36.9
39.6
EPS Gr. (%)
-15.5
7.5
BV/Sh. (INR)
237.9
276.5
RoE (%)
18.3
15.4
RoCE (%)
14.3
11.2
P/E (x)
13.7
12.7
P/BV (x)
2.1
1.8
Estimate change
TP change
Rating change
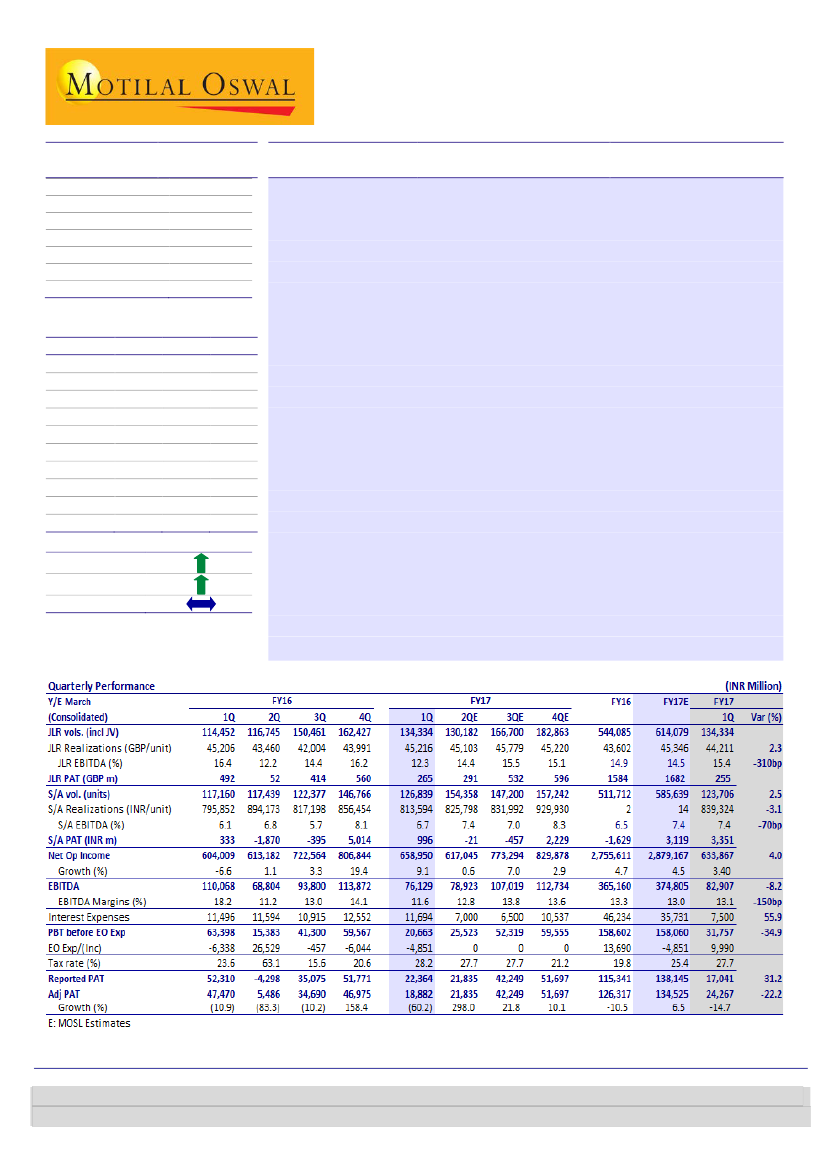
Consol
sales at INR659b (v/s est INR633b; +9% YoY). EBITDA at INR76.2b (v/s
est INR82.9b; +12% YoY). Adj. PAT at INR18.8b (v/s est INR24.3b; -60% YoY).
JLR
realization at GBP45k (v/s est GBP44k) grew 2.8% QoQ (flat YoY) driven by
favorable Fx. EBITDA margins at 12.3% (v/s est ~15.4%) were impacted due to
MTM impact on payables (~150bp impact), lower incentives in China (~100bp
impact) and partly due to launch expenses. However, adj PAT came in at
2018E
GBP265m (v/s est ~GBP255m) boosted by higher share of Cherry JV profits
3,242.4
and lower depreciation and Fx gains.
487.6
182.6
S/A
EBITDA margins (ex JV) were at 5.7% (v/s est 7.4%), decline of 240bp QoQ
53.8
(-40bp YoY) due to higher staff cost. Adj PAT was at INR996m (v/s est ~INR
35.7
3.35b) declined by 80% QoQ.
327.0
Earnings call highlights:
a) Other expenses had Fx loss on realized hedges of
17.8
GBP123m, there was commensurate benefit reflecting in sales. b)
China JV:
13.0
Margins are strong, but will moderate due to additional cost as full capacity
9.4
1.5
commissions. c) F-Pace has average waiting period of 3-4 months.
Valuation & view:
While we raise our EPS for FY17 by 8%, we cut FY18 by 5%. The
stock trades at 9.2x/7.3x FY17/18E consol EPS. We expect JLR’s operating
performance to start improving from 2QFY17, driven by continued volume
momentum and gradual benefit of weaker GBP. S/A business should benefit from
CV cycle recovery and favorable product lifecycle for PV business. Maintain
Buy.
Jinesh Gandhi
(Jinesh@MotilalOswal.com); +91 22 3982 5416
Venil Shah
(Venil.Shah@MotilalOswal.com); +91 22 3982 5445
/Aditya Vora
(Aditya.Vora@MotilalOswal.com); +91 22 3078 4701
Investors are advised to refer through important disclosures made at the last page of the Research Report.
Motilal Oswal research is available on www.motilaloswal.com/Institutional-Equities, Bloomberg, Thomson Reuters, Factset and S&P Capital.