Reliance Industries
BSE SENSEX
28,423
S&P CNX
8,775
1 September 2016
Update | Sector: Oil & Gas
CMP: INR1,029
TP: INR1,129(+10%)
Jio tariffs + mass trial offerings announced
Neutral
Targeting 100m subscribers soon; early trends to dictate long-term
outlook
Stock Info
Bloomberg
Equity Shares (m)
M.Cap.(INRb)/(USDb)
52-Week Range (INR)
1, 6, 12 Rel. Per (%)
Avg Val, INRm
Free float (%)
RIL IN
3,234.0
3,327.8 / 49.7
1090 / 825
0/-13/12
3785
54.9
Financials & Valuations (INR b)
Y/E Mar
Net Sales
EBITDA
PAT
EPS (INR)
Gr. (%)
BV/Sh (INR)
RoE (%)
RoCE (%)
P/E (x)
P/BV (x)
EV/EBITDA(x)
2016
2,332
401.4
274.2
93.6
20.7
818.4
12.0
11.1
12.2
1.3
8.5
2017E
2,706
475.5
313.3
105.6
14.3
12.4
11.9
10.8
1.1
6.9
2018E
3,118
567.0
356.4
120.1
13.7
12.6
12.6
9.5
1.0
6.0
Reliance Industries’ (RIL) CMD Mukesh Ambani announced the much-awaited
details on its telecom venture Jio in terms of tariffs and likely commercial launch
dates at its AGM.
RIL will offer Jio services on complementary basis from September 5 till December
31, 2016, implying commercial launch in January 2017.
On the commissioning of on-track core projects, petcoke gasification will complete
in 1HCY17 versus earlier expectation of 2HFY17.
RIL’s strategy to move away from cyclical commodity earnings to annuity-like
businesses will play out in coming years as it tries to profitably scale its telecom and
retail businesses. RIL’s FY17 earnings will be function of GRM trend, while telecom
launch and its success will drive the stock price movement.
Telecom tariffs announced; core projects largely on track
898.5 1,001.1
Shareholding pattern (%)
As on
Mar-16 Dec-15 Mar-15
Promoter
DII
FII
Others
45.2
12.8
22.5
19.5
45.2
13.2
21.9
19.7
45.2
12.6
22.0
20.2
Mass-scale trial offering from September 5:
RIL will launch the Jio Welcome
Offer on September 5, 2016, wherein users will have access to unlimited LTE
data and national voice, video and messaging services free of cost till
December 31, 2016. LYF brand handsets will be available from INR2,999. Plans
will begin from INR19/day and will have tariff of INR25-50/GB, depending on
usage. RIL will charge only for data usage and not voice.
Targeting 100m subscribers soon:
RIL targets to reach 100m customers at
fastest pace.
Core projects largely on track:
RIL’s USD18.5b core projects after some delays
(not alarming against the backdrop of scale/complexity) are set to commission
fully by 1HCY17.
We believe that RJio’s welcome offer of free data and voice over the next four
months should lead to a significant shift in traffic away from incumbents
(driven by 2
nd
SIM phenomenon). However, commercial offerings post Dec-16
could potentially alter the competitive dynamics in the telecom industry.
We expect RJio’s subscriber base to reach 75m by FY19E (75% of
management’s 100m target with ARPU of INR 244). With these workings, we
expect RJio to break even in the third year at EBITDA level.
RIL’s recent capital allocation had been skewed toward non-core businesses to
ring-fence its earnings from cyclical businesses. Now with non-core forming
40% of CE, successful consummation of core capex and telecom venture is
critical.
On FY18E basis, the stock trades at 9.3x adj. SA EPS of INR120 and EV/EBITDA
of 5.9x.
Neutral.
Our (telecom analyst) view on Jio (Link to detailed note on telecom)
FII Includes depository receipts
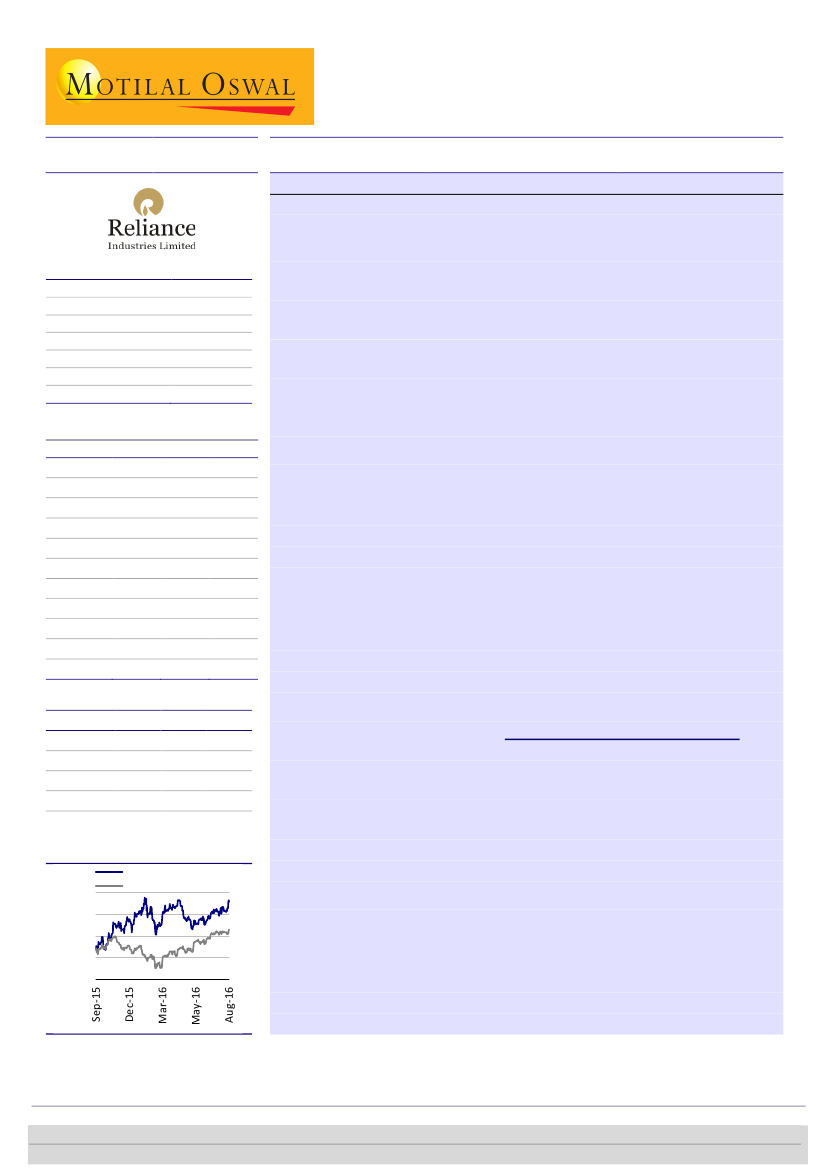
Stock Performance (1-year)
Reliance Inds.
Sensex - Rebased
1,100
1,000
900
800
700
Valuations and view
Investors are advised to refer through important disclosures made at the last page of the Research Report.
Motilal Oswal research is available on www.motilaloswal.com/Institutional-Equities, Bloomberg, Thomson Reuters, Factset and S&P Capital.
Harshad Borawake
(HarshadBorawake@MotilalOswal.com); +91 22 6129 1529
Abhinil Dahiwale
(Abhinil.Dahiwale@motilaloswal.com); +91 22 3980 4309

Reliance Industries
Key announcements at AGM
India will be among top 10 post RJio launch in mobile internet accessibility v/s
155 now.
RJio will cover 18,000 cities and two lakh villages (90% of India’s population) by
March 2017.
4G LTE devices now available at INR4,000. Will also be available at INR2,999.
RJio has launched Jio Fi (personal router) for INR1,999.
RJio customers will get complimentary (content) subscription worth INR15,000
for one year.
RJio will be launched through Aadhar-based sign up. Customers can get
connection in 15 minutes.
Tariff plans
Customers should pay only for one service: voice or data. RJio customers will get
voice services for free.
RJio data pricing to be 1/10th of current pricing in market. Free data at night.
To roll out wifi hot spots across India. 25% more data to students.
JIO welcome offer
Free RJio service from September 5 to December 31, 2016.
Capacity to take 1m customers per day.
Fiber to Home in select cities: Speed up to 1GB per second.
Average age of RJio employee is 30 years.
Target to reach 100m subscribers at the earliest (wants to make world record).
Onus on incumbents to provide access to RJio customers. Asks to provide
interconnect and MNP ports without hurdles.
Exhibit 1: New projects to drive RIL’s next growth phase; capex estimate increased marginally
Project
Refinery off-gases cracker
(ROGC)
Integrated gasification
combined cycle (IGCC)
Polyester expansion
Ethane sourcing
Total
~5
1.5
~18.5
Source: Company, MOSL
~6
Capex (USD b)
~6
Feedstock’s
Refinery off-gases
(From CDU, FCC etc.)
Petcoke
(From delayed coker unit)
PX, PFY, PSF, PET
Replacing domestic gas and high cost propane/naphtha
Petrochemicals, Power, Steam, Chemicals
Key products
Petrochemicals (mainly ethylene chain)
1 September 2016
2

Reliance Industries
Exhibit 2:
Status update of ongoing core business capex plans
Current
In KTPA
Refinery Off-gas Cracker
Ethylene
Propylene
LDPE
LLDPE
Benzene
PP
Polyesters
PFY
PTY
PSF
PET
Polyester Intermediates
Paraxylene
PTA
MEG
Rubber Division
PBR
SBR
Butyl Rubber
HPIB
74
40
150
100
105
114
150
100
105
Source: Company, MOSL
Commissioned in 4QFY14
July-Sept 2014 (2QFY15)
Commissioning by 2016
1,830
2,050
733
2,470
2,296
730
4,300
4,346
1,463
Full commissioning by 2Q/3QFY17 (v/s initial planned
expansion of 1.9MMT)
Commissioned
4QFY16, in interim could purchase feedstock
670
153
692
290
395
140
346
648
1,065
293
1,038
938
Phase 1 commissioned; Phase 2 in Dec 2015
Commissioned
Commissioned
1,883
759
190
928
419
2,100
1,365
154
400
550
453
135
3,248
913
590
1,478
872
2,235
3QFY17
3QFY17
3QFY17
3QFY17
Along with PX line
3QFY17
Capacity
Planned
Expansion
Total
Status /
Likely production start
1 September 2016
3

Reliance Industries
Financials and Valuations
RIL - Income Statement
Y/E March
Net Sales
RM Cons & Purchases
Change in Stocks
Employee Costs
Other Expenditure
EBITDA
% of Net Sales
Depreciation
Interest
Other Income
PBT
Tax
Rate* (%)
PAT
Adj. PAT
Change (%)
Key Operating Metrics
GRM (USD/bbl)
KG-D6 production (mmscmd)
(INR Billion)
2018E
3,118
2,292
0
46
214
567
18.2
150
43
93
467
111
23.7
356
356
13.7
11.6
8.5
(INR Billion)
2018E
33
2,937
2,970
1,070
149
4,189
3,907
1,579
2,328
108
1,455
1,005
352
55
295
303
707
618
89
298
4,189
2011
2,482
1,947
-32
26
160
381
15.4
136
23
31
252
50
19.6
203
203
24.9
8.4
56.2
2012
3,299
2,763
-9
29
180
336
10.2
114
27
62
258
57
22.2
200
200
-1.2
8.6
42.6
2013
3,603
3,066
-33
34
228
308
8.5
95
30
80
263
53
20.1
210
210
4.8
9.2
26.5
2014
3,901
3,298
4
34
256
309
7.9
88
32
89
278
58
21.0
220
220
4.7
8.5
13.8
2015
3,291
2,631
19
37
287
316
9.6
85
24
87
295
67
22.9
227
227
3.3
8.8
12.2
2016
2,332
1,570
42
41
277
401
17.2
96
25
76
357
83
23.2
274
274
20.7
10.8
10.8
2017E
2,706
1,990
-17
43
215
475
17.6
118
34
87
411
97
23.7
313
313
14.3
11.0
8.6
Balance Sheet
Y/E March
Share Cap. (incl sh. Susp.)
Reserves
Net Worth
Total Loans
Deferred Tax
Capital Employed
Gross Fixed Assets
Less: Depreciation
Net Fixed Assets
Capital WIP
Investments
Curr. Assets, L & Adv.
Inventory
Debtors
Cash & Bank Balance
Loans&Adv.and Other CA
Current Liab. & Prov.
Liabilities
Provisions
Net Current Assets
Application of Funds
E: MOSL Estimates
2011
33
1483
1,515
674
116
2,305
2213
785
1,427
128
377
915
298
174
271
171
542
497
46
373
2,305
2012
33
1628
1,661
684
121
2,466
2055
918
1,137
78
540
1197
360
184
396
257
485
442
43
712
2,466
2013
32
1768
1,800
724
122
2,646
2132
1034
1,097
191
525
1371
427
119
495
330
539
495
43
832
2,646
2014
32
1,939
1,971
855
122
2,948
2,226
1,132
1,094
417
895
1,270
429
107
332
402
728
686
42
542
2,948
2015
32
2,129
2,162
976
127
3,265
2,361
1,215
1,146
758
1,126
949
366
47
116
421
713
651
63
236
3,265
2016E
32
2,366
2,398
1,070
132
3,600
2,634
1,311
1,323
1,017
1,392
762
280
35
160
287
894
820
74
(133)
3,600
2017E
33
2,633
2,666
1,070
140
3,876
3,667
1,429
2,238
239
1,423
972
315
37
325
295
997
916
81
(25)
3,876
1 September 2016
4

Reliance Industries
Financials and Valuations
Ratios
Y/E March
Basic (INR)
EPS
Adj. EPS (ex Treasury)
Cash EPS
Adj. Book Value
DPS
Payout (incl. Div. Tax.)
Valuation (x)
P/E
Adj. P/E
Cash P/E
EV / EBITDA
EV / Sales
Adj. P/B
Dividend Yield (%)
Profitability Ratios (%)
RoE
RoCE
RoIC
Turnover Ratios
Debtors (No. of Days)
Fixed Asset Turnover (x)
Leverage Ratio
Net Debt / Equity (x)
2011
62.0
68.4
103.5
511.2
8.0
13.7
2012
61.3
67.7
96.1
560.7
8.5
14.7
2013
65.0
71.9
94.4
616.5
9.0
14.6
2014
68.0
75.2
95.2
674.2
9.5
16.4
2015E
70.2
77.6
96.4
738.5
10.0
16.7
14.7
13.3
10.7
11.3
1.1
1.4
1.0
14.8
12.9
12.5
21
1.1
13.0
12.1
11.6
20
1.5
12.3
11.6
11.8
15
1.7
11.7
11.1
12.8
11
1.8
11.0
10.2
13.9
8
1.4
2016E
84.6
93.6
114.2
818.4
12.1
16.7
12.2
11.0
9.0
8.5
1.5
1.3
1.2
12.0
11.1
20.4
6
0.9
2017E
95.7
105.6
131.7
898.5
13.6
16.6
10.8
9.7
7.8
6.9
1.2
1.1
1.3
12.4
11.9
18.7
5
0.9
2018E
108.8
120.1
154.7
1,001.1
15.5
16.7
9.5
8.6
6.7
6.0
1.1
1.0
1.5
12.6
12.6
15.1
5
0.8
0.2
0.0
-0.1
0.0
0.1
0.0
0.0
0.0
Cash Flow Statement
Y/E March
OP/(Loss) before Tax
Depreciation (excl. revaluation)
Interest expense
Direct Taxes Paid
(Inc)/Dec in Wkg. Capital
Interest/other income
Other op activities
CF from Op. Activity
(Inc)/Dec in FA & CWIP
Free Cash Flow
(Pur)/Sale of Investments
Interest/other income
Other In activities
CF from Inv. Activity
Change in Equity
Inc / (Dec) in Debt
Dividends Paid
CF from Fin. Activity
Inc / ( Dec) in Cash
Add: Opening Balance
Add: On Amalgamation
Closing Balance
2011
252
136
23
-42
1
-26
-11
333
-121
212
-141
23
35
-203
2
30
-24
7
137
135
271
2012
258
114
27
-48
-28
-44
-8
270
-80
190
62
19
-31
-30
-2
-85
-28
-115
125
271
396
2013E
263
95
30
-47
58
-62
-7
330
-159
171
22
65
-75
-148
-31
-23
-29
-83
99
396
495
2014
278
88
32
-61
145
-65
4
422
-325
97
-120
68
-264
-640
2
84
-31
55
-163
495
332
2015
295
85
24
-61
83
-54
-19
353
-427
-74
-84
66
-115
-560
2
21
-33
-10
-217
332
115
2016E
357
96
25
-78
413
-54
0
758
-533
226
-266
54
0
-745
0
69
-38
31
44
115
160
2017E
411
118
34
-89
57
-66
0
465
-255
210
-31
66
0
-221
0
-34
-46
-79
165
160
325
(INR Billion)
2018E
467
150
43
-102
-353
-69
0
137
-109
28
-32
69
0
-72
0
-43
-52
-95
-30
325
295
1 September 2016
5

Disclosures
This document has been prepared by Motilal Oswal Securities Limited (hereinafter referred to as Most) to provide information about the company (ies) and/sector(s), if any, covered in the report and may be distributed by it and/or
Reliance Industries
its affiliated company(ies). This report is for personal information of the selected recipient/s and does not construe to be any investment, legal or taxation advice to you. This research report does not constitute an offer, invitation or
inducement to invest in securities or other investments and Motilal Oswal Securities Limited (hereinafter referred as MOSt) is not soliciting any action based upon it. This report is not for public distribution and has been furnished to
you solely for your general information and should not be reproduced or redistributed to any other person in any form. This report does not constitute a personal recommendation or take into account the particular investment
objectives, financial situations, or needs of individual clients. Before acting on any advice or recommendation in this material, investors should consider whether it is suitable for their particular circumstances and, if necessary, seek
professional advice. The price and value of the investments referred to in this material and the income from them may go down as well as up, and investors may realize losses on any investments. Past performance is not a guide
for future performance, future returns are not guaranteed and a loss of original capital may occur.
MOSt and its affiliates are a full-service, integrated investment banking, investment management, brokerage and financing group. We and our affiliates have investment banking and other business relationships with a some
companies covered by our Research Department. Our research professionals may provide input into our investment banking and other business selection processes. Investors should assume that MOSt and/or its affiliates are
seeking or will seek investment banking or other business from the company or companies that are the subject of this material and that the research professionals who were involved in preparing this material may educate
investors on investments in such business . The research professionals responsible for the preparation of this document may interact with trading desk personnel, sales personnel and other parties for the purpose of gathering,
applying and interpreting information. Our research professionals are paid on twin parameters of performance & profitability of MOSt.
MOSt generally prohibits its analysts, persons reporting to analysts, and members of their households from maintaining a financial interest in the securities or derivatives of any companies that the analysts cover. Additionally,
MOSt generally prohibits its analysts and persons reporting to analysts from serving as an officer, director, or advisory board member of any companies that the analysts cover. Our salespeople, traders, and other professionals or
affiliates may provide oral or written market commentary or trading strategies to our clients that reflect opinions that are contrary to the opinions expressed herein, and our proprietary trading and investing businesses may make
investment decisions that are inconsistent with the recommendations expressed herein. In reviewing these materials, you should be aware that any or all of the foregoing among other things, may give rise to real or potential
conflicts of interest. MOSt and its affiliated company(ies), their directors and employees and their relatives may; (a) from time to time, have a long or short position in, act as principal in, and buy or sell the securities or derivatives
thereof of companies mentioned herein. (b) be engaged in any other transaction involving such securities and earn brokerage or other compensation or act as a market maker in the financial instruments of the company(ies)
discussed herein or act as an advisor or lender/borrower to such company(ies) or may have any other potential conflict of interests with respect to any recommendation and other related information and opinions.; however the
same shall have no bearing whatsoever on the specific recommendations made by the analyst(s), as the recommendations made by the analyst(s) are completely independent of the views of the affiliates of MOSt even though
there might exist an inherent conflict of interest in some of the stocks mentioned in the research report
Reports based on technical and derivative analysis center on studying charts company's price movement, outstanding positions and trading volume, as opposed to focusing on a company's fundamentals and, as such, may not
match with a report on a company's fundamental analysis. In addition MOST has different business segments / Divisions with independent research separated by Chinese walls catering to different set of customers having various
objectives, risk profiles, investment horizon, etc, and therefore may at times have different contrary views on stocks sectors and markets.
Unauthorized disclosure, use, dissemination or copying (either whole or partial) of this information, is prohibited. The person accessing this information specifically agrees to exempt MOSt or any of its affiliates or employees from,
any and all responsibility/liability arising from such misuse and agrees not to hold MOSt or any of its affiliates or employees responsible for any such misuse and further agrees to hold MOSt or any of its affiliates or employees free
and harmless from all losses, costs, damages, expenses that may be suffered by the person accessing this information due to any errors and delays. The information contained herein is based on publicly available data or other
sources believed to be reliable. Any statements contained in this report attributed to a third party represent MOSt’s interpretation of the data, information and/or opinions provided by that third party either publicly or through a
subscription service, and such use and interpretation have not been reviewed by the third party. This Report is not intended to be a complete statement or summary of the securities, markets or developments referred to in the
document. While we would endeavor to update the information herein on reasonable basis, MOSt and/or its affiliates are under no obligation to update the information. Also there may be regulatory, compliance, or other reasons
that may prevent MOSt and/or its affiliates from doing so. MOSt or any of its affiliates or employees shall not be in any way responsible and liable for any loss or damage that may arise to any person from any inadvertent error in
the information contained in this report. MOSt or any of its affiliates or employees do not provide, at any time, any express or implied warranty of any kind, regarding any matter pertaining to this report, including without limitation
the implied warranties of merchantability, fitness for a particular purpose, and non-infringement. The recipients of this report should rely on their own investigations.
This report is intended for distribution to institutional investors. Recipients who are not institutional investors should seek advice of their independent financial advisor prior to taking any investment decision based on this report or
for any necessary explanation of its contents.
Most and it’s associates may have managed or co-managed public offering of securities, may have received compensation for investment banking or merchant banking or brokerage services, may have received any compensation
for products or services other than investment banking or merchant banking or brokerage services from the subject company in the past 12 months.
Most and it’s associates have not received any compensation or other benefits from the subject company or third party in connection with the research report.
Subject Company may have been a client of Most or its associates during twelve months preceding the date of distribution of the research report
MOSt and/or its affiliates and/or employees may have interests/positions, financial or otherwise of over 1 % at the end of the month immediately preceding the date of publication of the research in the securities mentioned in this
report. To enhance transparency, MOSt has incorporated a Disclosure of Interest Statement in this document. This should, however, not be treated as endorsement of the views expressed in the report.
Motilal Oswal Securities Limited is registered as a Research Analyst under SEBI (Research Analyst) Regulations, 2014. SEBI Reg. No. INH000000412
Pending Regulatory inspections against Motilal Oswal Securities Limited:
SEBI pursuant to a complaint from client Shri C.R. Mohanraj alleging unauthorized trading, issued a letter dated 29th April 2014 to MOSL notifying appointment of an Adjudicating Officer as per SEBI regulations to hold inquiry and
adjudge violation of SEBI Regulations; MOSL replied to the Show Cause Notice whereby SEBI granted us an opportunity of Inspection of Documents. Since all the documents requested by us were not covered we have requested
to SEBI vide our letter dated June 23, 2015 to provide pending list of documents for inspection.
List of associate companies of Motilal Oswal Securities Limited -
Click here to access detailed report
Analyst Certification
The views expressed in this research report accurately reflect the personal views of the analyst(s) about the subject securities or issues, and no part of the compensation of the research analyst(s) was, is, or will be directly or
indirectly related to the specific recommendations and views expressed by research analyst(s) in this report. The research analysts, strategists, or research associates principally responsible for preparation of MOSt research
receive compensation based upon various factors, including quality of research, investor client feedback, stock picking, competitive factors and firm revenues
Disclosure of Interest Statement
Analyst ownership of the stock
Served as an officer, director or employee -
Reliance Industries
No
No
A graph of daily closing prices of securities is available at www.nseindia.com and http://economictimes.indiatimes.com/markets/stocks/stock-quotes
Regional Disclosures (outside India)
This report is not directed or intended for distribution to or use by any person or entity resident in a state, country or any jurisdiction, where such distribution, publication, availability or use would be contrary to law, regulation or
which would subject MOSt & its group companies to registration or licensing requirements within such jurisdictions.
For Hong Kong:
This report is distributed in Hong Kong by Motilal Oswal capital Markets (Hong Kong) Private Limited, a licensed corporation (CE AYY-301) licensed and regulated by the Hong Kong Securities and Futures
Commission (SFC) pursuant to the Securities and Futures Ordinance (Chapter 571 of the Laws of Hong Kong) “SFO”. As per SEBI (Research Analyst Regulations) 2014 Motilal Oswal Securities (SEBI Reg No. INH000000412)
has an agreement with Motilal Oswal capital Markets (Hong Kong) Private Limited for distribution of research report in Kong Kong. This report is intended for distribution only to “Professional Investors” as defined in Part I of
Schedule 1 to SFO. Any investment or investment activity to which this document relates is only available to professional investor and will be engaged only with professional investors.” Nothing here is an offer or solicitation of
these securities, products and services in any jurisdiction where their offer or sale is not qualified or exempt from registration. The Indian Analyst(s) who compile this report is/are not located in Hong Kong & are not conducting
Research Analysis in Hong Kong.
For U.S.
Motilal Oswal Securities Limited (MOSL) is not a registered broker - dealer under the U.S. Securities Exchange Act of 1934, as amended (the"1934 act") and under applicable state laws in the United States. In addition MOSL is
not a registered investment adviser under the U.S. Investment Advisers Act of 1940, as amended (the "Advisers Act" and together with the 1934 Act, the "Acts), and under applicable state laws in the United States. Accordingly, in
the absence of specific exemption under the Acts, any brokerage and investment services provided by MOSL, including the products and services described herein are not available to or intended for U.S. persons.
This report is intended for distribution only to "Major Institutional Investors" as defined by Rule 15a-6(b)(4) of the Exchange Act and interpretations thereof by SEC (henceforth referred to as "major institutional investors"). This
document must not be acted on or relied on by persons who are not major institutional investors. Any investment or investment activity to which this document relates is only available to major institutional investors and will be
engaged in only with major institutional investors. In reliance on the exemption from registration provided by Rule 15a-6 of the U.S. Securities Exchange Act of 1934, as amended (the "Exchange Act") and interpretations thereof by
the U.S. Securities and Exchange Commission ("SEC") in order to conduct business with Institutional Investors based in the U.S., MOSL has entered into a chaperoning agreement with a U.S. registered broker-dealer, Motilal
Oswal Securities International Private Limited. ("MOSIPL"). Any business interaction pursuant to this report will have to be executed within the provisions of this chaperoning agreement.
The Research Analysts contributing to the report may not be registered /qualified as research analyst with FINRA. Such research analyst may not be associated persons of the U.S. registered broker-dealer, MOSIPL, and
therefore, may not be subject to NASD rule 2711 and NYSE Rule 472 restrictions on communication with a subject company, public appearances and trading securities held by a research analyst account.
For Singapore
Motilal Oswal Capital Markets Singapore Pte Limited is acting as an exempt financial advisor under section 23(1)(f) of the Financial Advisers Act(FAA) read with regulation 17(1)(d) of the Financial Advisors Regulations and is a
subsidiary of Motilal Oswal Securities Limited in India. This research is distributed in Singapore by Motilal Oswal Capital Markets Singapore Pte Limited and it is only directed in Singapore to accredited investors, as defined in the
Financial Advisers Regulations and the Securities and Futures Act (Chapter 289), as amended from time to time.
In respect of any matter arising from or in connection with the research you could contact the following representatives of Motilal Oswal Capital Markets Singapore Pte Limited:
Varun Kumar
Varun.kumar@motilaloswal.com
Contact : (+65) 68189232
Office Address:21 (Suite 31),16 Collyer Quay,Singapore 04931
Kadambari Balachandran
kadambari.balachandran@motilaloswal.com
(+65) 68189233 / 65249115
Motilal Oswal Securities Ltd
1 September 2016
Motilal Oswal Tower, Level 9, Sayani Road, Prabhadevi, Mumbai 400 025
Phone: +91 22 3982 5500 E-mail: reports@motilaloswal.com
6