Detailed Report | Sector: Financials
12 Annual Global Investor Conference
BSE Sensex
28,797
S&P CNX
8,867
th
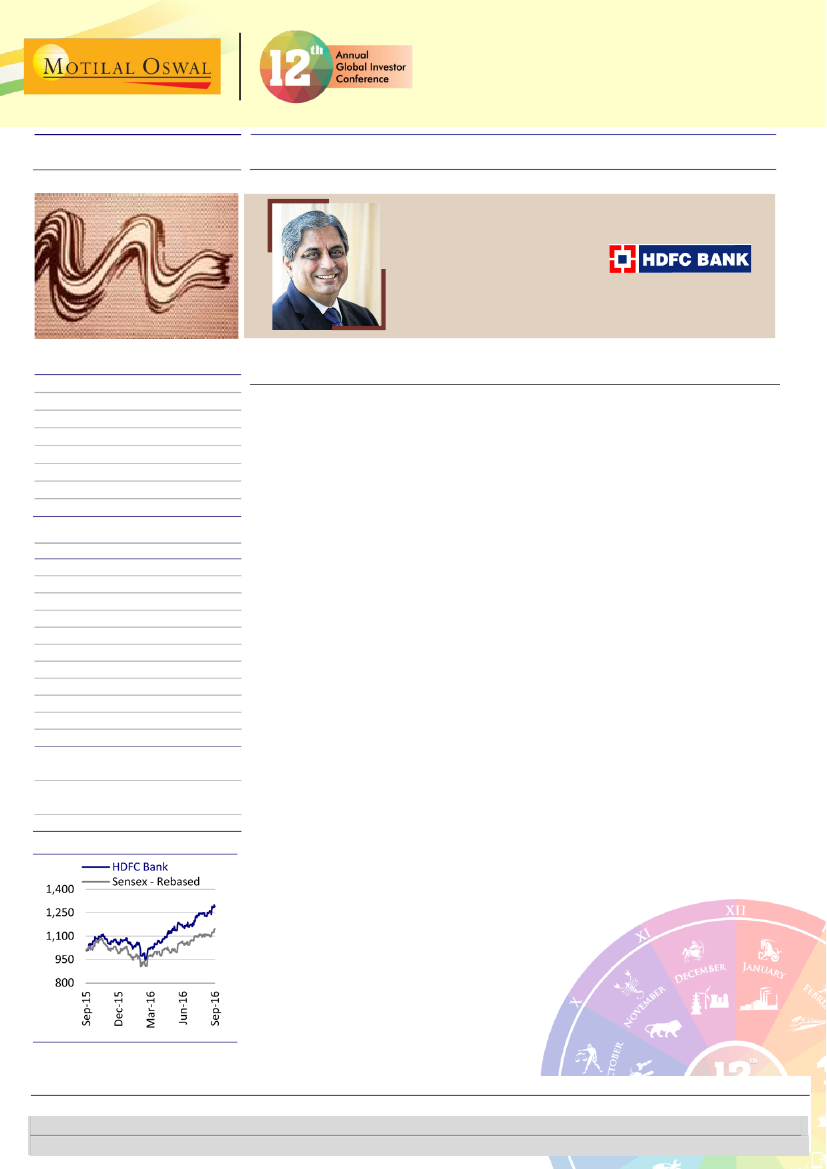
HDFC Bank
TP: INR1,450 (+12%)
Mr Aditya Puri
MD and CEO
HDFC Bank
CMP: INR1,291
Buy
CEO TRACK
Stock Info
Bloomberg
Equity Shares (m)
52-Week Range (INR)
1, 6, 12 Rel. Per (%)
M.Cap. (INR b)
M.Cap. (USD b)
12M Avg Val (INR M)
Free float (%)
HDFCB IN
2528.2
1,305/929
1/9/15
3,264
48.9
1,637
78.6
2019E
484.4
375.0
213.8
4.6
84.6
20.4
450.9
438.7
20.2
1.9
23.4
15.3
2.9
2.9
1.3
It’s all about being digital
Key takeaways from CEO Track
Financial Snapshot (INR Billion)
2017E 2018E
Y/E Mar
NII
335.5 399.2
OP
256.8 306.3
NP
147.8 177.6
NIM (%)
4.8
4.7
EPS (INR)
58.4
70.2
EPS Gr. (%)
20.2
20.2
BV/Sh. (INR) 332.2 386.1
ABV/Sh. (INR) 326.5 379.0
RoE (%)
18.9
19.6
RoA (%)
1.9
1.9
Payout (%)
23.4
23.4
Valuations
P/E(X)
22.1
18.4
P/BV (X)
3.9
3.3
P/ABV (X)
4.0
3.4
Div. Yield (%)
0.9
1.1
Relative to Index
Significant investment in digital initiatives has begun paying off: (a) ~20% of
incremental unsecured personal loans sourced through 10-second personal loan
product, (b) 8-10% of auto loans sourced through digital channel, (c) volumes on
SmartBuy, HDFCB’s online market place almost 1/10th of Amazon’s volumes.
HDFCB’s digital journey will continue through collaborations/partnerships. It is
committed to platform-agnostic services. Lot of technology initiatives are in store –
expect rollout by March 2017 (robots in branches, artificial intelligence).
Significant investments in branches and technology would provide operating leverage
and efficiency in ensuing quarters. Expect cost-to-income ratio to decline, led by
higher business volumes.
HDFCB remains a picture-perfect story, with (a) continued market share gain (12.5%
incremental share (9.2% for FY15)), (b) adequate capitalization (CET1 of 13.3%, best in
class), (c) CASA ratio of 40%+, (d) best in class profitability, with 1.9% RoA and 18.3%
RoE. Subsidiaries have become sizeable – based on multiple of 15x for securities
business and 3x BV for NBFC business, per share value for HDFCB works out to INR58
(post HoldCo).
Digital journey – customer focus and ease of business key effort areas
HDFCB’s digital strategy is centered around (a) increasing efficiency, (b) accelerating
geographic expansion, (c) raising customer convenience and ease, and (d)
competing against disruptive technology. It is already seeing strong success in 10-
second personal loans (20% of incremental sourcing through this channel), pre-
approved auto loans (8-10% of disbursements), and SmartBuy (10% of Amazon’s
volumes). It plans to use artificial intelligence for routine work and most initiatives
are likely to be launched by December 2016. With these initiatives gaining traction
and incremental business coming from these channels, the management is
confident of reducing the cost-to-income ratio.
Alpesh Mehta
(Alpesh.Mehta@MotilalOswal.com)
Krishnan ASV
(A.Krishnan@MotilalOswal.com);+91 22 6129 1571 /
Rahul Gupta
(rahul.pgupta@MotilalOswal.com); +91 22 6129
1544
September 2016
advised to refer through important disclosures made at the last page of the Research Report.
1
Investors are
Motilal Oswal research is available on www.motilaloswal.com/Institutional-Equities, Bloomberg, Thomson Reuters, Factset and S&P Capital.