12 Annual Global Investor Conference
BSE Sensex
28,354
S&P CNX
8,716
th
Alkem Laboratories
TP: INR1,800 (+12%)
Buy
Company update | Sector: Healthcare
CMP: INR1,614
Preferred way to play domestic pharma story
Stock Info
Bloomberg
Equity Shares (m)
52-Week Range (INR)
1, 6, 12 Rel. Per (%)
M.Cap. (INR b)
M.Cap. (USD b)
Avg Val, INRm
Free float (%)
ALKEM IN
119.6
1670/1175
3/4/-
149.2
2.3
409.0
33.1
2018E
68.5
12.7
10.3
85.8
16.3
418.4
22.3
20.5
15.7
3.2
11.9
2.2
Financial Snapshot (INR b)
Y/E Mar
2016 2017E
Sales
49.9
57.2
EBITDA
8.5
10.0
NP
7.7
8.8
EPS (INR)
64.7
73.8
EPS Gr. (%)
67.4
13.9
BV/Sh. (INR)
293.0 351.9
RoE (%)
23.8
22.9
RoCE (%)
17.6
20.7
Valuations
P/E (x)
20.8
18.3
P/BV (x)
4.6
3.8
EV/EBITDA (x)
18.8
15.8
EV/Sales (x)
3.2
2.8
Shareholding pattern (%)
As on
Promoter
Public
Others
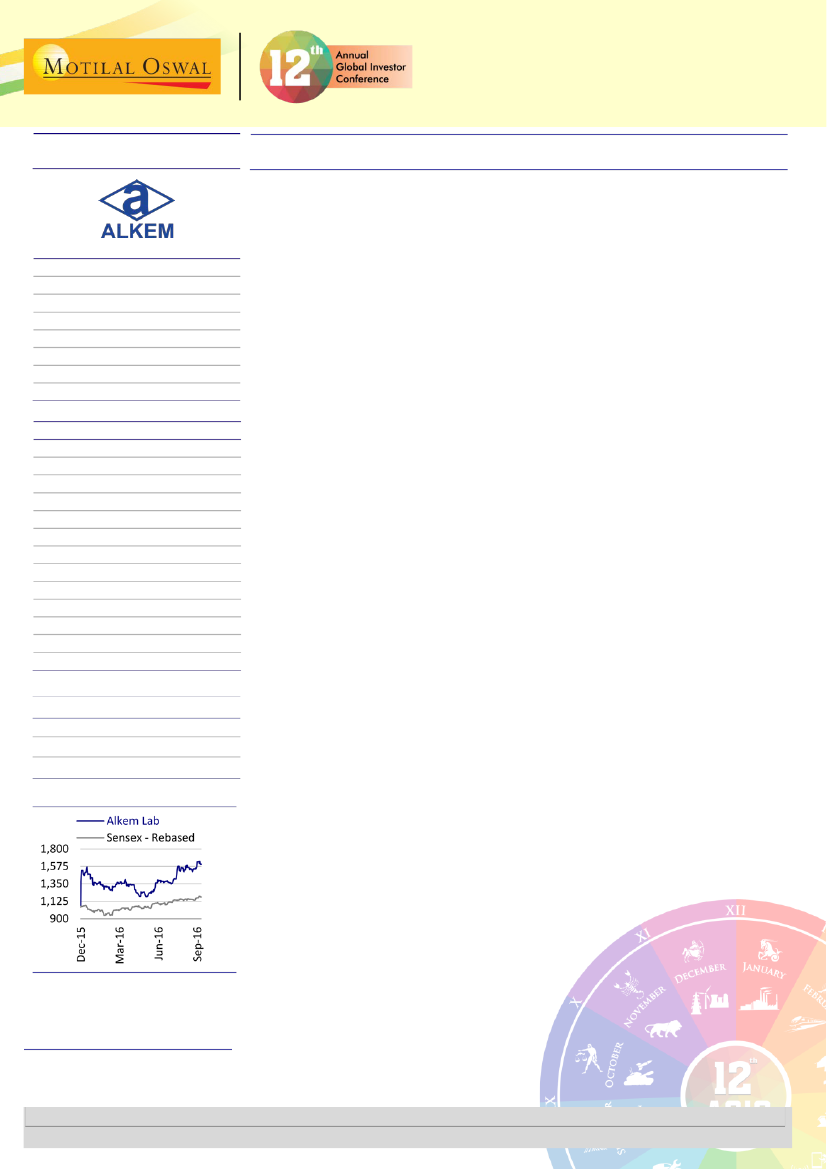
Relative to Index
Despite regulatory headwinds, Alkem Laboratories’ (ALKEM) domestic business is
poised to deliver robust mid-to-high teens growth on the back of its consistent
outperformance in the acute segment and lower base in the chronic segment.
Strong secondary sales growth in July-Aug in the domestic market suggests another
quarter of robust performance (like 1QFY17).
Half of the impact of price control was already factored in for 1Q. FDC ban impact
should get diluted (even if the legal outcome is unfavorable) as the company is already
working on substitute products.
Only one-third of the portfolio in the US has been monetized by now. Many products
are awaiting ANDA approvals and likely to be launched over the next 2-3 years (bigger
products are bunched up toward back-end). This would result in doubling of revenues
in the US over the next 3-4 years.
We argue for a multiple re-rating, given ALKEM’s leadership position in the domestic
market, superior earnings growth profile (>15% EPS CAGR over FY16-18E), improving
return ratios (ROICs expected to improve to ~21% by FY18E, from 17% in FY16) and net
cash balance sheet.
Acute business continues to surprise positively
Jun-16 Mar-16 Dec-15
66.9
33.1
--
66.8
33.2
--
66.6
33.4
--
ALKEM has been the market leader in the acute segment over the past five
years. Despite the high base, Alkem has consistently outperformed India acute
market growth. Domestic acute segment exhibited 10%CAGR over the last five
years, whereas ALKEM acute revenues exhibited low teens growth over the
same period. This growth was primarily driven by its new product launches;
brand loyalty, aggressive pricing strategy and vast distribution reach across
India.
In 1QFY17, ALKEM delivered robust primary sales growth of ~16% YoY in the
domestic market v/s mid-to-high single-digit growth reported by most peers.
This was primarily driven by strong growth in big therapy areas, including anti-
infectives and GI (outperformed industry growth by >600bp in 1Q).
Despite being the market leader (among top-three), we expect ALKEM to deliver
mid-teens growth in the acute segment on the back of its strong brand equity,
rich product pipeline and industry-high sales force productivity.
The chronic segment has grown at a robust pace (>30% CAGR) over the last five
years on the back of lower base, high industry growth, and investments on
infrastructure & marketing fronts.
We believe the chronic segment is yet to show its true potential. Currently, 25%
of its salesforce is dedicated toward the chronic space, whereas revenue
contribution from this segment stood at ~12% in FY16 (despite strong growth
over the last five years).
We expect the chronic business to deliver >20% CAGR over the next three years
on the back of low base effect and its focus on high-growth therapies (cardio,
derma, anti-diabetic, etc.) and specialized sales team (of ~1,500).
ALKEM is working on Phase-3 trials of Evogliptin (in-licensed from Dong-A ST),
which could act as a key growth catalyst from FY18.
Chronic – platform is set, time to reap benefits
Kumar Saurabh
Gaurav Tinani
(Kumar.Saurabh@MotilalOswal.com)
+91 22 6129 1519
(Gaurav.Tinani@motilaloswal.com)
+91 22 6129 1552
Motilal Oswal research is available on www.motilaloswal.com/Institutional-Equities, Bloomberg, Thomson Reuters, Factset and S&P Capital.
Investors are
2016
9 September
advised to refer through important disclosures made at the last page of the Research Report.
1