28 September 2016
Update
| Sector:
Others
BSE SENSEX
28,293
S&P CNX
8,745
MCX
Buy
CMP: INR1,247
TP: INR1,400 (+12%)
SEBI okays introduction of options in commodities
Stock Info
Bloomberg
Equity Shares (m)
52-Week Range (INR)
1, 6, 12 Rel. Per (%)
M.Cap. (INR b)
M.Cap. (USD b)
Avg Val. (INR m)
Free float (%)
Financials Snapshot (INR b)
Y/E Mar
2016
MCX IN
51.0
1,262/726
25/38/21
63.6
1.0
229
100
The Securities and Exchange Board of India (SEBI) released a circular ratifying the
introduction of options in the commodities derivatives market. According to the
circular, exchanges willing to start trading options shall take prior SEBI approval.
That would be procedural for MCX, in our view. The circular does not mention
which commodities are allowed, nor does it indicate the date from when options
contracts can start trading. The SEBI will issue detailed guidelines in due course.
Key highlights
from
the circular:
2017E
2018E
Net Sales
EBITDA
Net Profit
EPS (INR)
EPS Gr. (%)
BV/Sh. (INR)
RoE (%
RoCE (%)
P/E (x)
P/BV (x)
2.1
0.6
0.4
23.4
-5.0
236.1
3.5
8.8
53.4
5.3
2.6
0.9
1.5
29.4
25.7
250.9
12.0
11.8
42.5
5.0
4.0
2.1
2.4
46.8
59.4
274.7
17.8
17.4
26.6
4.5
Shareholding pattern (%)
As On
Jun-16 Mar-16 Jun-15
Promoter
0
0
0
DII
40.6
41.6
40.9
FII
18.2
15.7
15.3
Others
41.2
42.8
43.9
FII Includes depository receipts
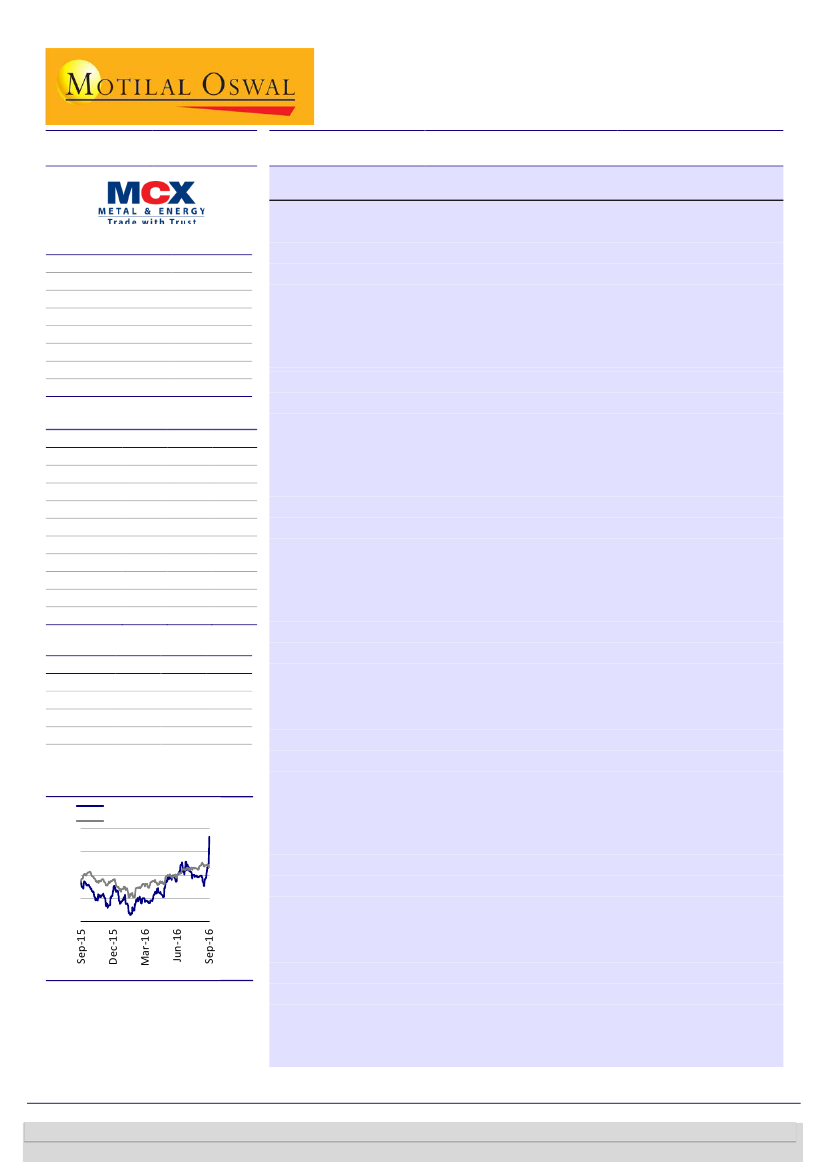
Stock Performance (1-year)
Multi Comm. Exc.
Sensex - Rebased
1,300
1,150
1,000
850
700
The only instrument currently available in the commodity derivatives market
is futures on individual commodities. Introduction of new commodity
derivatives products has been keenly discussed given its potential to drive
overall development of that market by attracting broad-based participation,
enhancing liquidity, facilitating hedging and bringing more depth to the
commodity derivatives market.
The SEBI has constituted a committee of experts – Commodity Derivatives
Advisory Committee (CDAC) – to advise it on matters concerning effective
regulation and development of the commodity derivatives market.
Recommendations made by the CDAC inter alia on the subject of introduction
of new products have been considered, and it has been decided that
commodity derivatives exchanges shall be permitted to introduce trading in
options.
Commodity derivatives exchanges willing to start trading in options contracts
shall take prior approval of the SEBI (detailed guidelines will be issued in due
course).
Introduction of options
is
sentimentally positive:
Introduction of options is one of
the critical reforms that would trigger growth of the commodity derivatives
market from both hedgers’ and speculators’ perspective. It was widely anticipated
to be introduced this fiscal, and the announcement as a result comes on expected
lines. Nonetheless, the fact that options contracts finally see light of day after
years of deliberation – first by the FMC and then the SEBI – is sentimentally
positive for MCX. The financial impact, as we mentioned earlier, may be one akin
to hockey stick, with cannibalization impact for a brief early period followed by
significant market growth driving earnings.
Volume reversal to pre-CTT levels is our base case:
MCX has retained its market
leadership position with a share of 80-90% over FY09-16, even in the most
turbulent of months of FY13-14, when the parent’s existence was in deep waters
on issues of fraud around National Spot Exchange. With the SEBI’s reforms
underway, our base case assumes a return to pre-commodities transaction tax
(CTT) average daily turnover of INR500b by end-FY18. This compares with current
ADT of INR250b. Our price target is INR1,400, which discounts forward earnings by
30x.
Buy.
Motilal Oswal research is available on www.motilaloswal.com/Institutional-Equities, Bloomberg, Thomson Reuters, Factset and S&P Capital.
Investors are advised to refer through important disclosures made at the last page of the Research Report.
Ashish Chopra
(Ashish.Chopra@MotilalOswal.com); +91 22 6129 1530
Sagar Lele
(Sagar.Lele@MotilalOswal.com); +91 22 6129 1531

MCX
Valuation and view
Market leadership in winner-takes-all business:
MCX has retained its market
leadership position with a share of 80-90% over FY09-16. Even in the most
turbulent of months of FY13-14 – when the parent’s existence was in deep
waters due to issues of fraud around National Spot Exchange – the exchange
managed to retain its share. Additionally, it had remained without a full-time
MD & CEO for a long time since May 2014, when Mr. Manoj Vaish resigned just
three months after joining. This is a reflection of the winner-takes-all nature of
the business model.
Monopoly share in multiple commodities takes care of concentration risk:
MCX’s golden run in terms of volumes came at the time of significant run-up in
gold and silver prices in FY12 and FY13. That was also perceived to be a risk,
given that the share of volumes from these two commodities had exceeded
70%. However, presence in multiple commodities helps avert the concentration
risk, and this was evidenced in FY15, when action in oil prices drove energy to
exceed gold as the largest traded commodity at MCX by value.
All eyes on reforms, as SEBI-FMC merger is complete:
SEBI’s merger with FMC
is now complete, paving the way for much-awaited reforms in the ecosystem.
The upside for MCX may yet be partly a function of reports around approvals to
competition and entry of a credible global exchange materializing. We do not
expect these at one-go or immediately, but rather in a gradual, phased manner
over the course of the next calendar year. In the interim, reports suggest that
competitive intensity may take a while given the regulatory norms. Meanwhile,
MCX could: [1] get a head start and [2] strengthen itself with investment from
CME.
Volume reversal to pre-CTT levels is our base case:
Our base case assumes a
return to pre-commodities transaction tax (CTT) average daily turnover of
INR500b by end-FY18. This compares with current ADT of INR250b.
Multiplier effect on operational earnings from operating leverage, Buy:
Given
the fixed nature of MCX’s cost base, increase in volumes would help improve its
EBITDA margin significantly. We assume FY18 to be the first full year with at
least one key reform and ADT returning to pre-CTT levels. We assume this to be
split equally between futures and options. That drives our EBITDA margin
estimate of 53% in FY18 and earnings estimate of INR47/share. Our price target
is INR1,400, which discounts forward earnings by 30x.
Introduction of new products like options/indices.
Introduction of new participants like banks/FIs.
High volatility in key commodities like bullion/crude.
Key triggers
Key risk – increased competition from equity exchanges
One of the implications of FMC’s merger with the SEBI is that stock exchanges will
be able to become universal exchanges, where equities, debt instruments and
currencies are traded under the same roof as commodity derivatives. Stock
exchanges already have depositories and clearing corporations that will cater to the
needs of commodity traders as well. If NSE enters the commodities segment, MCX
could see stiff competition, which may impair both market share and profit margins.
28 September 2016
2

MCX
Financials and Valuations
Income Statement
Y/E Mar
Net Sales
Change (%)
EBITDA
EBITDA Margin (%)
Depreciation
EBIT
Interest
Other Income
Extraordinary items
PBT
Tax
Tax Rate (%)
Min. Int. & Assoc. Share
Reported PAT
Adjusted PAT
Change (%)
2011
3,689
28.4
1,918
52.0
247
1,671
0
784
0
2,455
727
29.6
0
1,728
1,728
-21.7
2012
5,262
42.6
3,347
63.6
272
3,075
0
1,027
-142
3,960
1,098
27.7
0
2,862
2,862
65.6
2013
4,992
-5.1
2,932
58.7
307
2,625
0
1,427
0
4,051
1,065
26.3
0
2,986
2,986
4.4
2014
3,197
-35.9
1,248
39.0
343
905
11
1,202
0
2,097
569
27.1
0
1,528
1,528
-48.8
2015
2,038
-36.3
689
33.8
259
430
14
1,285
0
1,701
450
26.5
0
1,251
1,251
-18.1
2016
2,135
4.8
553
25.9
246
307
0
1,191
-667
831
413
49.7
0
418
418
-66.6
2017E
2,629
23.1
947
36.0
198
749
(INR Million)
2018E
4,009
52.5
2,108
52.6
201
1,907
1
1,325
0
2,073
541
26.1
0
1,532
1,532
266.3
0
1,334
0
3,241
796
24.5
0
2,445
2,445
59.6
Y/E Mar
Share Capital
Reserves
Net Worth
Balance Sheet
2011
510
7,975
8,485
127
0
8,612
1,953
0
8,236
4,808
489
3,310
1,010
6,385
-1,577
8,612
2012
508
9,461
9,969
432
0
10,401
1,369
1
11,502
5,887
514
3,124
2,249
8,358
-2,471
10,401
2013
510
11,058
11,567
569
0
12,136
2,044
0
10,682
5,131
69
3,475
1,587
5,721
-590
12,136
2014
510
10,931
11,441
2,169
1,720
13,610
1,735
0
10,898
4,782
90
3,417
1,275
3,805
977
13,610
2015
510
11,512
12,022
2,214
1,871
14,236
1,552
0
12,927
3,764
107
2,655
1,002
4,007
-243
14,236
2016
510
11,529
12,039
2,162
1,879
14,201
3,528
0
8,643
5,997
42
5,003
952
3,967
2,030
14,201
2017E
510
12,288
12,798
2,162
1,879
14,959
3,550
0
8,643
7,570
144
5,972
1,453
(INR Million)
2018E
510
13,502
14,012
2,162
1,879
16,173
3,591
0
8,643
10,141
224
7,817
2,101
6,202
3,939
16,173
Debt
SGF
Total Capital Employed
Net Fixed Assets
Capital WIP
Investments
Current Assets
Debtors
Cash & Bank
Loans & Adv, Others
Curr Liabs & Provns
Net Current Assets
Total Assets
MOSL Estimates
4,804
2,766
14,959
28 September 2016
3

MCX
Financials and Valuations
Ratios
Y/E Mar
Basic (INR)
EPS
Cash EPS
Book Value
DPS
Payout (incl. Div. Tax.)
Valuation(x)
P/E
Cash P/E
Price / Book Value
EV/Sales
EV/EBITDA
Dividend Yield (%)
Profitability Ratios (%)
RoE
RoCE
RoIC
Turnover Ratios (%)
Fixed Asset Turnover (x)
Debtors (No. of Days)
Leverage Ratios (%)
Net Debt/Equity (x)
2011
33.9
38.7
166.4
5.0
17.1
2012
56.1
61.4
195.5
24.0
50.0
2013
58.6
64.6
226.8
0.5
0.9
2014
30.0
36.9
225.4
10.2
39.0
2015
24.6
29.6
235.8
10.2
48.5
50.7
42.1
5.3
23.7
70.2
1.0
2016
23.4
13.0
236.1
0.0
0.0
53.4
95.7
5.3
23.5
91.0
0.0
2017E
29.4
33.2
250.9
15.3
61.8
42.5
37.5
5.0
18.8
54.1
1.5
2018E
46.8
50.7
274.7
20.4
51.7
26.6
24.6
4.5
11.8
23.2
1.9
22.4
16.7
0
27.0
48
0.0
31.0
24.8
0
31.2
36
0.0
27.7
26.5
0
27.3
5
0.0
13.3
12.8
0
18.1
10
0.0
10.7
10.4
0
11.4
19
0.0
3.5
8.8
0
11.7
7
0.0
12.0
11.8
0
13.9
20
0.0
17.8
17.4
0
19.0
20
0.0
Y/E Mar
Adjusted EBITDA
Non cash opr. exp (inc)
(Inc)/Dec in Wkg. Cap.
Tax Paid
Other operating activities
CF from Op. Activity
(Inc)/Dec in FA & CWIP
Free cash flows
(Pur)/Sale of Invt
Others
CF from Inv. Activity
Inc/(Dec) in Net Worth
Inc / (Dec) in Debt
Interest Paid
Divd Paid (incl Tax) & Others
CF from Fin. Activity
Inc/(Dec) in Cash
Add: Opening Balance
Closing Balance
MOSL Estimates
Cash Flow Statement
2011
1,918
248
1,080
-546
0
2,700
-286
2,414
-2,042
0
-2,328
0
0
0
232
232
604
2,700
3,304
2012
3,347
-650
1,160
-1,097
0
2,760
-200
2,561
-2,723
0
-2,923
0
0
0
-23
-24
-186
3,310
3,124
2013
2,932
319
-1,941
-782
0
529
-462
68
1,910
0
1,448
0
0
0
-2,134
-2,134
-156
3,124
2,968
2014
1,248
1,085
-1,565
-384
0
385
-59
325
586
0
527
0
0
0
-1,133
-1,133
-221
3,475
3,254
2015
689
0
503
-220
0
972
-9
963
-1,080
0
-1,089
0
0
0
0
0
-117
3,417
3,300
2016
553
0
22
-41
0
533
-200
333
5,367
0
5,167
0
0
-14
0
-14
5,687
2,655
8,342
2017E
947
-36
234
-153
0
992
-220
772
926
0
706
0
0
0
-733
-733
964
5,003
5,967
(INR Million)
2018E
2,108
-58
671
-425
0
2,295
-242
2,053
964
0
722
0
0
0
-1,173
-1,173
1,844
5,972
7,817
28 September 2016
4

MCX
NOTES
28 September 2016
5

Disclosures
This document has been prepared by Motilal Oswal Securities Limited (hereinafter referred to as Most) to provide information about the company (ies) and/sector(s), if any, covered in the report and may be distributed
MCX
by it and/or
its affiliated company(ies). This report is for personal information of the selected recipient/s and does not construe to be any investment, legal or taxation advice to you. This research report does not constitute an offer, invitation or
inducement to invest in securities or other investments and Motilal Oswal Securities Limited (hereinafter referred as MOSt) is not soliciting any action based upon it. This report is not for public distribution and has been furnished to
you solely for your general information and should not be reproduced or redistributed to any other person in any form. This report does not constitute a personal recommendation or take into account the particular investment
objectives, financial situations, or needs of individual clients. Before acting on any advice or recommendation in this material, investors should consider whether it is suitable for their particular circumstances and, if necessary, seek
professional advice. The price and value of the investments referred to in this material and the income from them may go down as well as up, and investors may realize losses on any investments. Past performance is not a guide
for future performance, future returns are not guaranteed and a loss of original capital may occur.
MOSt and its affiliates are a full-service, integrated investment banking, investment management, brokerage and financing group. We and our affiliates have investment banking and other business relationships with a some
companies covered by our Research Department. Our research professionals may provide input into our investment banking and other business selection processes. Investors should assume that MOSt and/or its affiliates are
seeking or will seek investment banking or other business from the company or companies that are the subject of this material and that the research professionals who were involved in preparing this material may educate
investors on investments in such business . The research professionals responsible for the preparation of this document may interact with trading desk personnel, sales personnel and other parties for the purpose of gathering,
applying and interpreting information. Our research professionals are paid on twin parameters of performance & profitability of MOSt.
MOSt generally prohibits its analysts, persons reporting to analysts, and members of their households from maintaining a financial interest in the securities or derivatives of any companies that the analysts cover. Additionally,
MOSt generally prohibits its analysts and persons reporting to analysts from serving as an officer, director, or advisory board member of any companies that the analysts cover. Our salespeople, traders, and other professionals or
affiliates may provide oral or written market commentary or trading strategies to our clients that reflect opinions that are contrary to the opinions expressed herein, and our proprietary trading and investing businesses may make
investment decisions that are inconsistent with the recommendations expressed herein. In reviewing these materials, you should be aware that any or all of the foregoing among other things, may give rise to real or potential
conflicts of interest. MOSt and its affiliated company(ies), their directors and employees and their relatives may; (a) from time to time, have a long or short position in, act as principal in, and buy or sell the securities or derivatives
thereof of companies mentioned herein. (b) be engaged in any other transaction involving such securities and earn brokerage or other compensation or act as a market maker in the financial instruments of the company(ies)
discussed herein or act as an advisor or lender/borrower to such company(ies) or may have any other potential conflict of interests with respect to any recommendation and other related information and opinions.; however the
same shall have no bearing whatsoever on the specific recommendations made by the analyst(s), as the recommendations made by the analyst(s) are completely independent of the views of the affiliates of MOSt even though
there might exist an inherent conflict of interest in some of the stocks mentioned in the research report
Reports based on technical and derivative analysis center on studying charts company's price movement, outstanding positions and trading volume, as opposed to focusing on a company's fundamentals and, as such, may not
match with a report on a company's fundamental analysis. In addition MOST has different business segments / Divisions with independent research separated by Chinese walls catering to different set of customers having various
objectives, risk profiles, investment horizon, etc, and therefore may at times have different contrary views on stocks sectors and markets.
Unauthorized disclosure, use, dissemination or copying (either whole or partial) of this information, is prohibited. The person accessing this information specifically agrees to exempt MOSt or any of its affiliates or employees from,
any and all responsibility/liability arising from such misuse and agrees not to hold MOSt or any of its affiliates or employees responsible for any such misuse and further agrees to hold MOSt or any of its affiliates or employees free
and harmless from all losses, costs, damages, expenses that may be suffered by the person accessing this information due to any errors and delays. The information contained herein is based on publicly available data or other
sources believed to be reliable. Any statements contained in this report attributed to a third party represent MOSt’s interpretation of the data, information and/or opinions provided by that third party either publicly or through a
subscription service, and such use and interpretation have not been reviewed by the third party. This Report is not intended to be a complete statement or summary of the securities, markets or developments referred to in the
document. While we would endeavor to update the information herein on reasonable basis, MOSt and/or its affiliates are under no obligation to update the information. Also there may be regulatory, compliance, or other reasons
that may prevent MOSt and/or its affiliates from doing so. MOSt or any of its affiliates or employees shall not be in any way responsible and liable for any loss or damage that may arise to any person from any inadvertent error in
the information contained in this report. MOSt or any of its affiliates or employees do not provide, at any time, any express or implied warranty of any kind, regarding any matter pertaining to this report, including without limitation
the implied warranties of merchantability, fitness for a particular purpose, and non-infringement. The recipients of this report should rely on their own investigations.
This report is intended for distribution to institutional investors. Recipients who are not institutional investors should seek advice of their independent financial advisor prior to taking any investment decision based on this report or
for any necessary explanation of its contents.
Most and it’s associates may have managed or co-managed public offering of securities, may have received compensation for investment banking or merchant banking or brokerage services, may have received any compensation
for products or services other than investment banking or merchant banking or brokerage services from the subject company in the past 12 months.
Most and it’s associates have not received any compensation or other benefits from the subject company or third party in connection with the research report.
Subject Company may have been a client of Most or its associates during twelve months preceding the date of distribution of the research report
MOSt and/or its affiliates and/or employees may have interests/positions, financial or otherwise of over 1 % at the end of the month immediately preceding the date of publication of the research in the securities mentioned in this
report. To enhance transparency, MOSt has incorporated a Disclosure of Interest Statement in this document. This should, however, not be treated as endorsement of the views expressed in the report.
Motilal Oswal Securities Limited is registered as a Research Analyst under SEBI (Research Analyst) Regulations, 2014. SEBI Reg. No. INH000000412
Pending Regulatory inspections against Motilal Oswal Securities Limited:
SEBI pursuant to a complaint from client Shri C.R. Mohanraj alleging unauthorized trading, issued a letter dated 29th April 2014 to MOSL notifying appointment of an Adjudicating Officer as per SEBI regulations to hold inquiry and
adjudge violation of SEBI Regulations; MOSL replied to the Show Cause Notice whereby SEBI granted us an opportunity of Inspection of Documents. Since all the documents requested by us were not covered we have requested
to SEBI vide our letter dated June 23, 2015 to provide pending list of documents for inspection.
List of associate companies of Motilal Oswal Securities Limited -
Click here to access detailed report
Analyst Certification
The views expressed in this research report accurately reflect the personal views of the analyst(s) about the subject securities or issues, and no part of the compensation of the research analyst(s) was, is, or will be directly or
indirectly related to the specific recommendations and views expressed by research analyst(s) in this report. The research analysts, strategists, or research associates principally responsible for preparation of MOSt research
receive compensation based upon various factors, including quality of research, investor client feedback, stock picking, competitive factors and firm revenues
Disclosure of Interest Statement
Analyst ownership of the stock
Served as an officer, director or employee -
MULTI COMMODITY EXCH IN
No
No
A graph of daily closing prices of securities is available at www.nseindia.com and http://economictimes.indiatimes.com/markets/stocks/stock-quotes
Regional Disclosures (outside India)
This report is not directed or intended for distribution to or use by any person or entity resident in a state, country or any jurisdiction, where such distribution, publication, availability or use would be contrary to law, regulation or
which would subject MOSt & its group companies to registration or licensing requirements within such jurisdictions.
For Hong Kong:
This report is distributed in Hong Kong by Motilal Oswal capital Markets (Hong Kong) Private Limited, a licensed corporation (CE AYY-301) licensed and regulated by the Hong Kong Securities and Futures
Commission (SFC) pursuant to the Securities and Futures Ordinance (Chapter 571 of the Laws of Hong Kong) “SFO”. As per SEBI (Research Analyst Regulations) 2014 Motilal Oswal Securities (SEBI Reg No. INH000000412)
has an agreement with Motilal Oswal capital Markets (Hong Kong) Private Limited for distribution of research report in Kong Kong. This report is intended for distribution only to “Professional Investors” as defined in Part I of
Schedule 1 to SFO. Any investment or investment activity to which this document relates is only available to professional investor and will be engaged only with professional investors.” Nothing here is an offer or solicitation of
these securities, products and services in any jurisdiction where their offer or sale is not qualified or exempt from registration. The Indian Analyst(s) who compile this report is/are not located in Hong Kong & are not conducting
Research Analysis in Hong Kong.
For U.S.
Motilal Oswal Securities Limited (MOSL) is not a registered broker - dealer under the U.S. Securities Exchange Act of 1934, as amended (the"1934 act") and under applicable state laws in the United States. In addition MOSL is
not a registered investment adviser under the U.S. Investment Advisers Act of 1940, as amended (the "Advisers Act" and together with the 1934 Act, the "Acts), and under applicable state laws in the United States. Accordingly, in
the absence of specific exemption under the Acts, any brokerage and investment services provided by MOSL, including the products and services described herein are not available to or intended for U.S. persons.
This report is intended for distribution only to "Major Institutional Investors" as defined by Rule 15a-6(b)(4) of the Exchange Act and interpretations thereof by SEC (henceforth referred to as "major institutional investors"). This
document must not be acted on or relied on by persons who are not major institutional investors. Any investment or investment activity to which this document relates is only available to major institutional investors and will be
engaged in only with major institutional investors. In reliance on the exemption from registration provided by Rule 15a-6 of the U.S. Securities Exchange Act of 1934, as amended (the "Exchange Act") and interpretations thereof by
the U.S. Securities and Exchange Commission ("SEC") in order to conduct business with Institutional Investors based in the U.S., MOSL has entered into a chaperoning agreement with a U.S. registered broker-dealer, Motilal
Oswal Securities International Private Limited. ("MOSIPL"). Any business interaction pursuant to this report will have to be executed within the provisions of this chaperoning agreement.
The Research Analysts contributing to the report may not be registered /qualified as research analyst with FINRA. Such research analyst may not be associated persons of the U.S. registered broker-dealer, MOSIPL, and
therefore, may not be subject to NASD rule 2711 and NYSE Rule 472 restrictions on communication with a subject company, public appearances and trading securities held by a research analyst account.
For Singapore
Motilal Oswal Capital Markets Singapore Pte Limited is acting as an exempt financial advisor under section 23(1)(f) of the Financial Advisers Act(FAA) read with regulation 17(1)(d) of the Financial Advisors Regulations and is a
subsidiary of Motilal Oswal Securities Limited in India. This research is distributed in Singapore by Motilal Oswal Capital Markets Singapore Pte Limited and it is only directed in Singapore to accredited investors, as defined in the
Financial Advisers Regulations and the Securities and Futures Act (Chapter 289), as amended from time to time.
In respect of any matter arising from or in connection with the research you could contact the following representatives of Motilal Oswal Capital Markets Singapore Pte Limited:
Varun Kumar
Varun.kumar@motilaloswal.com
Contact : (+65) 68189232
Office Address:21 (Suite 31),16 Collyer Quay,Singapore 04931
Kadambari Balachandran
kadambari.balachandran@motilaloswal.com
(+65) 68189233 / 65249115
28 September 2016
Motilal Oswal Tower, Level 9, Sayani Road, Prabhadevi, Mumbai 400 025
Phone: +91 22 3982 5500 E-mail: reports@motilaloswal.com
Motilal Oswal Securities Ltd
6