LIC Housing Finance
BSE SENSEX
28,061
S&P CNX
8,698
7 October 2016
Update
| Sector:
Financials
CMP: INR602
Tailwinds to spreads
TP: INR758(+26%)
Buy
Gradual re-rating to continue
Stock Info
Bloomberg
Equity Shares (m)
52-Week Range (INR)
1, 6, 12 Rel. Per (%)
M.Cap. (INR b)
M.Cap. (USD b)
12M Avg Val (INR M)
Free float (%)
Financials Snapshot (INR b)
Y/E Mar
2016
2017E
2018E
LICHF IN
505.0
608 / 389
4/9/18
304.0
4.6
1108
59.7
With market borrowings its predominant source of funds, LICHF’s cost of
funds has declined faster than other HFCs in the last 3-6 months.
Continued bond purchases by the RBI in open market operations and repo
rate cuts would continue to drive down bond yields, which would in turn
favorably impact LICHF’s cost of funds.
The spread on LICHF’s incremental loans has increased to 2%+ and we expect
this to sustain, given its competitive loan pricing and cost of funds.
We believe current valuations do not factor in sustained spread
improvement. The stock is set for a re-rating; Buy.
NII
PPP
Adj. PAT
Adj. EPS (INR)
EPS Gr. (%)
BV/Sh (INR)
P/E (x)
P/BV (x)
RoAA (%)
RoE (%)
29.4
27.1
16.4
32.5
21.8
181.1
18.5
3.3
1.5
19.3
36.7
33.9
20.0
39.5
21.7
212.9
15.2
2.8
1.5
20.1
43.6
40.0
25.0
49.6
25.4
252.7
12.1
2.4
1.6
21.3
Large share of market borrowings favors LICHF
Over the last two years, LICHF has diversified its borrowing profile significantly.
Share of bank borrowings has declined from ~25% to ~10%, while the share of
market borrowings has increased to ~90%. In the last 18-24 months, while the repo
rate has been cut 175bp, banks have cut rates only by 75-100bp. G-Sec yields have
fallen more. As a result, HFCs with large share of bank borrowings have not
benefited as much as LICHF, which predominantly borrows from the market.
Continued RBI OMOs…
In 2014 and 2015, inflation was high; to counter this, the RBI sold bonds worth
INR1t in the market, causing liquidity deficit. With easing inflation, the RBI started
purchasing bonds through open market operations (OMOs) in December 2015.
Since then, its overall bond purchases have been close to INR1.9t. The OMOs have
resulted in G-Sec yields dropping 100-120bp in the past 6-9 months (see exhibits 1
and 2).
Our Economist expects further OMOs of INR700b over FY17.
Shareholding pattern (%)
As On
Jun-16 Mar-16 Jun-15
Promoter
40.3
40.3
40.3
DII
37.6
6.1
7.3
FII
0.0
27.5
37.4
Others
22.1
26.0
15.1
FII Includes depository receipts
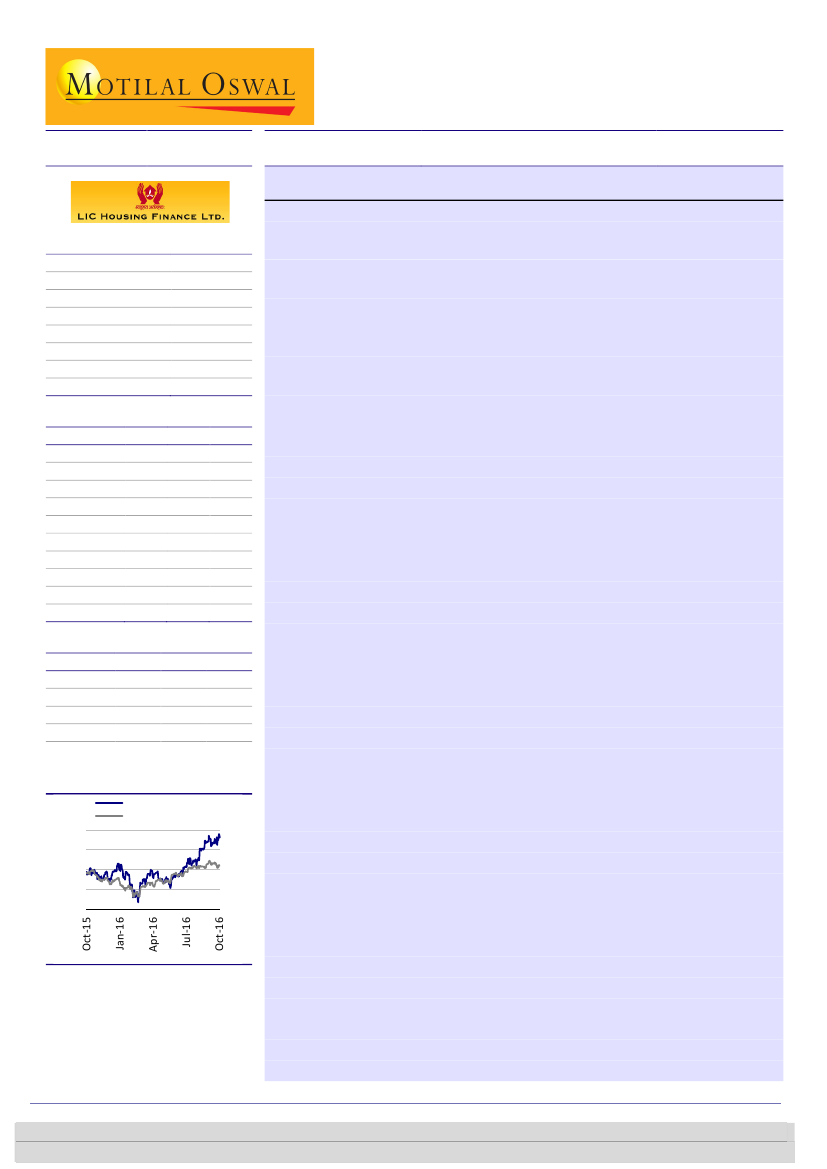
Stock Performance (1-year)
LIC Housing Fin.
Sensex - Rebased
610
550
490
430
370
…and repo rate cuts to drive bond yields lower
Repo rate and G-Sec yields are highly correlated. Over 2001-03, when the RBI cut
repo rate significantly, G-Sec yields fell even more sharply (see exhibit 3).
Our
Economist expects at least one repo rate cut by the end of FY17, with another 1-2
rate cuts in FY18. When we published our last update on LICHF in August, G-Sec
yields were 7.1%; since then, they have fallen to 6.7%.
Given continued RBI OMOs
and reduction in repo rate over the next 6-12 months, we believe G-Sec yields
could drop further over the next 12 months. LICHF has NCDs worth INR220b (~20%
of total outstanding borrowings) maturing in FY17 and FY18, which would help it to
save 30-40bp in cost of funds over the next two years. Among all HFCs in our
coverage, we believe LICHF would be the biggest beneficiary of falling yields.
Spread of AAA yields over GSec yields have narrowed significantly
Another big impact of the RBI OMOs has been that AAA bond spreads over GSec
yields have narrowed significantly. While the average spread has been ~80bp in the
Sunesh Khanna
(Sunesh.Khanna@MotilalOswal.com); +91 22 3982 5521
Alpesh Mehta
(Alpesh.Mehta@MotilalOswal.com)/Piran
Engineer
(Piran.Engineer@MotilalOswal.com); +91 22 6129 1539
Investors are advised to refer through important disclosures made at the last page of the Research Report.
Motilal Oswal research is available on www.motilaloswal.com/Institutional-Equities, Bloomberg, Thomson Reuters, Factset and S&P Capital.

LIC Housing Finance
past one year, it had increased to 1.5% in March 2016 due to the liquidity deficit.
However, since then, spreads have come off significantly to around 35bp today
(refer Exhibit 5), with most of the spread compression in August and September.
Given the liquidity situation today, we expect spreads to sustain at these levels.
2% spreads to sustain despite stable share of LAP
Over the last five quarters, LICHF has grown its LAP book rapidly. The share of LAP
increased from 4.6% in 4QFY15 to 9.3% in 1QFY17. On an incremental loans basis,
the share of LAPs increased from 17% in 1QFY16 to 37% in 1QFY17. Incremental
spread increased from 1.74% to 1.98% over the period. This has helped shore up
NIM to 2.6-2.7%. However, the management has indicated that it would not
increase the share of LAP any further. While this would put pressure on incremental
yields, LICHF would get the benefit of lower incremental cost of borrowings due to
falling G-Sec yields. We believe LICHF would maintain incremental spread above 2%.
We believe consistently achieving 2% incremental spread over the next few
quarters would be a trigger for the stock to re-rate in line with peers.
Loan pricing competitive
LICHF is currently originating pure floating rate loans at ~9.5% and other home loans
at ~10%. Banks are also originating loans at 9.3-9.5%. We believe banks would be
averse to reducing home loan rates further, as they would have to reduce MCLR, as
a result of which the whole loan book would get re-priced. Hence, we believe LICHF
would not need to reduce rates substantially to remain competitive.
Robust loan growth to continue
LICHF has a granular loan book with retail home loans comprising ~88% of the total
book and the LAP book comprising an additional ~10% of the total book. Since
around two-thirds of its loan sourcing is from LIC agents, LICHF is able access the
length and breadth of the country. We believe LICHF would be a big beneficiary of
the tax incentives announced in the FY17 Union Budget. It could gain some share
from banks due to competitive pricing. We expect loan book CAGR of 19% over
FY16-19.
Asset quality has remained strong consistently
LICHF has robust asset quality, with GNPA of 0.59% and NNPA of 0.29%. Asset
quality in individual loans is even better, with GNPA of 0.35%. This compares very
well with its private-sector housing finance peers. The company has sustained good
asset quality over the past several years due to its stringent underwriting discipline.
Loan-to-value ratio on incremental disbursements is 47%, down from 50% in FY15.
Installment-to-income ratio is 32%, down from 34% in FY15. Asset quality is
expected to remain stable, which would support RoE and drive re-rating.
Re-rating on the cards; Buy
LICHF stands to benefit significantly from the growing demand for mortgages
coupled with falling interest rates. Over the past few quarters, change in loan mix
has led to 2%+ incremental spread.
We expect 2% incremental spread to continue
and believe that the stock price does not factor in sustained spread improvement
due to falling G-Sec yields and narrowing AAA spreads.
Post an earnings growth of
22% in FY16, we expect this momentum to sustain and model 23% PAT CAGR over
FY16-19. RoE is set to cross 20% in FY17, which would drive further re-rating. The
stock trades at 2.4x FY18E BV, a discount to peers.
Buy
with a target price of INR758
(3x FY18E BV).
7 October 2016
2

LIC Housing Finance
Story in charts
Exhibit 1: 10-year G-Sec yield at 6.7%
8.0
7.5
7.0
6.5
6.0
Exhibit 2: 5-year G-Sec yield at 6.7%
8.0
7.5
7.0
6.5
6.0
Source: MOSL, Company
Exhibit 3: G-Sec yields and repo rate are highly correlated
10.0
9.0
8.0
7.0
6.0
5.0
4.0
10YR Gsec yield (%)
Repo Rate (%)
Source: MOSL, Company
Exhibit 4: Significant RBI OMOs in 2016
414
300
193
153
Exhibit 5: Yield spread between AAA and GSec has narrowed
9.5
AAA bond yield (%)
10YR GSec yield (%)
250
255
9.0
8.5
8.0
100
0
100
7.5
7.0
6.5
111
Source: MOSL, Company, RBI
Source: MOSL, Company; HDFC bond taken as proxy for AAA
7 October 2016
3

LIC Housing Finance
Exhibit 6: Gradual shift in borrowing mix
NCD
10.0
25.5
9.8
19.2
9.8
17.6
Bank borrowings
10.0
16.8
9.6
15.2
10.6
12.5
Others
10.0
12.7
9.6
10.8
Exhibit 7: Incremental cost of funds has fallen drastically
9.71
Borrowings (INR b)
9.55
9.03
8.71
8.96
8.88
8.41
74
103
116
156
98
9.07
8.70
Cost of funds (%)
64.5
71.0
72.6
73.2
75.2
76.9
77.3
79.6
28
116
89
104
Source: MOSL, Company
Exhibit 8: NCD maturity (INR b) – Good refi opportunity
Exhibit 9: Cost of funds to decline significantly
35.5
37.7
35.4
34.6
21.2
9.5
9.5
9.5
9.3
9.0
8.5
8.3
8.1
FY19E
3QFY17
4QFY17
1QFY18
2QFY18
3QFY18
4QFY18
FY13
FY14
FY15
FY16
FY17E
FY18E
Source: MOSL, Company
Exhibit 10: Trend in loan mix
Individual Loans
2.5
4.6
2.5
4.8
2.6
5.6
LAP
2.6
6.4
Developer
2.8
8.8
2.9
9.3
Exhibit 11: Trend in mix of incremental loan book
Individual Loans
17
8
29
33
LAP
3
Developer
5
45
11
37
92.9
92.7
91.8
84
91.0
88.5
4QFY16
87.8
1QFY17
3QFY15
-1
63
64
50
52
4QFY15
1QFY16
2QFY16
3QFY16
4QFY15
1QFY16
2QFY16
3QFY16
Source: MOSL, Company
7 October 2016
4

LIC Housing Finance
Exhibit 12: Home loan rates are at marginal premium to
MCLR
1-yr MCLR (%)
HDFCB
ICICIBC
AXSB
SBIN
BOB
9.05
9.05
9.25
9.05
9.35
Home loan rate (%)
9.40
9.30
9.45
9.25
9.65
Source: MOSL, Company
FY13
FY14
FY15
FY16
FY17E
FY18E
10.6
10.7
10.6
Exhibit 13: Loan yields too trending down
10.5
10.4
10.3
10.2
FY19E
Source: MOSL, Company
Exhibit 14: Incremental spreads (reported)
Incremental spreads
Exhibit 15: Incremental spreads will sustain at ~2.0%
Home loan
Yield (Incremental)
Share of disbursements
Incremental CoF
Weighted Avg Yield
Incremental Spreads
10.0%
88.0%
8.1%
10.2%
2.1%
Source: MOSL, Company
Non-retail
12.0%
12.0%
8.1%
Source: MOSL, Company
Exhibit 16: Bulk of loan sourcing through agents
HLA
3
4
11
19
DSA
3
5
9
18
CRA
3
3
9
20
Direct
4
2
9
20
LICHFL FSL
4
3
8
21
4
7
9
14
Exhibit 17: Disbursements share from top-7 cities declining
Top 7 cities
Others
49
49
52
53
54
54
63
65
65
65
64
66
51
51
48
47
46
46
4QFY15
1QFY16
2QFY16
3QFY16
4QFY16
1QFY17
4QFY15
1QFY16
2QFY16
3QFY16
4QFY16
1QFY17
Source: MOSL, Company
7 October 2016
5

LIC Housing Finance
Exhibit 19: Additional tax exemption
significantly reduces borrowing cost
INR
80
73
72
53
Loan Amount
Interest rate
Interest amount
Tax deduction
Tax Saving
Net Interest paid
GRUH
LICHF
Repco
HDFC
DEWH
IHFL
Effective interest rate
Earlier
3,500,000
10%
350,000
200,000
40,000
310,000
8.86%
of
INR50,000
Now
3,500,000
10%
350,000
250,000
50,000
300,000
8.57%
Exhibit 18: Share of retail home loans – high among peers
93
88
Source: MOSL, Company
Source: MOSL, Company, Assuming income tax slab of 20% for
borrower
Exhibit 20: Disbursement growth will remain robust
Disbursements (INR b)
22
20
19
18
growth %
19
18
Exhibit 21: Consistent AUM growth over the medium term
23
17
AUM (INR b)
19
16
19
growth %
19
19
4
244
FY13
253
FY14
303
FY15
362
FY16
428
FY17E
509
FY18E
602
FY19E
778
FY13
913
FY14
1,084
FY15
1,252
FY16
1,494
FY17E
1,782
FY18E
2,118
FY19E
Source: MOSL, Company
Exhibit 22: LTV and IIR have been declining…
LTV (%)
IRR (%)
Exhibit 23: … leading to superior asset quality v/s peers
GNPA %
0.98
0.75
0.56
0.59
0.84
3QFY15 4QFY15 1QFY16 2QFY16 3QFY16 4QFY16 1QFY17
Source: MOSL, Company
GRUH
LICHF
HDFC
IHFL
DEWH
Source: MOSL, Company
7 October 2016
6

LIC Housing Finance
Exhibit 24: DuPont analysis
LIC Housing Finance
Interest Income
Interest Expenses
Net Interest Income
Non interest Income
Fee Income
Treasury Income
Other Income
Net Income
Operating Expenses
Cost to income (%)
Employees
Others
Operating Profits
Provisions/write offs
PBT
Tax
Tax Rate (%)
PAT
Leverage (x)
RoE
FY15
10.9
8.6
2.3
0.3
0.1
0.1
0.0
2.6
0.4
15.2
0.1
0.3
2.2
0.0
2.2
0.7
34.1
1.4
12.6
17.5
FY16
10.9
8.3
2.6
0.2
0.1
0.1
0.0
2.8
0.4
14.7
0.1
0.3
2.4
0.1
2.3
0.8
35.2
1.5
13.2
19.3
FY17E
10.6
7.9
2.7
0.2
0.1
0.1
0.0
3.0
0.4
14.1
0.1
0.3
2.5
0.2
2.3
0.8
35.0
1.5
13.4
20.1
FY18E
10.4
7.6
2.7
0.2
0.1
0.1
0.0
2.9
0.4
14.4
0.1
0.3
2.5
0.1
2.4
0.8
34.0
1.6
13.7
21.3
FY19E
10.3
7.5
2.8
0.2
0.1
0.1
0.0
2.9
0.4
14.4
0.1
0.3
2.5
0.1
2.4
0.8
34.0
1.6
13.7
21.6
Source: MOSL, Company
Exhibit 25: LICHF P/B
3.8
3.0
2.3
1.5
0.8
0.0
1.7
P/B (x)
10 Yrs Avg(x)
2.5
Exhibit 26: HDFC P/B
8.0
6.3
4.5
2.8
1.0
4.7
P/B (x)
10 Yrs Avg(x)
5.4
Source: MOSL, Company
Exhibit 27: DEWH P/B
3.0
2.5
2.0
1.5
1.0
0.5
0.0
1.1
P/B (x)
10 Yrs Avg(x)
Exhibit 28: IHFL P/B
4.0
1.4
3.0
2.0
1.0
0.0
1.8
P/B (x)
5 Yrs Avg(x)
2.9
Source: MOSL, Company
7 October 2016
7

LIC Housing Finance
Exhibit 29: GRUH P/B
16.0
12.0
8.0
4.0
0.0
P/B (x)
10 Yrs Avg(x)
11.2
Exhibit 30: REPCO P/B
5.0
4.0
3.0
2.0
1.0
P/B (x)
3.3
3 Yrs Avg(x)
4.2
5.3
Source: MOSL, Company
7 October 2016
8

LIC Housing Finance
Valuation matrix
Financials: Valuation metrics
Rating
66
ICICIBC*
HDFCB
AXSB
KMB*
YES
IIB
IDFC Bk
FB
DCBB
JKBK
SIB
Private Aggregate
SBIN (cons)*
PNB
BOI
BOB
CBK
UNBK
OBC
INBK
ANDB
Public Aggregate
Banks Aggregate
HDFC*
LICHF
IHFL
GRHF
REPCO
DEWH
Housing Finance
RECL
POWF
Infra Finance
SHTF
MMFS
BAF
MUTH
SKSM
Asset Finance
NBFC Aggregate
Financials
Buy
Buy
Buy
Buy
Buy
Buy
Under Review
Buy
Under Review
Neutral
Buy
Buy
Neutral
Neutral
Buy
Neutral
Buy
Neutral
Buy
Buy
CMP
Mcap
EPS (INR)
P/E (x)
BV (INR)
FY17
145
332
243
208
390
333
43
50
69
146
30
234
189
239
157
498
314
410
300
109
FY18
160
386
274
240
471
385
46
54
78
162
32
253
200
255
173
527
348
428
324
114
P/BV (x)
RoA (%)
RoE (%)
Buy
Buy
Buy
Buy
Buy
Buy
Neutral
Neutral
Buy
Buy
Buy
Buy
Buy
(INR) (USDb) FY17 FY18 FY17 FY18
251
22.1
17.3 20.0 11.1 8.6
1,281 49.1
58.4 70.2 21.9 18.2
533
19.3
31.8 37.4 16.7 14.3
780
21.7
26.8 34.0 29.2 23.0
1,275
8.1
79.0 101.2 16.1 12.6
1,221 11.0
48.3 61.1 25.3 20.0
74
3.8
3.4
4.2 21.6 17.6
73
1.9
4.3
5.2 16.9 14.1
125
0.5
7.7
8.7 16.3 14.3
87
0.6
17.7 21.4 4.9 4.1
24
0.5
2.8
3.3
8.6 7.3
138.6
20.3 17.0
258
30.4
14.7 24.3 17.5 10.6
143
4.3
10.8 12.8 13.3 11.2
117
1.7
-10.8 21.6 -10.9 5.4
164
5.7
14.1 20.0 11.6 8.2
328
2.7
26.8 36.8 12.2 8.9
149
1.6
22.4 39.1 6.7 3.8
130
0.7
16.7 24.2 7.8 5.3
220
1.6
25.3 31.4 8.7 7.0
59
1.8
1.5
6.4 38.5 9.1
50.4
16.0 10.4
189.0
18.9 14.5
1,406 33.6
34.5 37.8 28.6 22.7
602
4.6
39.5 49.6 15.2 12.1
855
5.5
67.6 84.0 12.7 10.2
357
2.0
8.2 10.3 43.7 34.6
824
0.8
30.4 39.7 27.1 20.8
293
1.3
30.2 38.4 9.7 7.6
47.8
22.7 19.1
131
3.9
29.4 33.4 4.5 3.9
123
4.9
24.0 25.5 5.1 4.8
8.8
4.8 4.4
1,190
4.1
70.5 93.8 16.9 12.7
381
3.3
14.6 18.1 26.1 21.0
1,083
1.8
34.6 44.2 31.3 24.5
340
2.1
28.0 33.6 12.1 10.1
882
1.8
50.4 48.8 17.5 18.1
13.0
14.1 11.4
69.6
14.3 12.3
258.6
17.4 13.8
194
213
280
28
180
201
168
149
505
118
166
159
206
217
253
315
35
215
230
194
167
579
131
204
180
255
FY17 FY18 FY17 FY18 FY17 FY18
1.26 1.08 1.13 1.18 10.5 11.2
3.86 3.32 1.90 1.89 18.9 19.6
2.19 1.95 1.32 1.31 13.8 14.4
3.76 3.25 1.61 1.82 14.2 15.4
3.27 2.71 1.80 1.86 22.0 23.5
3.67 3.17 1.83 1.87 15.5 17.0
1.72 1.60 1.24 1.13 8.2 9.4
1.45 1.35 0.75 0.75 8.9 9.9
1.80 1.60 1.02 0.95 11.7 11.9
0.60 0.54 1.00 1.06 12.8 13.9
0.81 0.75 0.55 0.57 9.7 10.6
2.70 2.39
1.28 1.17 0.47 0.54 7.9 9.5
0.76 0.71 0.31 0.34 5.8 6.6
0.49 0.46 -0.16 0.29 -4.6 8.7
1.04 0.95 0.47 0.60 9.3 12.1
0.66 0.62 0.25 0.31 5.5 7.2
0.48 0.43 0.37 0.58 7.4 11.8
0.32 0.30 0.23 0.30 4.2 5.8
0.73 0.68 0.57 0.64 8.7 10.0
0.54 0.52 0.08 0.31 1.4 5.8
0.80 0.76
1.66 1.52
4.44 3.52 1.84 1.82 19.4 19.0
2.83 2.38 1.49 1.55 20.1 21.3
3.05 2.72 3.68 3.78 25.3 28.3
12.64 10.22 2.31 2.31 32.0 32.7
4.59 3.84 2.15 2.20 18.3 20.1
1.45 1.27 1.27 1.39 16.4 17.8
4.53 4.00
0.78 0.68 2.63 2.54 18.8 18.5
0.83 0.74 2.37 2.12 16.8 16.2
0.81 0.71
2.36 2.06 2.43 2.75 14.8 17.2
3.22 2.90 2.02 2.19 12.9 14.5
6.51 5.31 3.48 3.38 22.8 23.9
2.14 1.89 3.66 3.57 18.7 19.9
4.28 3.46 6.73 4.25 32.9 21.2
2.33 2.07
2.58 2.27
1.83 1.67
*Multiples adj. for value of key ventures/Investments; For ICICI Bank and HDFC Ltd BV is adjusted for investments in subsidiaries
7 October 2016
9

LIC Housing Finance
Financials and valuations
Income Statement
Y/E March
Interest Income
Interest Expense
Net Interest Income
Change (%)
Fee Income
Income from Investments
Other Income
Net Income
Change (%)
Operating Expenses
Operating Income
Change (%)
Provisions/write offs
PBT
Tax
Tax Rate (%)
PAT
Change (%)
Adjusted PAT
Change (%)
Proposed Dividend
2014
90,733
71,744
18,990
23.8
1,080
1,083
450
21,603
24.6
3,133
18,470
27.2
215
18,255
5,083
27.8
13,172
28.7
12,017
17.4
2,657
2015
105,467
83,102
22,364
17.8
1,227
815
343
24,749
14.6
3,885
20,864
13.0
-20
20,884
7,158
34.3
13,727
4.2
13,466
12.1
3,022
2016
122,508
93,068
29,441
31.6
1,453
893
0
31,787
28.4
4,688
27,099
29.9
1,463
25,635
9,028
35.2
16,608
21.0
16,401
21.8
3,386
2017E
141,885
105,165
36,719
24.7
1,777
993
0
39,489
24.2
5,560
33,929
25.2
2,900
31,029
10,860
35.0
20,169
21.4
19,961
21.7
4,112
2018E
166,680
123,123
43,557
18.6
2,111
1,093
0
46,761
18.4
6,754
40,007
17.9
1,760
38,247
13,004
34.0
25,243
25.2
25,032
25.4
5,146
(INR Million)
2019E
195,816
143,312
52,504
20.5
2,496
1,193
0
56,193
20.2
8,091
48,101
20.2
2,051
46,050
15,657
34.0
30,393
20.4
30,182
20.6
6,196
(INR Million)
2019E
1,010
150,800
151,810
1,918,889
18.5
2,070,699
3,316
7.0
2,085,749
18.5
948
-19,313
2,070,699
Balance Sheet
Y/E March
Capital
Reserves & Surplus
Net Worth
Borrowings
Change (%)
Total Liabilities
Investments
Change (%)
Loans
Change (%)
Net Fixed Assets
Net Current Assets
Total Assets
E: MOSL Estimates
2014
1,010
74,319
75,329
820,356
19.3
895,685
1,993
-89.3
913,410
17.4
756
-20,474
895,685
2015
1,010
77,174
78,184
965,319
17.7
1,043,503
2,371
19.0
1,083,610
18.6
797
-43,275
1,043,503
2016
1,010
90,450
91,460
1,109,360
14.9
1,200,820
2,609
10.0
1,251,730
15.5
849
-54,368
1,200,820
2017E
1,010
106,507
107,517
1,365,114
23.1
1,472,631
2,869
10.0
1,483,820
18.5
892
-14,950
1,472,631
2018E
1,010
126,604
127,614
1,619,678
18.6
1,747,291
3,099
8.0
1,760,519
18.6
925
-17,252
1,747,291
7 October 2016
10

LIC Housing Finance
Financials and valuations
Ratios
Y/E March
Spreads Analysis (%)
Avg. Yield on loans
Avg. Yield on Earning Assets
Avg. Cost-Int. Bear. Liab.
Int. Spread on Hsg. Loans
Net Int. Margin on Hsg. Loans
Profitability Ratios (%)
Adj RoAE
Adj RoAA
Int. Expended/Int.Earned
Other Inc./Net Income
Efficiency Ratios (%)
Fees/Operating income
Op. Exps./Net Income
Empl. Cost/Op. Exps.
Asset-Liability Profile (%)
Loans/Borrowings Ratio
Debt/Equity (x)
Gross NPAs (Rs m)
Gross NPAs to Adv.
Net NPAs (Rs m)
Net NPAs to Adv.
CAR
2014
10.7
10.5
9.5
1.21
2.25
2015
10.6
10.3
9.3
1.25
2.24
2016
10.5
10.3
9.0
1.52
2.52
2017E
10.4
10.1
8.5
1.9
2.68
2018E
10.3
10.0
8.3
2.0
2.69
2019E
10.2
9.9
8.1
2.1
2.73
17.2
1.5
79.1
2.1
17.5
1.4
78.8
1.4
19.3
1.5
76.0
0.0
20.1
1.5
74.1
0.0
21.3
1.6
73.9
0.0
21.6
1.6
73.2
0.0
1.2
14.5
33.1
1.1
15.7
34.1
1.2
14.7
32.1
1.2
14.1
33.8
1.2
14.4
34.8
1.3
14.4
34.8
111.3
10.9
6,090
0.7
3,534
0.4
16.4
112.3
12.3
4,947
0.5
2,344
0.2
16.5
112.8
12.1
5,489
0.4
2,744
0.2
15.5
108.7
12.7
6,114
0.4
3,057
0.2
14.5
108.7
12.7
6,708
0.4
3,354
0.2
13.5
108.7
12.6
7,412
0.4
3,706
0.2
10.5
Valuation
Book Value (INR)
Growth (%)
Price-BV (x)
Adjusted BV (INR)
Price-ABV (x)
EPS (INR)
Growth (%)
Price-Earnings (x)
Adj. EPS (INR)
Growth (%)
Price-Earnings (x)
Dividend Per Share
Dividend Yield (%)
E: MOSL Estimates
149.2
16.2
4.0
147.3
4.0
26.1
28.7
23.1
23.8
17.4
25.3
4.5
0.7
154.8
3.8
3.9
153.6
3.9
27.2
4.2
22.1
26.7
12.1
22.6
5.0
0.8
181.1
17.0
3.3
179.6
3.3
32.9
21.0
18.3
32.5
21.8
18.5
5.8
1.0
212.9
17.6
2.8
211.3
2.8
39.9
21.4
15.1
39.5
21.7
15.2
7.0
1.2
252.7
18.7
2.4
250.9
2.4
50.0
25.2
12.0
49.6
25.4
12.1
8.7
1.5
300.6
19.0
2.0
298.6
2.0
60.2
20.4
10.0
59.8
20.6
10.1
10.5
1.7
7 October 2016
11

This document has been prepared by Motilal Oswal Securities Limited (hereinafter referred to as Most) to provide information about the company (ies) and/sector(s), if any, covered in the report and may be distributed by it and/or
LIC Housing Finance
its affiliated company(ies). This report is for personal information of the selected recipient/s and does not construe to be any investment, legal or taxation advice to you. This research report does not constitute an offer, invitation or
inducement to invest in securities or other investments and Motilal Oswal Securities Limited (hereinafter referred as MOSt) is not soliciting any action based upon it. This report is not for public distribution and has been furnished to
you solely for your general information and should not be reproduced or redistributed to any other person in any form. This report does not constitute a personal recommendation or take into account the particular investment
objectives, financial situations, or needs of individual clients. Before acting on any advice or recommendation in this material, investors should consider whether it is suitable for their particular circumstances and, if necessary, seek
professional advice. The price and value of the investments referred to in this material and the income from them may go down as well as up, and investors may realize losses on any investments. Past performance is not a guide
for future performance, future returns are not guaranteed and a loss of original capital may occur.
MOSt and its affiliates are a full-service, integrated investment banking, investment management, brokerage and financing group. We and our affiliates have investment banking and other business relationships with a some
companies covered by our Research Department. Our research professionals may provide input into our investment banking and other business selection processes. Investors should assume that MOSt and/or its affiliates are
seeking or will seek investment banking or other business from the company or companies that are the subject of this material and that the research professionals who were involved in preparing this material may educate
investors on investments in such business . The research professionals responsible for the preparation of this document may interact with trading desk personnel, sales personnel and other parties for the purpose of gathering,
applying and interpreting information. Our research professionals are paid on twin parameters of performance & profitability of MOSt.
MOSt generally prohibits its analysts, persons reporting to analysts, and members of their households from maintaining a financial interest in the securities or derivatives of any companies that the analysts cover. Additionally,
MOSt generally prohibits its analysts and persons reporting to analysts from serving as an officer, director, or advisory board member of any companies that the analysts cover. Our salespeople, traders, and other professionals or
affiliates may provide oral or written market commentary or trading strategies to our clients that reflect opinions that are contrary to the opinions expressed herein, and our proprietary trading and investing businesses may make
investment decisions that are inconsistent with the recommendations expressed herein. In reviewing these materials, you should be aware that any or all of the foregoing among other things, may give rise to real or potential
conflicts of interest. MOSt and its affiliated company(ies), their directors and employees and their relatives may; (a) from time to time, have a long or short position in, act as principal in, and buy or sell the securities or derivatives
thereof of companies mentioned herein. (b) be engaged in any other transaction involving such securities and earn brokerage or other compensation or act as a market maker in the financial instruments of the company(ies)
discussed herein or act as an advisor or lender/borrower to such company(ies) or may have any other potential conflict of interests with respect to any recommendation and other related information and opinions.; however the
same shall have no bearing whatsoever on the specific recommendations made by the analyst(s), as the recommendations made by the analyst(s) are completely independent of the views of the affiliates of MOSt even though
there might exist an inherent conflict of interest in some of the stocks mentioned in the research report
Reports based on technical and derivative analysis center on studying charts company's price movement, outstanding positions and trading volume, as opposed to focusing on a company's fundamentals and, as such, may not
match with a report on a company's fundamental analysis. In addition MOST has different business segments / Divisions with independent research separated by Chinese walls catering to different set of customers having various
objectives, risk profiles, investment horizon, etc, and therefore may at times have different contrary views on stocks sectors and markets.
Unauthorized disclosure, use, dissemination or copying (either whole or partial) of this information, is prohibited. The person accessing this information specifically agrees to exempt MOSt or any of its affiliates or employees from,
any and all responsibility/liability arising from such misuse and agrees not to hold MOSt or any of its affiliates or employees responsible for any such misuse and further agrees to hold MOSt or any of its affiliates or employees free
and harmless from all losses, costs, damages, expenses that may be suffered by the person accessing this information due to any errors and delays. The information contained herein is based on publicly available data or other
sources believed to be reliable. Any statements contained in this report attributed to a third party represent MOSt’s interpretation of the data, information and/or opinions provided by that third party either publicly or through a
subscription service, and such use and interpretation have not been reviewed by the third party. This Report is not intended to be a complete statement or summary of the securities, markets or developments referred to in the
document. While we would endeavor to update the information herein on reasonable basis, MOSt and/or its affiliates are under no obligation to update the information. Also there may be regulatory, compliance, or other reasons
that may prevent MOSt and/or its affiliates from doing so. MOSt or any of its affiliates or employees shall not be in any way responsible and liable for any loss or damage that may arise to any person from any inadvertent error in
the information contained in this report. MOSt or any of its affiliates or employees do not provide, at any time, any express or implied warranty of any kind, regarding any matter pertaining to this report, including without limitation
the implied warranties of merchantability, fitness for a particular purpose, and non-infringement. The recipients of this report should rely on their own investigations.
This report is intended for distribution to institutional investors. Recipients who are not institutional investors should seek advice of their independent financial advisor prior to taking any investment decision based on this report or
for any necessary explanation of its contents.
Most and it’s associates may have managed or co-managed public offering of securities, may have received compensation for investment banking or merchant banking or brokerage services, may have received any compensation
for products or services other than investment banking or merchant banking or brokerage services from the subject company in the past 12 months.
Most and it’s associates have not received any compensation or other benefits from the subject company or third party in connection with the research report.
Subject Company may have been a client of Most or its associates during twelve months preceding the date of distribution of the research report
MOSt and/or its affiliates and/or employees may have interests/positions, financial or otherwise of over 1 % at the end of the month immediately preceding the date of publication of the research in the securities mentioned in this
report. To enhance transparency, MOSt has incorporated a Disclosure of Interest Statement in this document. This should, however, not be treated as endorsement of the views expressed in the report.
Motilal Oswal Securities Limited is registered as a Research Analyst under SEBI (Research Analyst) Regulations, 2014. SEBI Reg. No. INH000000412
Pending Regulatory inspections against Motilal Oswal Securities Limited:
SEBI pursuant to a complaint from client Shri C.R. Mohanraj alleging unauthorized trading, issued a letter dated 29th April 2014 to MOSL notifying appointment of an Adjudicating Officer as per SEBI regulations to hold inquiry and
adjudge violation of SEBI Regulations; MOSL replied to the Show Cause Notice whereby SEBI granted us an opportunity of Inspection of Documents. Since all the documents requested by us were not covered we have requested
to SEBI vide our letter dated June 23, 2015 to provide pending list of documents for inspection.
List of associate companies of Motilal Oswal Securities Limited -
Click here to access detailed report
Analyst Certification
The views expressed in this research report accurately reflect the personal views of the analyst(s) about the subject securities or issues, and no part of the compensation of the research analyst(s) was, is, or will be directly or
indirectly related to the specific recommendations and views expressed by research analyst(s) in this report. The research analysts, strategists, or research associates principally responsible for preparation of MOSt research
receive compensation based upon various factors, including quality of research, investor client feedback, stock picking, competitive factors and firm revenues
Disclosure of Interest Statement
Analyst ownership of the stock
Served as an officer, director or employee -
Disclosures
LIC Housing Finance
No
No
A graph of daily closing prices of securities is available at www.nseindia.com and http://economictimes.indiatimes.com/markets/stocks/stock-quotes
Regional Disclosures (outside India)
This report is not directed or intended for distribution to or use by any person or entity resident in a state, country or any jurisdiction, where such distribution, publication, availability or use would be contrary to law, regulation or
which would subject MOSt & its group companies to registration or licensing requirements within such jurisdictions.
For Hong Kong:
This report is distributed in Hong Kong by Motilal Oswal capital Markets (Hong Kong) Private Limited, a licensed corporation (CE AYY-301) licensed and regulated by the Hong Kong Securities and Futures
Commission (SFC) pursuant to the Securities and Futures Ordinance (Chapter 571 of the Laws of Hong Kong) “SFO”. As per SEBI (Research Analyst Regulations) 2014 Motilal Oswal Securities (SEBI Reg No. INH000000412)
has an agreement with Motilal Oswal capital Markets (Hong Kong) Private Limited for distribution of research report in Kong Kong. This report is intended for distribution only to “Professional Investors” as defined in Part I of
Schedule 1 to SFO. Any investment or investment activity to which this document relates is only available to professional investor and will be engaged only with professional investors.” Nothing here is an offer or solicitation of
these securities, products and services in any jurisdiction where their offer or sale is not qualified or exempt from registration. The Indian Analyst(s) who compile this report is/are not located in Hong Kong & are not conducting
Research Analysis in Hong Kong.
For U.S.
Motilal Oswal Securities Limited (MOSL) is not a registered broker - dealer under the U.S. Securities Exchange Act of 1934, as amended (the"1934 act") and under applicable state laws in the United States. In addition MOSL is
not a registered investment adviser under the U.S. Investment Advisers Act of 1940, as amended (the "Advisers Act" and together with the 1934 Act, the "Acts), and under applicable state laws in the United States. Accordingly, in
the absence of specific exemption under the Acts, any brokerage and investment services provided by MOSL, including the products and services described herein are not available to or intended for U.S. persons.
This report is intended for distribution only to "Major Institutional Investors" as defined by Rule 15a-6(b)(4) of the Exchange Act and interpretations thereof by SEC (henceforth referred to as "major institutional investors"). This
document must not be acted on or relied on by persons who are not major institutional investors. Any investment or investment activity to which this document relates is only available to major institutional investors and will be
engaged in only with major institutional investors. In reliance on the exemption from registration provided by Rule 15a-6 of the U.S. Securities Exchange Act of 1934, as amended (the "Exchange Act") and interpretations thereof by
the U.S. Securities and Exchange Commission ("SEC") in order to conduct business with Institutional Investors based in the U.S., MOSL has entered into a chaperoning agreement with a U.S. registered broker-dealer, Motilal
Oswal Securities International Private Limited. ("MOSIPL"). Any business interaction pursuant to this report will have to be executed within the provisions of this chaperoning agreement.
The Research Analysts contributing to the report may not be registered /qualified as research analyst with FINRA. Such research analyst may not be associated persons of the U.S. registered broker-dealer, MOSIPL, and
therefore, may not be subject to NASD rule 2711 and NYSE Rule 472 restrictions on communication with a subject company, public appearances and trading securities held by a research analyst account.
For Singapore
Motilal Oswal Capital Markets Singapore Pte Limited is acting as an exempt financial advisor under section 23(1)(f) of the Financial Advisers Act(FAA) read with regulation 17(1)(d) of the Financial Advisors Regulations and is a
subsidiary of Motilal Oswal Securities Limited in India. This research is distributed in Singapore by Motilal Oswal Capital Markets Singapore Pte Limited and it is only directed in Singapore to accredited investors, as defined in the
Financial Advisers Regulations and the Securities and Futures Act (Chapter 289), as amended from time to time.
Kadambari Balachandran
kadambari.balachandran@motilaloswal.com
(+65) 68189233 / 65249115
In respect of any matter arising from or in connection with the research you could contact the following representatives of Motilal Oswal Capital Markets Singapore Pte Limited:
Varun Kumar
Varun.kumar@motilaloswal.com
Contact : (+65) 68189232
Office Address:21 (Suite 31),16 Collyer Quay,Singapore 04931
Motilal Oswal Securities Ltd
7 October 2016
Motilal Oswal Tower, Level 9, Sayani Road, Prabhadevi, Mumbai 400 025
Phone: +91 22 3982 5500 E-mail: reports@motilaloswal.com
12