13 October 2016
Q2FY17 Results Update | Sector: Financials
IndusInd Bank
Buy
BSE SENSEX
28,082
Bloomberg
Equity Shares (m)
M.Cap.(INRb) / (USDb)
52-Week Range (INR)
1, 6, 12 Rel. Per (%)
Avg Val, INRm
Free float (%)
S&P CNX
8,709
IIB IN
595.8
726/10.8
1,255 / 799
3/14/26
1,360
85.1
CMP: INR1,222
TP: INR1,400(+15%)
Financials & Valuations (INR b)
2016 2017E 2018E
Y/E Mar
NII
45.2
60.3
74.6
OP
41.4
53.6
65.7
NP
22.9
28.8
36.3
NIM (%)
4.0
4.3
4.3
EPS (INR)
38.4
48.4
60.9
EPS Gr. (%)
13.4
25.8
26.0
BV/Sh. (INR)
291
333
385
ABV/Sh. (INR)
288
330
383
RoE (%)
16.6
15.5
17.0
RoA (%)
1.8
1.8
1.9
Payout (%)
18.5
14.0
14.0
Valuations
P/E (X)
31.8
25.3
20.0
P/BV (X)
4.2
3.7
3.2
P/ABV (X)
4.2
3.7
3.2
Div. Yield (%)
0.4
0.5
0.6
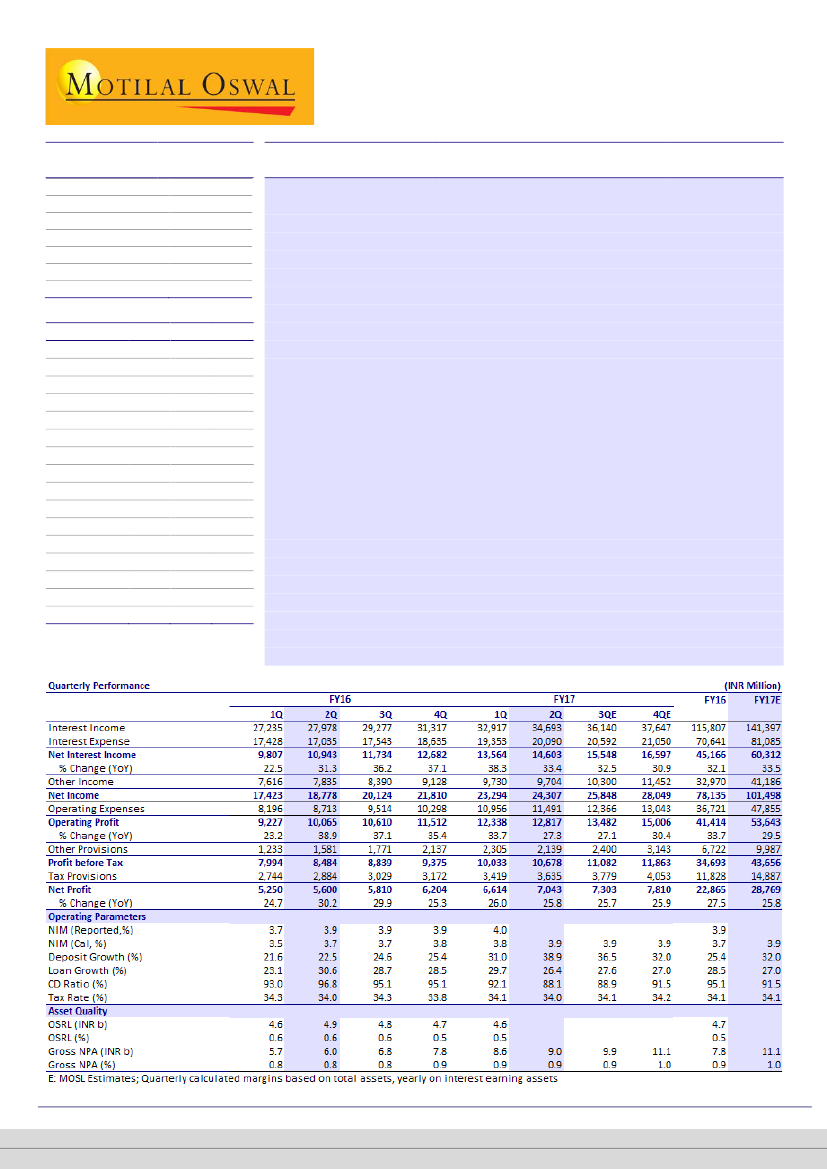
In-line: Strong core operating performance, stable asset quality
IndusInd Bank’s (IIB) 1QFY17 PAT grew 26% YoY (in line with expectations) to
INR7b, led by strong core PPoP growth of 27% YoY and 9% QoQ. Asset quality
remained stable QoQ, with GNPA at 90bp and stable PCR of 59%.
NII growth (33% YoY, 8% QoQ) was driven by 27% YoY loan growth and uptick
in NIM to 4% (v/s 3.97% in 1QFY17 and 3.88% in 2QFY16). Core fee income
growth, which came in marginally below loan growth at 23% YoY, was broad-
based, with all segments barring FX income contributing to growth. Investment
banking fees remained strong at 15% of PBT.
Corporate/consumer loans exhibited robust 26/27% YoY growth, resulting in a
60:40 loan mix at the end of the quarter. However, adjusting for the gems and
jewelry and the microfinance portfolio, which are included in corporate loans,
the mix would be close to 50:50.
Deposit growth witnessed a sequential uptick to 39% from 31% in 1QFY17. This
was driven by strong CASA deposit growth. There were one-off items that
contributed to strong CA growth. As at the end of the quarter, CASA ratio stood
at 36.5% compared to 34.4% in 1QFY17.
Other highlights:
(a) Restructured loans declined to 0.44% of loan book, as one
account slipped into NPA, and (b) CET1 was strong at 14.68% (-13bp QoQ).
Maintaining estimates; FY16-19E EPS CAGR of 26%:
In the planning cycle-3, which
concludes in FY17, IIB’s key focus is to scale up its operations using a 3D strategy:
Dominate (to be among the top three banks in home markets), Differentiate
(extensive use of technology and cross-sell), and Diversify (new products). Strong
core profitability (3% of average assets v/s private banks’ average of 2.5% and
HDFCB’s 2.7%), improving CASA ratio (best among mid-sized private banks), and
healthy return ratios (1.9%+ RoA and 16-18% RoE) are key positives.
Buy;
our
target price is INR1,400 (3.4x September 2018E BV).
Alpesh Mehta
(Alpesh.Mehta@MotilalOswal.com); +91 22 3982 5415
Sunesh Khanna
(Sunesh.Khanna@MotilalOswal.com); +91 22 3982 5521
Investors are advised to refer through important disclosures made at the last page of the Research Report.
Motilal Oswal research is available on www.motilaloswal.com/Institutional-Equities, Bloomberg, Thomson Reuters, Factset and S&P Capital.

IndusInd Bank
Exhibit 1: Quarterly Performance vs expectation
Y/E March
Net Interest Income
% Change (Y-o-Y)
Other Income
Net Income
Operating Expenses
Operating Profit
% Change (Y-o-Y)
Other Provisions
Profit before Tax
Tax Provisions
Net Profit
% Change (Y-o-Y)
2QFY17E
14,176
30
10,283
24,459
11,441
13,018
29
2,400
10,618
3,610
7,008
25
2QFY17A
14,603
33
9,704
24,307
11,491
12,817
27
2,139
10,678
3,635
7,043
26
V/S our Est
3
-6
-1
0
-2
-11
1
1
0
Provisions marginally lower
Comments
NIMs inline; Loan growth better than expected
Trading gain lower than expected; Processing fees
marginally lower QoQ
NIMs compensate for lower trading gains
Opex under control
Largely in line with estimates
Source: Company, MOSL
NIMs inch up higher driven by lower cost of funds
NIMs have reached to 4%
mark, and should stay
largely stable hereon
Reported NIM increased 3bp sequentially and 12bp YoY to 4.0%. This was driven
primarily by lower cost of funds, partially offset by lower yields
Cost of deposits declined 33bp sequentially to 6.6% driven by higher share of
CASA deposits. At the same time, bulk borrowings declined 29% YoY, resulting in
improved borrowing mix.
Yields in the corporate book declined 26bp QoQ due to MCLR cuts as well as
increased share of loans to higher rated corporates. On the other hand, yields in
the consumer finance book declined only 5bps sequentially to 14.57% as the
book is primarily fixed rate.
Management expects margins to remain broadly stable going forward.
Traction in CASA continues; CASA ratio picks up to 36.5%
Traction in CASA deposits continued as it grew 17% QoQ and 46% YoY. Overall
CASA ratio increased to 36.5% from 34.4% in the prior quarter.
CA deposit ratio spiked from 15.7% in 1QFY17 to 18.2% in 2QFY17. This was on
account of companies depositing IPO float money as well as deposits from some
government companies’ stock buybacks that happened towards the end of the
quarter.
Management is confident of building further on the SA momentum, even in a
declining interest rate scenario, as the wide product suites developed over the
last few quarters and higher cross-sell would ensure customer stickiness.
Net stressed loans remain very low
There was marginal
improvement in GNPA ratio
and restructured assets
Both GNPA (0.90%) and NNPA (0.37%) marginally ticked lower sequentially.
Slippages in the corporate portfolio continued to decline (INR730m in 2QFY17
v/s INR 940m in 1QFY17). On the other hand, slippages in the consumer finance
portfolio trended higher (INR1.88b in2QFY17 v/s INR1.59b in 1QFY17). Overall
slippage ratio improved 3bp QoQ to 1.08% of loans.
Management clarified that increase in GNPA ratio in the 2-Wheeler segment
was due to customer defaults on account of mandatory switching from PDC to
ECS. However, those customers continue to service loans. Management believes
that the GNPA ratio in this segment has peaked.
13 October 2016
2

IndusInd Bank
The loans given to the Punjab government are classified as standard, yet as per
RBI mandate, all banks are holding 15% provisions against it.
Restructured loans declined 5bp to 0.44% on account of one large account
slipping into NPA.
Provision coverage ratio stayed stable at 59% sequentially. Management
believes that given the high share of retail loans, the PCR is adequate.
Exhibit 2: CV asset quality stabilizing, credit cards delinquencies trending higher (%)
CV
Utility
CE
3W
2W
Cars
LAP/HL/PL
Cards
3QFY15
1.4
1.0
1.6
0.9
2.4
0.5
0.3
1.5
4QFY15
1.3
1.1
1.4
0.9
2.5
0.6
0.3
1.2
1QFY16
1.2
1.1
1.5
1.0
2.7
0.6
0.5
1.3
2QFY16
1.1
1.0
1.6
0.8
2.8
0.4
0.4
1.4
3QFY16
1.1
1.0
1.5
0.8
3.0
0.4
0.6
1.5
4QFY16
1.0
1.2
1.3
1.0
3.0
0.5
0.7
1.5
1QFY17
1.1
1.3
1.4
1.1
3.2
0.5
0.7
1.7
2QFY17
1.1
1.2
1.4
1.0
3.6
0.5
0.7
1.7
Source: MOSL, Company
Continued traction in fee income
Fee growth was broad-
based, barring FX fee
growth; Investment banking
fees increased sharply QoQ
Growth in fee income was broad based with all segments, barring FX income,
contributing to growth.
FX income was down 8%, primarily on account of stable rupee.
Loan processing fees were up a healthy 39% YoY, driven by increased corporate
loan renewals.
Distribution fees, too, were up 31% YoY driven by strong corporate relationships
The company did 23 investment banking deals in the quarters, resulting in 41%
YoY growth in IB fees.
Exhibit 3: Fees grew 23% YoY led by strong traction in trade related fees
Trade related
Processing fees
Forex - Clients
Third Party Product
Investment banking
General banking
Fee income
2QFY17
1,025
2,015
1,556
1,558
1,608
494
8,256
1QFY17
1,093
2,151
1,510
1,367
1,143
555
7,819
2QFY16
844
1,448
1,696
1,192
1,140
414
6,733
QoQ (%)
(6)
(6)
3
14
41
(11)
6
YoY (%)
22
39
(8)
31
41
19
23
Source: MOSL, Company
13 October 2016
3

IndusInd Bank
Other highlights
Exhibit 4: RWA to assets remained elevated at 83%
% of Total Assets
7
3
75
6
4
75
Credit Risk
7
4
70
7
4
72
Market Risk
7
3
73
8
4
71
Operational Risk
8
3
72
7
4
71
8
4
68
Source: MOSL, Company
2QFY17 conference call highlights
Liability franchise
CA deposit ratio spiked from 15.7% in 1QFY17 to 18.2% in 2QFY17. This was on
account of companies depositing IPO float money as well as deposits from some
government companies’ stock buybacks that happened towards the end of the
quarter
Provisioning / Asset quality
IIB sold loans worth INR410m during the quarter. As a result, the outstanding SR
book increased from INR2.21b to INR2.37b.
IIB also has five accounts under the SDR scheme. Management expects four
accounts to be resolved soon. However, the overall exposure outstanding is
small (management commented that it’s less than the restructured book)
Management stated that delinquencies in the LAP portfolio have been in the
range of 35-45bp and expects it to stay put. The average ticket size of LAP is
INR8m. Maharashtra contributes to 36% of the total LAP book, while NCR
comprises 15%. Yields in this segment are ~11.9%
The PL portfolio has higher delinquencies than LAP at around 75-90bp.
Management clarified that increase in GNPA ratio in the 2-Wheeler segment
was due to customer defaults on account of mandatory switching from PDC to
ECS. However, those customers continue to service loans. Management believes
that the GNPA ratio in this segment has peaked.
The loans given to the Punjab government are classified as standard, yet as per
RBI mandate, all banks are holding 15% provisions against it. Banks will be
allowed to release 10% provisions in Jan, 2018 and would have to hold the
remaining 5% till the tenure of the loan
Management reiterated credit cost guidance of 60bp for the quarter.
Fee income
The company did 23 investment banking deals in the quarters, resulting in 41%
YoY growth in IB fees.
13 October 2016
4

IndusInd Bank
General
Management expects to sustain 4% NIMs despite MCLR cuts, due to increasing
share of consumer finance portfolio as well as better cost of funds on account of
lower bulk borrowings.
Management is bullish on the CV cycle from a 2-3 year perspective. Currently,
yields in the CV segment range from 10% to 11.5%. Historically, the LGD has
been in the range of 30-35%.
MFI AUM stands at around INR30b. Management continues to be bullish on
prospects in the microfinance segment.
The bank has 292 branches in ‘Home Markets’, i.e., markets where it wants to
be a top player with at least 4-5% share in CASA deposits.
Average ticket size in the mid-corporate segment is INR150-200m
The bank is on track to reach their goal of 1200 branches by end-FY17.
Currently, around 320 branches are less than years old. These branches are yet
to operate at optimal utilization.
13 October 2016
5

IndusInd Bank
Valuation and view
Strong core profitability (3%+ of average assets v/s private banks average of
2.5% and HDFCB of 2.7%), improving CASA ratio (best amongst mid-sized private
banks), healthy return ratios (ROA of 1.9%+ and ROE of 15-17% and
capitalization (CET1 ratio of ~14.7%) are key positives. Third phase of growth
cycle is likely to focus on building scale with 3Ds strategy of Dominate (among
top 3 banks in home markets), Differentiate (extensive use of technology and
cross sell) and Diversify (new products, payment solution etc.). Management’s
execution in first two planning phases has been impeccable and increases our
comfort despite rich valuations
We expect underlying growth in consumer finance division product to show
continued revival with broad-based growth in 2-wheelers, 3-wheelers and
equipment loans in addition to the strong traction in CV loans, which contribute
~31% of the consumer finance division. Further, new product additions are also
likely to drive growth. IIB is already witnessing healthy growth in LAP and credit
cards. Corporate loan growth is likely to be opportunistic (based on spreads
available). Overall, we model in loan growth of 27% CAGR over FY16-19 and we
do not envisage downside risk to our loan growth estimates as IIB has levers
(selling down less loans, less project loan exposure) available in the balance
sheet.
NIMs are expected to remain largely stable to improving led by higher share of
retail liabilities, expected improvement in loan mix towards high yielding CFD,
benefit of falling interest rate cycle and higher share of fixed rate loans.
Close-to-customer business model of CV financing helped the bank maintain
strong asset quality performance, despite tough times. In our view, CV cycle has
bottomed out which would help reduce concerns over asset quality.
Overall superior margins, focused fee income strategy and control over C/I ratio
will keep earnings momentum healthy (~26% CAGR over FY16-19). Capitalization
remains one of the best in the industry at 14.7% CET1 ratio. Maintain Buy with a
target price of INR 1,400 (3.4x September 2018 BV based on RI model). Key
assumptions in our RI model are a) Cost of equity of 13.3%, b) extended forcast
average growth of 17% for 17 years and c) Terminal growth of 5%.
Exhibit 6: One year forward P/E
Avg(x)
3.4
Min(x)
3.3
40
30
20
16.3
3.7
22.3
PE (x)
Peak(x)
Avg(x)
Min(x)
34.4
Exhibit 5: One year forward P/BV
4.3
3.5
2.7
1.9
1.1
0.3
2.2
0.6
PB (x)
Peak(x)
10
0
Source: MOSL, Company
13 October 2016
6

IndusInd Bank
Exhibit 7: DuPont Analysis: Improved profitability to continue to drive RoA higher
Y/E March
Net Interest Income
Core Fee Income
Core Income
Operating Expenses
Cost to Core Income
Employee cost
Others
Core operating Profits
Non Interest income
Trading and others
Operating Profits
Provisions
NPA
Others
PBT
Tax
Tax Rate
RoA
Leverage (x)
RoE
FY09
1.80
1.33
3.13
2.15
68.7
0.74
1.41
0.98
1.79
0.47
1.45
0.55
0.49
0.06
0.89
0.31
34.8
0.58
20.0
11.7
FY10
2.81
1.37
4.19
2.34
55.8
0.92
1.41
1.85
1.76
0.38
2.24
0.54
0.42
0.13
1.69
0.58
34.3
1.11
17.5
19.5
FY11
3.40
1.55
4.95
2.49
50.3
0.94
1.55
2.46
1.76
0.21
2.67
0.50
0.40
0.10
2.17
0.75
34.4
1.43
13.5
19.3
FY12
3.30
1.77
5.07
2.60
51.3
0.94
1.66
2.47
1.96
0.19
2.66
0.35
0.28
0.07
2.31
0.76
32.7
1.55
12.4
19.2
FY13
3.41
1.89
5.31
2.68
50.6
1.01
1.67
2.62
2.08
0.19
2.81
0.40
0.34
0.07
2.41
0.79
32.7
1.62
11.0
17.8
FY14
3.61
2.01
5.61
2.73
48.6
1.01
1.72
2.89
2.36
0.35
3.24
0.58
0.39
0.19
2.65
0.90
33.8
1.76
10.0
17.5
FY15
3.44
2.24
5.68
2.89
50.8
0.99
1.90
2.80
2.56
0.32
3.12
0.39
0.34
0.05
2.73
0.92
33.8
1.80
10.5
19.0
FY16
3.59
2.23
5.82
2.92
50.1
0.98
1.93
2.90
2.62
0.39
3.29
0.53
0.40
0.14
2.76
0.94
34.1
1.82
9.1
16.6
FY17E
3.84
2.19
6.03
3.05
50.6
1.01
2.04
2.98
2.63
0.44
3.42
0.64
0.58
0.06
2.78
0.95
34.1
1.83
8.5
15.5
FY18E
3.81
2.12
5.93
2.94
49.5
0.97
1.96
3.00
2.48
0.36
3.36
0.55
0.49
0.06
2.81
0.95
34.0
1.85
9.2
17.0
FY19E
3.75
2.03
5.78
2.81
48.6
0.93
1.88
2.97
2.38
0.35
3.32
0.52
0.46
0.06
2.80
0.95
34.0
1.85
9.9
18.2
Source: MOSL, Company
Exhibit 8: DuPont Analysis: RoA remained healthy at ~1.9%
2QFY14 3QFY14 4QFY14 1QFY15 2QFY15 3QFY15 4QFY15 1QFY16 2QFY16 3QFY16 4QFY16 1QFY17 2QFY17
NII
3.70
3.67
3.70
3.61
3.65
3.58
3.54
3.51
3.68
3.73
3.78
3.80
3.90
Fee income
2.06
2.14
2.09
2.19
2.39
2.33
2.33
2.28
2.27
2.31
2.31
2.19
2.20
Core Income
5.77
5.81
5.80
5.81
6.04
5.92
5.87
5.79
5.95
6.04
6.09
5.99
6.10
Operating costs
2.80
2.83
2.77
2.96
3.08
3.06
2.96
2.93
2.93
3.03
3.07
3.07
3.07
- Emp Costs
1.07
1.03
0.99
0.99
1.05
1.06
1.02
0.97
1.01
1.04
1.00
1.00
1.00
- Other Expenses
1.73
1.79
1.79
1.97
2.03
2.00
1.94
1.96
1.92
1.99
2.07
2.07
2.06
Cost to Core Inc. Ratio
48.5
48.7
47.8
51.1
51.0
51.8
50.4
50.7
49.3
50.1
50.4
51.2
50.3
Core Operating Profit
2.97
2.98
3.02
2.84
2.96
2.85
2.91
2.85
3.02
3.02
3.02
2.92
3.04
Trading and others
0.14
0.27
0.38
0.54
0.21
0.37
0.34
0.45
0.37
0.36
0.41
0.53
0.39
Operating Profit
3.11
3.25
3.41
3.38
3.17
3.22
3.25
3.30
3.39
3.37
3.43
3.45
3.42
Provisions
0.47
0.63
0.57
0.50
0.32
0.41
0.41
0.44
0.53
0.56
0.64
0.65
0.57
Tax
0.89
0.88
0.96
0.98
0.97
0.95
0.95
0.98
0.97
0.96
0.95
0.96
0.97
ROAA
1.75
1.74
1.88
1.90
1.88
1.86
1.89
1.88
1.88
1.85
1.85
1.85
1.88
Leverage (x)
9.3
9.4
9.5
9.6
9.4
9.5
9.9
10.2
8.5
7.4
7.6
7.9
8.0
ROAE
16.2
16.3
17.9
18.2
17.7
17.6
18.8
19.3
16.0
13.6
14.2
14.7
15.0
Source: MOSL, Company
13 October 2016
7

IndusInd Bank
Story in charts
Exhibit 9: NIMs improve 3bp QoQ to 4.0% (%)
3.9
3.6
3.7
3.7
3.7
3.9
3.9
4.0
4.0
Exhibit 10: Traction in fee income continues
Fee Inc (INR b)
2.4
2.3
2.3
2.3
2.3
Fee Inc to avg. assets
2.3
2.3
2.2
7.8
2.2
8.3
5.4
5.6
6.1
6.4
6.7
7.3
7.7
Source: MOSL, Company
Exhibit 11: Deposit growth witnessed an uptick
Deposits (INR b)
YoY Gr (%)
31
39
Exhibit 12: Some one-offs in CA deposit growth
CASA Ratio
YoY CASA Gr (%)
24
23
23
22
22
25
25
Source: Company, MOSL
Exhibit 13: Above industry loan growth continues (%)
Loans (INR b)
31
22
22
25
23
29
YoY Gr (%)
29
30
26
Exhibit 14: Share of CFD remained stable QoQ
CFD (% of loans)
CCB (% of loans)
57
58
59
58
59
58
59
59
59
43
42
41
42
41
42
41
41
41
Source: MOSL, Company
13 October 2016
8

IndusInd Bank
Exhibit 15: Slippage ratio declined to 1.3%
5.0
4.0
3.0
2.0
1.0
0.0
Overall
CFD
C&IB
Exhibit 16: PCR ratio remained stable QoQ at 59%
GNPA (%)
NNPA (%)
PCR (%)
Source: MOSL, Company
Exhibit 17: Restructured loans ticked lower (OSRL %)
Exhibit 18: Credit cost remained stable sequentially
Credit Cost (annualized in bp)
68
53
41
52
64
70
70
63
63
Source: MOSL, Company
Exhibit 19: Strong Tier I capital ratio (%)
Exhibit 20: Branch expansion picked up post moderation in
1Q
854
905
1,000 1,004 1,035
685
727
801
811
Source: MOSL, Company
13 October 2016
9

IndusInd Bank
Exhibit 21: Quarterly Snapshot (INR b)
FY15
1Q
Profit and Loss
Net Interest Income
Other Income
Trading profits
Others (Ex non core)
Total Income
Operating Expenses
Employee
Others
Operating Profits
Provisions
PBT
Taxes
PAT
Asset Quality
GNPA
NNPA
GNPA (%)
NNPA (%)
PCR (Calculated, %)
Ratios (%)
Fees to Total Income
Tax Rate
CASA (Reported)
Loan/Deposit
RoA
RoE
Margins (%) - Reported
Yield on loans
Cost of deposits
Margins
Balance Sheet (INR b)
Loans
Investments
Deposits
CASA Deposits
of which Savings
Current
Borrowings
Total Assets
Risk Weighted Assets
8,007
6,059
899
5,161
14,066
6,574
2,203
4,371
7,492
1,104
6,388
2,177
4,211
6,544
1,956
1.1
0.3
70.1
36.7
34.1
33.3
91.8
1.9
19.0
13.5
8.2
3.7
587
213
639
213
106
107
142
904
741
2Q
8,331
5,940
490
5,450
14,271
7,024
2,393
4,631
7,247
732
6,515
2,213
4,302
6,545
1,950
1.1
0.3
70.2
38.2
34.0
33.9
90.8
1.9
18.2
13.3
8.0
3.6
599
199
660
224
114
110
133
923
778
3Q
8,614
6,490
885
5,605
15,104
7,366
2,556
4,810
7,738
980
6,758
2,286
4,471
6,727
2,015
1.1
0.3
70.0
37.1
33.8
34.1
92.0
1.9
18.3
13.0
7.8
3.7
638
213
694
236
122
115
168
1,000
847
4Q
9,251
6,991
899
6,092
16,243
7,737
2,654
5,084
8,505
1,074
7,431
2,478
4,953
5,629
2,105
0.8
0.3
62.6
37.5
33.3
34.1
92.8
1.9
19.8
12.8
7.7
3.7
688
229
741
253
129
124
206
1,091
889
1Q
9,807
7,616
1,254
6,362
17,423
8,196
2,723
5,473
9,227
1,233
7,994
2,744
5,250
5,701
2,248
0.8
0.3
60.6
36.5
34.3
34.7
93.0
1.9
20.4
12.7
7.6
3.7
722
236
777
269
140
129
214
1,144
906
2Q
10,943
7,835
1,102
6,733
18,778
8,713
3,007
5,706
10,065
1,581
8,484
2,884
5,600
6,021
2,408
0.8
0.3
60.0
35.9
34.0
34.7
96.8
1.9
16.7
12.4
7.4
3.9
783
268
808
281
150
130
211
1,233
1,016
FY16
3Q
11,734
8,390
1,131
7,259
20,124
9,514
3,267
6,247
10,610
1,771
8,839
3,029
5,810
6,811
2,733
0.8
0.3
59.9
36.1
34.3
35.0
95.1
1.9
14.1
12.1
7.2
3.9
822
282
864
302
161
141
203
1,282
1,064
4Q
12,682
9,128
1,386
7,742
21,810
10,298
3,364
6,934
11,512
2,137
9,375
3,172
6,204
7,768
3,218
0.9
0.4
58.6
35.5
33.8
35.2
95.1
1.9
14.6
12.0
7.1
3.9
884
312
930
327
172
155
222
1,401
1,163
1Q
13,564
9,730
1,911
7,819
23,294
10,956
3,569
7,387
12,338
2,305
10,033
3,419
6,614
8,606
3,555
0.9
0.4
58.7
33.6
34.1
34.4
92.1
1.9
15.1
12.1
6.9
4.0
937
287
1,018
350
191
160
172
1,458
1,216
FY17
2Q
14,603
9,704
1,449
8,256
24,307
11,491
3,758
7,733
12,817
2,139
10,678
3,635
7,043
8,990
3,692
0.9
0.4
58.9
34.0
34.0
36.5
88.1
1.9
15.4
11.9
6.6
4.0
989
325
1,123
410
206
205
151
1,538
1,274
(21)
(33)
3
6
13
10
17
8
28
(12)
6
5
(49)
(77)
12
26
22
39
46
37
57
(29)
25
25
Variation (%)
QoQ YoY
8
(0)
(24)
6
4
5
5
5
4
(7)
6
6
6
4
4
(1)
(1)
24
33
24
31
23
29
32
25
36
27
35
26
26
26
49
53
13
6
(108)
Source: MOSL, Company
13 October 2016
10

IndusInd Bank
Financials and valuations
Income Statement
Y/E March
Interest Income
Interest Expense
Net Interest Income
Change (%)
Non Interest Income
Net Income
Change (%)
Operating Expenses
Pre Provision Profits
Change (%)
Provisions (excl tax)
PBT
Tax
Tax Rate (%)
PAT
Change (%)
Equity Dividend (Incl tax)
Core PPP*
Change (%)
*Core PPP is (NII+Fee income-Opex)
Balance Sheet
Y/E March
Equity Share Capital
Reserves & Surplus
Net Worth
Of which Equity Networth
Deposits
Change (%)
of which CASA Dep
Change (%)
Borrowings
Other Liabilities & Prov.
Total Liabilities
Current Assets
Investments
Change (%)
Loans
Change (%)
Fixed Assets
Other Assets
Total Assets
Asset Quality
GNPA (INR m)
NNPA (INR m)
GNPA Ratio
NNPA Ratio
PCR (Excl Tech. write off)
E: MOSL Estimates
2012
53,592
36,549
17,042
23.8
10,118
27,160
29.9
13,430
13,730
26.9
1,804
11,927
3,900
32.7
8,026
39.0
1,196
12,680
29.9
2013
69,832
47,504
22,329
31.0
13,630
35,958
32.4
17,564
18,395
34.0
2,631
15,764
5,152
32.7
10,612
32.2
1,838
17,325
36.6
2014
82,535
53,628
28,907
29.5
18,905
47,812
33.0
21,853
25,960
41.1
4,676
21,283
7,203
33.8
14,080
32.7
2,154
23,327
34.6
2015
96,920
62,717
34,203
18.3
25,480
59,683
24.8
28,701
30,982
19.3
3,891
27,092
9,155
33.8
17,937
27.4
2,552
28,232
21.0
2016
115,807
70,641
45,166
32.1
32,970
78,135
30.9
36,721
41,414
33.7
6,722
34,693
11,828
34.1
22,865
27.5
3,522
36,541
29.4
2017E
141,397
81,085
60,312
33.5
41,186
101,498
29.9
47,855
53,643
29.5
9,987
43,656
14,887
34.1
28,769
25.8
4,022
46,769
28.0
(INR Million)
2018E
2019E
171,806
215,500
97,228
123,463
74,578
92,037
23.7
23.4
48,565
58,363
123,143
150,400
21.3
22.1
57,427
68,912
65,716
81,488
22.5
24.0
10,772
12,871
54,944
68,617
18,681
23,330
34.0
34.0
36,263
45,287
26.0
24.9
5,070
6,331
58,642
72,914
25.4
24.3
(INR Million)
2018E
2019E
5,950
5,950
226,746
265,600
232,696
271,549
232,696
271,549
1,595,886 2,074,652
30.0
30.0
576,531
733,137
30.0
27.2
242,906
261,387
103,912
124,890
2,175,399 2,732,478
151,657
206,184
449,486
539,383
20.0
20.0
1,426,116 1,811,167
27.0
27.0
12,298
12,733
135,842
163,011
2,175,399 2,732,478
2522%
2561%
(%)
13,683
15,383
2,192
3,331
1.0
0.8
0.2
0.2
84.0
78.3
2012
4,677
42,740
47,417
47,417
423,615
23.3
115,631
23.9
86,820
18,108
575,961
55,396
145,719
7.5
350,640
34.0
6,568
17,638
575,961
2013
5,229
71,074
76,303
76,303
541,167
27.7
158,674
37.2
94,596
21,000
733,065
68,487
196,542
34.9
443,206
26.4
7,561
17,269
733,065
2014
5,256
85,173
90,430
90,430
605,023
11.8
196,909
24.1
147,620
27,187
870,259
67,694
215,630
9.7
551,018
24.3
10,164
25,753
870,259
2015
5,295
101,151
106,445
106,445
741,344
22.5
252,996
28.5
206,181
63,904
1,117,874
107,791
228,783
6.1
687,882
24.8
11,576
81,841
1,117,874
2016
5,950
171,010
176,960
176,960
930,003
25.4
327,243
29.3
221,559
72,048
1,400,570
101,119
312,143
36.4
884,193
28.5
12,553
90,561
1,400,570
2017E
5,950
195,655
201,604
201,604
1,227,605
32.0
443,485
35.5
221,559
86,501
1,737,269
114,206
374,572
20.0
1,122,926
27.0
12,363
113,202
1,737,269
2404%
11,104
2,097
1.0
0.2
81.1
3,471
947
1.0
0.3
72.7
4,578
1,368
1.0
0.3
70.1
6,208
1,841
1.1
0.3
70.4
5,629
2,105
0.8
0.3
62.6
7,768
3,218
0.9
0.4
58.6
13 October 2016
11

IndusInd Bank
Financials and valuations
Ratios
Y/E March
Spreads Analysis (%)
Avg. Yield-Earning Assets
Avg. Yield on loans
Avg. Yield on Investments
Avg. Cost-Int. Bear. Liab.
Avg. Cost of Deposits
Interest Spread
Net Interest Margin
Profitability Ratios (%)
RoE
RoA
Int. Expense/Int.Income
Fee Income/Net Income
Non Int. Inc./Net Income
Efficiency Ratios (%)
Cost/Income*
Empl. Cost/Op. Exps.
Busi. per Empl. (INR m)
NP per Empl. (INR lac)
* ex treasury and RWO
Asset-Liability Profile (%)
Loans/Deposit Ratio
CASA Ratio
Investment/Deposit Ratio
G-Sec/Investment Ratio
CAR
Tier 1
Valuations
Book Value (INR)
Change (%)
Price-BV (x)
Adjusted BV (INR)
Price-ABV (x)
EPS (INR)
Change (%)
Price-Earnings (x)
Dividend Per Share (INR)
Dividend Yield (%)
E: MOSL Estimates
96.7
17.8
12.6
95.4
12.8
17.2
38.5
71.2
2.2
0.2
141.9
46.7
8.6
140.2
8.7
20.3
18.3
60.2
3.0
0.2
164.5
15.9
7.4
162.2
7.5
26.8
32.0
45.6
3.5
0.3
193.7
17.7
6.3
191.1
6.4
33.9
26.5
36.0
4.0
0.3
291.0
50.3
4.2
287.5
4.2
38.4
13.4
31.8
4.5
0.4
332.6
14.3
3.7
330.3
3.7
48.4
25.8
25.3
5.8
0.5
385.0
15.8
3.2
382.6
3.2
60.9
26.0
20.0
7.3
0.6
450.5
17.0
2.7
446.9
2.7
76.1
24.9
16.0
9.1
0.7
82.8
27.3
34.4
81.7
13.9
11.4
81.9
29.3
36.3
71.8
15.4
13.8
91.1
32.5
35.6
71.3
13.8
12.7
92.8
34.1
30.9
78.3
12.1
11.2
95.1
35.2
33.6
81.0
15.5
14.9
91.5
36.1
30.5
85.8
14.3
13.8
89.4
36.1
28.2
89.4
13.1
12.8
87.3
35.3
26.0
93.0
12.2
11.9
51.3
36.1
84.2
1.0
50.6
37.7
84.3
1.0
48.6
37.0
79.0
1.0
50.8
34.2
74.5
1.0
50.1
33.7
76.9
1.1
50.6
33.1
86.3
1.2
49.5
33.1
98.4
1.3
48.6
33.1
108.8
1.4
19.2
1.6
68.2
33.6
37.3
17.8
1.6
68.0
34.5
37.9
17.5
1.8
65.0
33.7
39.5
19.0
1.8
64.7
37.4
42.7
16.6
1.8
61.0
36.0
42.2
15.5
1.8
57.3
33.8
40.6
17.0
1.9
56.6
33.7
39.4
18.2
1.8
57.3
33.1
38.8
11.5
13.8
7.7
8.0
8.0
3.4
3.6
11.7
14.1
7.5
8.3
8.3
3.4
3.7
11.3
13.3
7.2
7.7
7.6
3.5
3.9
10.9
12.5
7.1
7.4
7.7
3.5
3.9
10.4
11.8
6.6
6.7
6.8
3.6
4.0
10.1
11.4
6.7
6.2
6.1
3.9
4.3
9.9
11.0
6.6
5.9
5.7
3.9
4.3
9.9
11.0
6.6
5.9
5.7
3.9
4.2
2012
2013
2014
2015
2016
2017E
2018E
2019E
13 October 2016
12

IndusInd Bank
Corporate profile
Company description
IndusInd Bank (IIB) is one of the ten new private
sector banks which were awarded license in 1994.
The bank has pan-India presence with1,004 branches
and 1,885 ATMs as on June 20, 2016. It also has one
representative office each in Dubai and London.
Current management team, led by Managing
Director Mr Romesh Sobti, took charge in February
2008 and has since been effecting structural and
operational changes to improve productivity and
efficiency, leading to strong improvement in core
operating performance.
Exhibit 2: Shareholding pattern (%)
Promoter
DII
FII
Others
Jun-16
14.9
11.8
54.3
19.0
Mar-16
14.9
11.4
54.2
19.5
Jun-15
15.0
9.4
50.8
24.8
Exhibit 1: Sensex rebased
Source: MOSL/Bloomberg
Exhibit 3: Top holders
Holder Name
Bridge India Fund
Franklin Templeton Investment Funds
Afrin Dia
Goldman Sachs Investments (Mauritius) I Ltd
Hinduja Group Limited
% Holding
3.5
1.6
1.5
1.4
1.3
Source: Capitaline
Note: FII Includes depository receipts
Source: Capitaline
Exhibit 4: Top management
Name
R Seshasayee
Romesh Sobti
Haresh Gajwani
Designation
Part Time Chairman
Managing Director & CEO
Company Secretary
Exhibit 5: Directors
Name
R Seshasayee
Romesh Sobti
Vijay Vaid*
Ashok Kini*
Name
Kanchan Chitale*
Yashodhan M Kale
Ranbir Singh Butola
T Anantha Narayanan
Source: Capitaline
*Independent
Exhibit 6: Auditors
Name
Bhandari & Associates
BSR & Co LLP
BSR & Co LLP
Type
Secretarial Audit
Independent
Statutory
Exhibit 7: MOSL forecast v/s consensus
EPS
(INR)
FY17
FY18
MOSL
forecast
48.4
60.9
Consensus
forecast
49.8
63.2
Variation
(%)
-3.0
-3.6
Source: Bloomberg
Source: Capitaline
13 October 2016
13

Disclosures
This document has been prepared by Motilal Oswal Securities Limited (hereinafter referred to as Most) to provide information about the company (ies) and/sector(s), if any, covered in the report and may be distributed
Bank
IndusInd
by it and/or
its affiliated company(ies). This report is for personal information of the selected recipient/s and does not construe to be any investment, legal or taxation advice to you. This research report does not constitute an offer, invitation or
inducement to invest in securities or other investments and Motilal Oswal Securities Limited (hereinafter referred as MOSt) is not soliciting any action based upon it. This report is not for public distribution and has been furnished to
you solely for your general information and should not be reproduced or redistributed to any other person in any form. This report does not constitute a personal recommendation or take into account the particular investment
objectives, financial situations, or needs of individual clients. Before acting on any advice or recommendation in this material, investors should consider whether it is suitable for their particular circumstances and, if necessary, seek
professional advice. The price and value of the investments referred to in this material and the income from them may go down as well as up, and investors may realize losses on any investments. Past performance is not a guide
for future performance, future returns are not guaranteed and a loss of original capital may occur.
MOSt and its affiliates are a full-service, integrated investment banking, investment management, brokerage and financing group. We and our affiliates have investment banking and other business relationships with a some
companies covered by our Research Department. Our research professionals may provide input into our investment banking and other business selection processes. Investors should assume that MOSt and/or its affiliates are
seeking or will seek investment banking or other business from the company or companies that are the subject of this material and that the research professionals who were involved in preparing this material may educate
investors on investments in such business . The research professionals responsible for the preparation of this document may interact with trading desk personnel, sales personnel and other parties for the purpose of gathering,
applying and interpreting information. Our research professionals are paid on twin parameters of performance & profitability of MOSt.
MOSt generally prohibits its analysts, persons reporting to analysts, and members of their households from maintaining a financial interest in the securities or derivatives of any companies that the analysts cover. Additionally,
MOSt generally prohibits its analysts and persons reporting to analysts from serving as an officer, director, or advisory board member of any companies that the analysts cover. Our salespeople, traders, and other professionals or
affiliates may provide oral or written market commentary or trading strategies to our clients that reflect opinions that are contrary to the opinions expressed herein, and our proprietary trading and investing businesses may make
investment decisions that are inconsistent with the recommendations expressed herein. In reviewing these materials, you should be aware that any or all of the foregoing among other things, may give rise to real or potential
conflicts of interest. MOSt and its affiliated company(ies), their directors and employees and their relatives may; (a) from time to time, have a long or short position in, act as principal in, and buy or sell the securities or derivatives
thereof of companies mentioned herein. (b) be engaged in any other transaction involving such securities and earn brokerage or other compensation or act as a market maker in the financial instruments of the company(ies)
discussed herein or act as an advisor or lender/borrower to such company(ies) or may have any other potential conflict of interests with respect to any recommendation and other related information and opinions.; however the
same shall have no bearing whatsoever on the specific recommendations made by the analyst(s), as the recommendations made by the analyst(s) are completely independent of the views of the affiliates of MOSt even though
there might exist an inherent conflict of interest in some of the stocks mentioned in the research report
Reports based on technical and derivative analysis center on studying charts company's price movement, outstanding positions and trading volume, as opposed to focusing on a company's fundamentals and, as such, may not
match with a report on a company's fundamental analysis. In addition MOST has different business segments / Divisions with independent research separated by Chinese walls catering to different set of customers having various
objectives, risk profiles, investment horizon, etc, and therefore may at times have different contrary views on stocks sectors and markets.
Unauthorized disclosure, use, dissemination or copying (either whole or partial) of this information, is prohibited. The person accessing this information specifically agrees to exempt MOSt or any of its affiliates or employees from,
any and all responsibility/liability arising from such misuse and agrees not to hold MOSt or any of its affiliates or employees responsible for any such misuse and further agrees to hold MOSt or any of its affiliates or employees free
and harmless from all losses, costs, damages, expenses that may be suffered by the person accessing this information due to any errors and delays. The information contained herein is based on publicly available data or other
sources believed to be reliable. Any statements contained in this report attributed to a third party represent MOSt’s interpretation of the data, information and/or opinions provided by that third party either publicly or through a
subscription service, and such use and interpretation have not been reviewed by the third party. This Report is not intended to be a complete statement or summary of the securities, markets or developments referred to in the
document. While we would endeavor to update the information herein on reasonable basis, MOSt and/or its affiliates are under no obligation to update the information. Also there may be regulatory, compliance, or other reasons
that may prevent MOSt and/or its affiliates from doing so. MOSt or any of its affiliates or employees shall not be in any way responsible and liable for any loss or damage that may arise to any person from any inadvertent error in
the information contained in this report. MOSt or any of its affiliates or employees do not provide, at any time, any express or implied warranty of any kind, regarding any matter pertaining to this report, including without limitation
the implied warranties of merchantability, fitness for a particular purpose, and non-infringement. The recipients of this report should rely on their own investigations.
This report is intended for distribution to institutional investors. Recipients who are not institutional investors should seek advice of their independent financial advisor prior to taking any investment decision based on this report or
for any necessary explanation of its contents.
Most and it’s associates may have managed or co-managed public offering of securities, may have received compensation for investment banking or merchant banking or brokerage services, may have received any compensation
for products or services other than investment banking or merchant banking or brokerage services from the subject company in the past 12 months.
Most and it’s associates have not received any compensation or other benefits from the subject company or third party in connection with the research report.
Subject Company may have been a client of Most or its associates during twelve months preceding the date of distribution of the research report
MOSt and/or its affiliates and/or employees may have interests/positions, financial or otherwise of over 1 % at the end of the month immediately preceding the date of publication of the research in the securities mentioned in this
report. To enhance transparency, MOSt has incorporated a Disclosure of Interest Statement in this document. This should, however, not be treated as endorsement of the views expressed in the report.
Motilal Oswal Securities Limited is registered as a Research Analyst under SEBI (Research Analyst) Regulations, 2014. SEBI Reg. No. INH000000412
Pending Regulatory inspections against Motilal Oswal Securities Limited:
SEBI pursuant to a complaint from client Shri C.R. Mohanraj alleging unauthorized trading, issued a letter dated 29th April 2014 to MOSL notifying appointment of an Adjudicating Officer as per SEBI regulations to hold inquiry and
adjudge violation of SEBI Regulations; MOSL replied to the Show Cause Notice whereby SEBI granted us an opportunity of Inspection of Documents. Since all the documents requested by us were not covered we have requested
to SEBI vide our letter dated June 23, 2015 to provide pending list of documents for inspection.
List of associate companies of Motilal Oswal Securities Limited -
Click here to access detailed report
Analyst Certification
The views expressed in this research report accurately reflect the personal views of the analyst(s) about the subject securities or issues, and no part of the compensation of the research analyst(s) was, is, or will be directly or
indirectly related to the specific recommendations and views expressed by research analyst(s) in this report. The research analysts, strategists, or research associates principally responsible for preparation of MOSt research
receive compensation based upon various factors, including quality of research, investor client feedback, stock picking, competitive factors and firm revenues
Disclosure of Interest Statement
Analyst ownership of the stock
Served as an officer, director or employee -
INDUSIND BANK
No
No
A graph of daily closing prices of securities is available at www.nseindia.com and http://economictimes.indiatimes.com/markets/stocks/stock-quotes
Regional Disclosures (outside India)
This report is not directed or intended for distribution to or use by any person or entity resident in a state, country or any jurisdiction, where such distribution, publication, availability or use would be contrary to law, regulation or
which would subject MOSt & its group companies to registration or licensing requirements within such jurisdictions.
For Hong Kong:
This report is distributed in Hong Kong by Motilal Oswal capital Markets (Hong Kong) Private Limited, a licensed corporation (CE AYY-301) licensed and regulated by the Hong Kong Securities and Futures
Commission (SFC) pursuant to the Securities and Futures Ordinance (Chapter 571 of the Laws of Hong Kong) “SFO”. As per SEBI (Research Analyst Regulations) 2014 Motilal Oswal Securities (SEBI Reg No. INH000000412)
has an agreement with Motilal Oswal capital Markets (Hong Kong) Private Limited for distribution of research report in Kong Kong. This report is intended for distribution only to “Professional Investors” as defined in Part I of
Schedule 1 to SFO. Any investment or investment activity to which this document relates is only available to professional investor and will be engaged only with professional investors.” Nothing here is an offer or solicitation of
these securities, products and services in any jurisdiction where their offer or sale is not qualified or exempt from registration. The Indian Analyst(s) who compile this report is/are not located in Hong Kong & are not conducting
Research Analysis in Hong Kong.
For U.S.
Motilal Oswal Securities Limited (MOSL) is not a registered broker - dealer under the U.S. Securities Exchange Act of 1934, as amended (the"1934 act") and under applicable state laws in the United States. In addition MOSL is
not a registered investment adviser under the U.S. Investment Advisers Act of 1940, as amended (the "Advisers Act" and together with the 1934 Act, the "Acts), and under applicable state laws in the United States. Accordingly, in
the absence of specific exemption under the Acts, any brokerage and investment services provided by MOSL, including the products and services described herein are not available to or intended for U.S. persons.
This report is intended for distribution only to "Major Institutional Investors" as defined by Rule 15a-6(b)(4) of the Exchange Act and interpretations thereof by SEC (henceforth referred to as "major institutional investors"). This
document must not be acted on or relied on by persons who are not major institutional investors. Any investment or investment activity to which this document relates is only available to major institutional investors and will be
engaged in only with major institutional investors. In reliance on the exemption from registration provided by Rule 15a-6 of the U.S. Securities Exchange Act of 1934, as amended (the "Exchange Act") and interpretations thereof by
the U.S. Securities and Exchange Commission ("SEC") in order to conduct business with Institutional Investors based in the U.S., MOSL has entered into a chaperoning agreement with a U.S. registered broker-dealer, Motilal
Oswal Securities International Private Limited. ("MOSIPL"). Any business interaction pursuant to this report will have to be executed within the provisions of this chaperoning agreement.
The Research Analysts contributing to the report may not be registered /qualified as research analyst with FINRA. Such research analyst may not be associated persons of the U.S. registered broker-dealer, MOSIPL, and
therefore, may not be subject to NASD rule 2711 and NYSE Rule 472 restrictions on communication with a subject company, public appearances and trading securities held by a research analyst account.
For Singapore
Motilal Oswal Capital Markets Singapore Pte Limited is acting as an exempt financial advisor under section 23(1)(f) of the Financial Advisers Act(FAA) read with regulation 17(1)(d) of the Financial Advisors Regulations and is a
subsidiary of Motilal Oswal Securities Limited in India. This research is distributed in Singapore by Motilal Oswal Capital Markets Singapore Pte Limited and it is only directed in Singapore to accredited investors, as defined in the
Financial Advisers Regulations and the Securities and Futures Act (Chapter 289), as amended from time to time.
In respect of any matter arising from or in connection with the research you could contact the following representatives of Motilal Oswal Capital Markets Singapore Pte Limited:
Varun Kumar
Varun.kumar@motilaloswal.com
Contact : (+65) 68189232
Office Address:21 (Suite 31),16 Collyer Quay,Singapore 04931
Kadambari Balachandran
kadambari.balachandran@motilaloswal.com
(+65) 68189233 / 65249115
13 October 2016
Motilal Oswal Tower, Level 9, Sayani Road, Prabhadevi, Mumbai 400 025
Phone: +91 22 3982 5500 E-mail: reports@motilaloswal.com
Motilal Oswal Securities Ltd
14