Zee Entertainment
BSE SENSEX
28,091
Bloomberg
Equity Shares (m)
M.Cap.(INRb)/(USDb)
52-Week Range (INR)
1, 6, 12 Rel. Per (%)
Avg Val, INRm
Free float (%)
S&P CNX
8,691
Z IN
960.5
494.8 / 7.3
589 / 350
0/19/17
927.3
56.93
25 October 2016
2QFY17 Results Update | Sector: Media
CMP: INR475
TP: INR610 (+28%)
Buy
Financials & Valuations (INR b)
Y/E MARCH
2016 2017E 2018E
Net Sales
58.3
68.0
76.7
EBITDA
15.0
19.5
25.5
NP
10.2
14.2
18.8
EPS (INR)
10.6
14.8
19.5
EPS Gr. (%)
3.9
39.6
32.2
EPS ex-&TV, INR 11.8
15.5
19.3
RoE (%)
27.3
31.1
32.9
RoCE (%)
17.8
21.9
25.2
Div. Payout (%) 21.3
15.2
12.8
Valuations
P/E (x)
48.7
34.9
26.4
P/E ex-&TV (x)
43.5
33.2
26.7
EV/EBITDA (x)
33.2
24.1
18.0
Div. Yield (%)
0.4
0.4
0.5
Estimate change
TP change
Rating change
Strong operational performance continues; EBITDA exceeds estimates
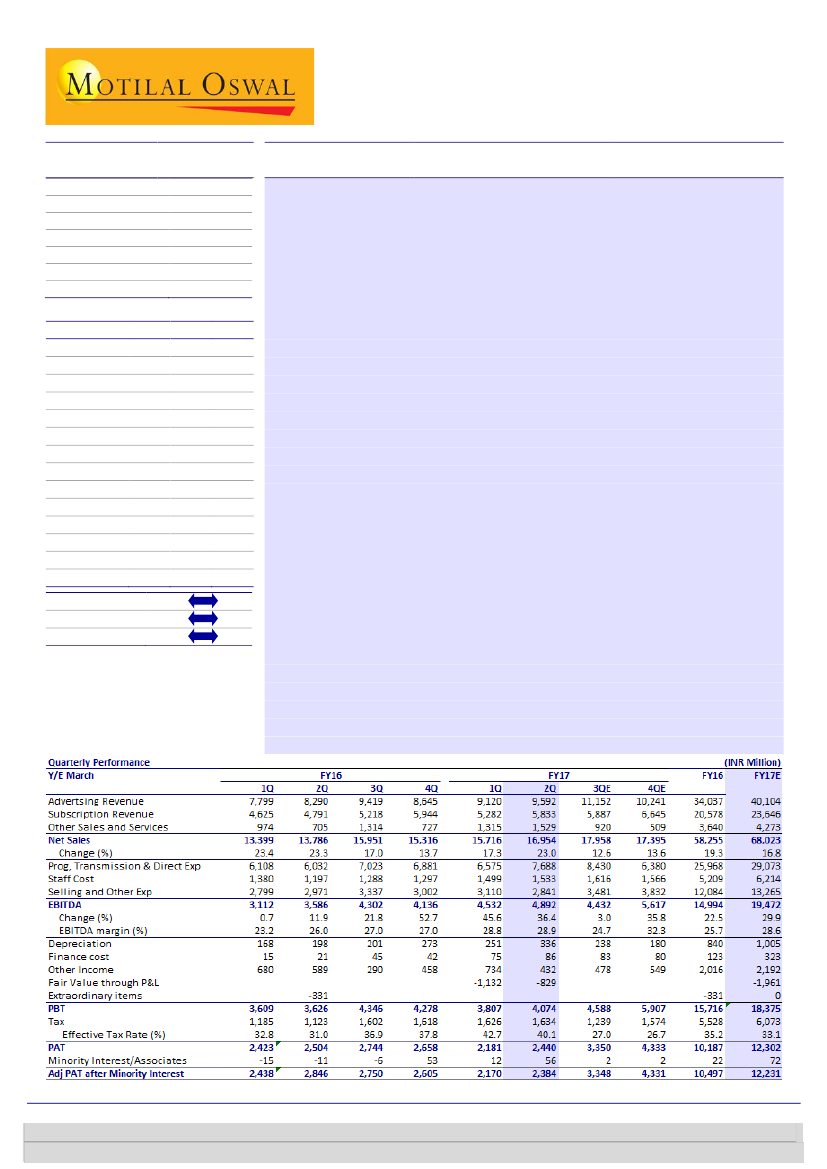
2QFY17 operational performance above expectations:
Zee Entertainment’s
(ZEE) 2QFY17 EBITDA grew 36% YoY to INR4.89b (6% above est.), led by higher-
than-expected subscription and other sales & services revenues; sports losses
too were contained. Reported PAT declined 16% YoY to INR2.38b (est. of
INR3.32b), primarily led by losses booked in P&L on account of fair value
accounting of ZEE’s preference shares and lower-than-expected other income.
Adj. PAT grew 13% YoY to INR3.21b (3% below est.).
Strong ad growth, albeit lower-than-expected; subscription surprises
positively:
Revenue grew 23% YoY to INR16.95b (2.6% above our estimate of
INR16.52b). Ad growth remained strong at 16% (INR9.59b), albeit 2% lower than
our estimate of INR9.78b. Subscription revenue surprised positively with 22%
YoY increase to INR5.83b (7.5% above est.), more than offsetting ad miss.
Domestic subscription grew 25% YoY to INR4.67b (8% higher than our estimate
of INR4.32b), which was largely a function of early closure of content deals this
fiscal v/s previous years, further aided by catch-up revenues for 1Q. International
subscription grew 11% YoY to INR1.16b.
Movie biz and sports syndication revenues offer further boost:
Other sales &
services (includes movie biz and sports syndication) revenues more than doubled
YoY to INR1.53b (est. of INR1.31b), largely led by strong box-office performance
of ZEE co-produced movie
Rustom
and cricket-related syndication revenues.
Sports losses contained; ex-sports EBITDA up 300bp QoQ:
Sports losses stood at
INR168m (v/s est. EBITDA losses of INR199m). We cut our sports loss estimates
for FY17 to ~INR120m (v/s INR180m earlier), given that 3Q is not cricket-heavy.
Non-sports revenue grew 19% YoY to INR14.83b (v/s est. of INR14.4b), while
margins expanded 300bp QoQ/563bp YoY to 34.1% (est. of 33.5%)
Valuation and view:
Ad growth is expected to remain healthy, despite the
expected moderation in FMCG as viewership share gains in regional portfolio and
new channels could aid in cushioning the impact. Telecom ad spend too is expected
to pick up in 2H. We largely maintain our FY17/FY18 earnings estimates. We
maintain
Buy
with a TP of INR610 based on 31.6x FY18E EPS (ex-&TV) plus
INR18/sh toward &TV DCF value less INR18/sh toward pref. share liability.
Investors are advised to refer through important disclosures made at the last page of the Research Report.
Motilal Oswal research is available on www.motilaloswal.com/Institutional-Equities, Bloomberg, Thomson Reuters, Factset and S&P Capital.
Jay Gandhi
(Jay.Gandhi@MotilalOswal.com); +91 22 6129 1546
Aliasgar Shakir
(Aliasgar.Shakir@MotilalOswal.com); +91 22 30102415

Zee Entertainment
2QFY17 Earnings Call Highlights
Advertisement Outlook:
FMCG segment which accounts for ~55-60% of Zee’s ad
revenues is expected to moderate ad spends in 2H which could impact industry
growth in the coming quarters. E-Commerce spends albeit, a small base are also
tapering off.
Domestic subscription:
The strong 25%-domestic subscription growth this
quarter was largely a function of early closure of content deals this year vs
previous years and some catch-up revenues from 1Q. Unlike previous years, In
FY17, domestic subscription skew would be higher in 1HFY17 viz-a-viz 2HFY17.
Domestic subscription guidance of mid-teens growth remains unaltered for
FY17.
Programming strategy and costs:
Zee intends to rev up its original programming
hours (OPH) for its flagship Zee TV to ~30 hours/week (currently: 26
hours/week) and &TV to 24 hours/week (currently 21 hours/week) by end FY17.
A commensurate viewership gain could help in better ad monetization and
partially mitigating any moderation in FMCG ad spends. Telecom ad spends are
expected to pick up in 2H.
Regional portfolio performing well:
Zee’s regional portfolio is performing well.
It has managed to gain significant viewership share in the Tamil market. The
success was attributed to improved distribution of Zee Tamil and success of
several shows. The company has already seen a rate hike courtesy its improved
performance in the biggest regional market (Tamil) and is expected to see
another round of hikes by the end of the fiscal. In the Kannada market; Ex-
Movie genre, Zee Telugu is now evenly matched with Gemini.
On recent content-carriage regulations:
While the implementation of the new
uniform content regulation remains uncertain; management suggested that in
the event the draft regulations are implemented in its current form;
broadcasters are likely to use the carriage fees saved to directly market their
offering to consumers instead of pushing it through the distribution platforms
(DPOs)
Re-organization of verticals:
Zee has identified and re-organized the structure
of the company into 5 verticals 1. Broadcasting, 2. International 3. Movies, 4.
Music, 5. Live Events
New channel launches:
Zee launched 3 new channels in the domestic market –
Zee Anmol Cinema, Zee Yuva and Zee Cinemalu and 2 international channels Zee
One and Zee Mundo.
&TV:
&TV’s 3 year break-even guidance maintained.
25 October 2016
2

Zee Entertainment
Ad revenue up 16% YoY; 2% below estimates
Ad revenue growth grew 16% YoY. (estimated: 16%)
Management expects a slight moderation in FMCG ad spends (55-60% of
industry ad rev) in 2H. However, is confident that viewership share gains within
the regional portfolio and new channels would aid in cushioning the impact.
Telecom ad spends too are expected to pick up in 2H.
Exhibit 1: Ad revenue and YoY growth (INR b, %)
33.7
28.8
15.5
5.3
5.1
4.8
5.3
18.5
10.5
5.8
6.8
5.8
6.2
21.5
17.4
7.3
6.3
8.5
7.4 6.7
15.0
7.8
8.3
9.4
8.6
34.3
25.4
32.426.8
29.1
16.9
15.7
9.1
9.6
Source: Company, MOSL
Domestic and international subscription performance beats estimates
2QFY17 domestic subscription revenue beat estimates and grew 25% YoY to
INR4.67b.
International subscription revenue grew 11% YoY to INR1.16b (vs est: INR1.11b).
We expect total subscription revenue to grow 15% YoY and domestic
subscription revenue to grow 16% YoY in FY17.
Exhibit 2: Subscription revenue trend (INR m)
International
Domestic
Source: Company, MOSL
Core EBITDA margin improves 300bp QoQ; Sports losses lower than
expected
Core EBITDA margin (excluding sports business) improved 300bps QoQ/563bp
YoY to 34.1% (est: 33.5%)
Sports revenue stood at INR2.12b (up 25% QoQ) while operating costs
amounted to INR2.29b (up 50% QoQ).
25 October 2016
3

Zee Entertainment
Exhibit 3: Trend in EBITDA and margins ex-sports (INR b)
EBITDA (ex sports)
37
36
39
41
37 39 37 35 37 34
31
34
32 33 35
30
35
EBITDA margin (ex sports) (%)
40
29 31
35 34
21
32 32 31 34
30
26 28
Exhibit 4: Sports business EBITDA (INR m)
Source: Company, MOSL
Valuation and View
ZEE continues to lead the industry in advertising growth. Strong performance of
its recently launched &TV has strengthened Zee’s presence in this core segment,
driving market share gains.
Zee also has a strong subscription income base and would further benefit from
mandatory digitization. While domestic subscription growth is expected to
remain resilient, significant acceleration is likely only from FY17 post phase III
digitization.
We largely maintain our FY17/FY18 earnings estimates and expect 36% EPS
CAGR over FY16-18
Maintain our
Buy
rating with a target price of INR610 per share (unchanged)
based on 31.6x FY18 ex-&TVEPS plus INR18/sh toward &TV DCF value less
INR18/sh toward pref. share liability
Exhibit 6: ZEE: Relative PE vs Sensex
Exhibit 5: ZEE: PE band
45
35
25
15
5
9.9
24.4
24.1
PE (x)
Median(x)
Peak(x)
Min(x)
Avg(x)
36.6
30.1
150
100
50
0
-50
Zee Ent. PE Relative to Sensex PE (%)
LPA (%)
83.4
41.6
Source: MOSL, Company
25 October 2016
4

Zee Entertainment
Exhibit 7: Quarterly performance (INR m)
Advertising revenue
Subscription revenue
Other sales and services
Total revenue
Total operating expenses
EBITDA
EBITDA margin (%)
Depreciation
Finance Cost
Other income
Fair Value through P&L
Proforma PBT
Exceptional item
Reported PBT
Tax
Effective Tax Rate (%)
PAT
Associates/Minority Interest
Adjusted PAT after minorities
Advertisement revenue (INR m)
Ad revenue
Domestic
International
Subscription revenue (INR m)
Domestic
International
Total subscription revenue
Operating costs (INR m)
Prog, Transmission & Direct Exp
Staff Cost
Selling and Other Exp
Total operating costs
Sports business (INR m)
Revenue
Operating cost
EBITDA
EBITDA margin (%)
Non-sports business (INR m)
Revenue
Operating cost
EBITDA
EBITDA margin (%)
2QFY16
8,290
4,791
705
13,786
10,200
3,586
26.0
198
21
589
3,957
-331
3,626
1,123
31.0
2,503
-11
2,845
1QFY17
9,120
5,282
1,315
15,716
11,185
4,532
28.8
251
75
734
-1,132
3,807
0
3,807
1,626
42.7
2,181
12
2,170
2QFY17
9,592
5,833
1,529
16,954
12,062
4,892
28.9
336
86
432
4,903
0
4,903
1,634
33.3
3,269
56
3,213
YoY%
16
22
117
23
18
36
284bp
70
315
-27
24
NA
35
46
236
31
13
QoQ%
5.2
10.4
16.3
7.9
7.8
8.0
2bp
33.8
14.0
-41.1
-100.0
28.8
NA
28.8
0.5
-937
49.8
48.1
2QFY17E
9,782
5,427
1,313
16,521
11,903
4,618
28.0
254
75
613
4,902
0
4,902
1,576
32.2
3,326
5
3,321
v/s est (%)
-1.9
7.5
16.5
2.6
1.3
5.9
90bp
32.4
14.0
-29.4
0.0
NA
0.0
3.7
118bps
-1.7
-3.3
8290
7555
735
3,752
1,039
4,791
6,032
1,197
2,971
10,200
1,278
1,256
22
2
12,508
8,944
3,564
28.5
9120
8000
1120
4,179
1,103
5,282
6,575
1,499
3,110
11,185
1,700
1,529
171
10
14,016
9,656
4,361
31.1
9592
8800
792
4,675
1,158
5,833
7,688
1,533
2,841
12,062
2,125
2,293
-168
-8
14,829
9,769
5,060
34.1
16
16.5
25
11
22
27
28
-4
18
66
83
-864
-963bp
18.6
9.2
42.0
563bp
5.2
10.0
11.9
5.0
10.4
16.9
2.2
-8.6
7.8
25.0
50.0
-198.2
-1796bp
5.8
1.2
16.0
301bp
9,782
-1.9
4,315
1,112
5,427
7,167
1,470
3,266
11,903
2,125
2,324
-199
-9
8.3
4.2
7.5
7.3
4.2
-13.0
1.3
0.0
-1.3
-15.6
146bp
14,396
3.0
9,579
2.0
4,817
5.0
33.5
66bp
Source: Company, MOSL
25 October 2016
5

Zee Entertainment
Exhibit 8: Summary of estimate change (INR b)
INR b
Ad revenue
Old
Actual/New
Change (%)
Subcription revenue
Old
New
Change (%)
Total revenue
Old
New
Change (%)
EBITDA
Old
New
Change (%)
EBITDA margin (%)
Old
New
Change (bp)
PAT
Old
New
Change (%)
EPS (INR)
Old
New
Change (%)
Adj EPS* (INR)
Old
New
Change (%)
FY17E
40.2
40.1
-0.3
23.6
23.6
0.2
68.1
68.0
-0.1
19.4
19.5
0.2
28.6
28.6
6
12.87
12.23
-5.0
13.4
12.7
-5.0
14.6
14.8
1.3
FY18E
45.0
44.9
-0.2
27.1
27.1
0.2
76.8
76.7
0.0
25.5
25.5
0.1
33.2
33.3
4
18.89
18.77
-0.7
19.7
19.5
-0.7
19.7
19.5
-0.7
Source: Company, MOSL
25 October 2016
6

Zee Entertainment
Exhibit 9: Zee Entertainment: A Snapshot (INR)
INR b
FY08
FY09
FY10
Advertisement Revenue
9.3
10.6
10.7
YoY (%)
14
1
-Advertisement Revenue (ex-&TV)
9.3
10.6
10.7
YoY (%)
1
-Advertisement Revenue (ex-&TV and
Sports)
9.6
YoY (%)
Subscription Revenue
7.4
9.0
9.8
YoY (%)
22
9
- Domestic
3.5
4.5
5.7
YoY (%)
29
25
- International
3.9
4.5
4.2
YoY (%)
15
-8
Other Sales & Sevices
1.6
2.1
1.5
YoY (%)
33
-32
Total Revenue
18.4
21.8
22.0
YoY (%)
19
1
Operating expenses
12.9
16.3
15.9
YoY (%)
26
-3
EBITDA
5.4
5.5
6.1
YoY (%)
1
11
EBITDA margin (%)
29.5
25.2
27.7
Revenue mix (%)
Ad and broadcast revenue
51
49
49
Subscription revenue
41
42
45
-Domestic
19
21
26
- International
21
21
19
Other sales and services
9
10
7
Sports/Non-sports break-up
Revenue
18.4
21.8
22.0
-Sports
3.9
3.2
-Non-sports (incl &TV)
17.9
18.8
-&TV
-Non-sports (excl &TV)
EBITDA
5.4
5.5
6.1
-Sports
0.4
-0.6
-Non-sports (incl &TV)
5.1
6.7
-&TV
-Non-sports (excl &TV)
5.1
6.7
EBITDA margin (%)
29.5
25.2
27.7
-Sports
10.0
-18.3
-Non-sports (incl &TV)
28.5
35.4
-Non-sports (excl &TV)
28.5
35.4
* Includes merger of Regional General Entertainment Channels
FY11 *
17.1
60
17.1
60
15.5
62
11.3
15
7.2
27
4.1
-2
1.1
-28
29.4
34
21.8
38
7.6
24
25.7
58
38
24
14
4
29.4
4.4
25.0
FY12
15.8
-7
15.8
-7
14.5
-7
13.2
17
9.2
28
4.0
-2
1.3
25
30.4
3
23.0
5
7.4
-2
24.3
52
44
30
13
4
30.4
3.9
26.5
FY13
19.6
24
19.6
24
17.9
24
16.2
23
11.6
26
4.6
14
1.1
-15
37.0
22
27.5
19
9.5
29
25.8
53
44
31
12
3
37.0
5.0
32.0
FY14
23.8
21
23.8
21
21.5
20
18.0
11
13.2
13
4.8
6
2.4
113
44.2
20
32.2
17
12.0
26
27.2
54
41
30
11
5
44.2
6.6
37.6
FY15
26.6
12
26.4
11
24.2
13
17.9
0
13.9
6
4.0
-17
4.3
80
48.8
10
36.3
13
12.5
4
25.7
54
37
29
8
9
48.8
6.3
42.5
0.2
42.4
12.5
-0.3
12.8
-0.9
13.7
25.7
-4.2
30.1
32.3
FY16
34.0
28
31.4
19
29.2
21
20.6
15
16.3
17
4.3
7
3.6
-15
58.3
19
43.3
19
15.0
20
25.7
58
35
28
7
6
FY17E
40.1
18
36.2
15
34.2
17
23.6
15
18.9
16
4.7
11
4.3
17
68.0
17
48.6
12
19.5
30
28.6
59
35
28
7
6
FY18E
44.9
12
39.4
9
39.4
15
27.1
15
21.9
16
5.2
10
4.7
10
76.7
13
51.2
5
25.5
31
33.3
58
35
29
7
6
7.6
-2.1
9.6
9.6
25.7
-47.1
38.6
38.6
7.4
-1.5
8.9
8.9
24.3
-37.6
33.5
33.5
9.5
-0.9
10.4
10.4
25.8
-17.5
32.5
32.5
12.0
-1.0
13.0
13.0
27.2
-14.8
34.6
34.6
58.3
68.0
76.7
6.3
5.6
0.0
51.9
62.4
76.7
2.6
4.4
6.7
49.4
58.0
70.0
15.0
19.5
25.5
-0.3
-0.1
0.0
15.3
19.6
25.5
-1.8
-1.1
0.3
17.2
20.7
25.2
25.7
28.6
33.3
-5.5
-2.2
29.5
31.4
33.3
34.8
35.6
36.0
Source: Company, MOSL
25 October 2016
7

Zee Entertainment
Financials and Valuations
Income Statement
Y/E March
Advertisement Revenues
Subscription Revenues
Other Sales & Sevices
Net Sales
Change (%)
Total Income
Total Expenses
EBITDA
Change (%)
% of Net Sales
Depreciation
EBIT
Other Income
Interest & Finance Charges
Extraordinay Expense
PBT
Tax
Effective Rate (%)
PAT
Minority Interest
Adj. PAT
Change (%)
2012
15,841
13,245
1,320
30,406
3.4
30,406
23,010
7,396
-2.3
24.3
323
7,073
1,384
50
0
8,407
2,500
29.7
5,907
-15
5,892
-20.5
2013
19,639
16,234
1,123
36,997
21.7
36,997
27,452
9,545
29.0
25.8
399
9,146
1,461
86
0
10,521
3,337
31.7
7,184
14
7,198
22.2
2014
23,800
18,022
2,395
44,217
19.5
44,217
32,175
12,042
26.2
27.2
501
11,541
1,807
158
0
13,191
4,291
32.5
8,900
21
8,921
23.9
2015
26,603
17,944
4,299
48,846
10.5
48,846
36,299
12,547
4.2
25.7
673
11,874
2,278
103
0
14,049
4,284
30.5
9,765
20
9,785
9.7
2016
34,037
20,578
3,640
58,255
19.3
58,255
43,261
14,994
19.5
25.7
840
14,153
2,016
123
-331
15,716
5,528
35.2
10,187
-22
10,166
3.9
(INR Million)
2017E
40,104
23,646
4,273
68,023
16.8
68,023
48,551
19,472
29.9
28.6
1,005
18,467
2,192
323
0
20,336
6,073
29.9
14,263
-72
14,192
39.6
2018E
44,871
27,150
4,700
76,721
12.8
76,721
51,182
25,538
31.2
33.3
1,080
24,458
3,961
303
0
28,116
9,278
33.0
18,838
-72
18,766
32.2
Balance Sheet
Y/E March
Share Capital
Reserves
Net Worth
Preference capital
Minority Interest
Loans
Other non-current liabilities
Capital Employed
Net Fixed Assets
Goodwill
Capital WIP
Investments
Deferred tax assets (net)
Other non-current assets
Curr. Assets, Loans&Adv.
Program Films
Sundry Debtors
Cash & Bank Balances
Loans & Advances
Other Current assets
Current Liab. & Prov.
Sundry Creditors
Other Current Liabilities
Provisions
Net Current Assets
Appl.of Funds
2012
959
33,349
34,308
0
14
21
0
34,343
2,305
6,894
201
675
337
314
32,428
7,339
8,660
11,100
4,975
354
8,820
3,872
3,015
1,933
23,608
34,343
2013
954
38,161
39,115
0
33
28
174
39,350
2,779
7,127
69
651
288
329
39,500
8,745
9,890
13,100
7,430
335
11,404
5,172
3,445
2,787
28,096
39,350
2014
960
26,247
27,207
20,170
61
29
324
47,791
3,108
7,625
997
2,941
298
361
44,987
11,736
10,281
15,300
6,788
882
12,538
5,050
3,842
3,646
32,449
47,791
2015
960
34,449
35,410
20,170
4
22
288
55,894
3,490
7,887
878
1,464
531
378
55,431
11,878
10,692
20,480
11,053
1,328
14,256
4,204
4,980
5,072
41,153
55,894
2016
960
40,549
41,509
20,170
85
9
304
62,077
4,312
9,150
878
3,048
555.8
594.4
59,783
13,160
13,245
17,123
14,722
1,532
16,229
5,194
6,355
4,679
43,554
62,077
(INR Million)
2017E
960
48,713
49,673
20,170
85
19
304
70,251
3,932
9,150
878
3,048
555.8
594.4
91,507
14,415
14,907
45,466
15,049
1,670
16,213
5,228
6,306
4,679
75,293
70,251
2018E
960
63,122
64,083
16,136
85
19
304
80,626
3,529
9,150
878
3,048
555.8
594.4
102,814
14,802
16,813
52,343
16,973
1,883
16,742
5,468
6,595
4,679
86,072
80,626
25 October 2016
8

Zee Entertainment
Financials and Valuations
Ratios
Y/E March
Basic (INR)
EPS
Cash EPS
EPS (excl '&TV' loss)
Book Value per Share
DPS
Payout (Incl. Div. Tax) %
Valuation
P/E
P/E (excl '&TV' loss)
EV/EBITDA
EV/Sales
Price/Book Value
Dividend Yield (%)
Profitability Ratios (%)
RoE
RoCE
RoIC
Turnover Ratios
Debtors (No. of Days)
Inventory (No. of Days)
Creditors (No. of Days)
Asset Turnover (x)
Leverage Ratio
Debt/Equity (x)
2012
6.1
6.4
6.1
35.4
1.5
24.4
2013
7.5
7.9
7.5
40.9
2.0
26.5
2014
9.3
9.8
9.3
28.5
2.0
21.5
2015
10.2
10.9
10.8
36.9
2.3
22.1
2016
10.6
11.8
11.8
43.3
2.3
21.3
2017E
14.8
15.8
15.5
51.8
2.3
15.2
2018E
19.5
20.7
19.3
66.8
2.5
12.8
83.8
80.3
40.4
9.8
9.3
0.5
68.3
64.9
30.9
8.0
8.1
0.6
50.6
47.6
39.4
10.1
14.0
0.4
48.7
43.5
33.2
8.5
11.9
0.4
34.9
33.2
24.1
6.9
9.9
0.4
26.4
26.7
18.0
6.0
7.7
0.5
18.0
18.2
24.7
104
162
78
0.9
19.6
19.7
26.1
98
169
69
1.0
26.9
20.7
28.8
85
181
66
1.0
31.2
19.0
26.8
80
201
53
0.9
27.3
17.8
24.8
83
176
45
1.0
31.1
21.9
41.9
80
181
45
1.0
32.9
25.2
72.5
80
181
45
1.0
0.0
0.0
0.0
0.0
0.0
0.0
0.0
Cash Flow Statement
Y/E March
EBITDA
Other Inc/excep. items
Interest paid
Direct Taxes Paid
(Inc)/Dec in Wkg. Capital
Preference dividend paid
CF from Oper. Activity
(Inc)/Dec in FA + CWIP
(Pur)/Sale of Invest.
CF from Invest. Activity
Issue of Shares
Inc/(Dec) in Debt
Dividends Paid
Others
CF from Finan. Activity
Inc/(Dec) in Cash
Add: Beginning Balance
Closing Balance
2012
7,396
1,384
-50.0
-2,645
-4,622
1,463
-1,617
-52
-1,669
606
4
-1,683
-120
-1,193
-1,399
12,500
11,100
2013
9,545
1,461
-85.5
-3,288
-3,838
3,794
-974
24
-950
1,348
7
-2,232
33
-844
2,000
11,100
13,100
2014
12,042
1,807
-157.8
-4,301
-462
8,929
-2,256
-2,290
-4,546
-20,159
20,171
-2,244
49
-2,183
2,200
13,100
15,300
2015
12,547
2,278
-102.6
-4,517
-5,132
5,072
-1,198
1,477
279
2,472
-7
-2,601
-37
-173
5,179
15,300
20,480
2016
14,994
1,685
-123
-5,553
-7,300
3,703
-2,925
-1,584
-4,509
0
-13
-2,613
59
-2,566
-3,373
20,480
17,123
(INR Million)
2017E
19,472
2,192
-323
-6,073
-4,850
10,418
-626
0
-626
0
10
-2,613
-72
-2,675
7,118
17,123
45,466
2018E
25,538
3,961
-303
-9,278
-5,357
14,561
-677
0
-677
0
-4,034
-2,903
-72
-7,009
6,876
45,466
52,343
25 October 2016
9

Zee Entertainment
Corporate profile
Company description
Exhibit 1: Sensex rebased
ZEEL is the leading player in television broadcasting
and syndication of content overseas with a bouquet
of 40 TV channels. Zee has well-established reach of
over 730m+ viewers across 169 countries. ZEEL has
channels encompassing all major genres like Hindi
GEC, Hindi Movies, Regional GECs and Sports.
Source: MOSL/Bloomberg
Exhibit 2: Shareholding pattern (%)
Sep-16
Promoter
DII
FII
Others
43.1
3.6
48.0
5.3
Jun-16
43.1
3.8
48.1
5.0
Sep-15
43.1
3.5
48.4
5.0
Source: Capitaline
Exhibit 3: Top holders
Holder Name
Oppenheimer Devloping Markets Fund
Government of Singapore
Vanguard International Growth Fund
Oppenheimer Global Fund
NA
% Holding
7.0
1.6
1.3
1.1
0.0
Source: Capitaline
Note: FII Includes depository receipts
Exhibit 4: Top management
Name
Subhash Chandra
Punit Goenka
M Lakshminarayanan
Designation
Chairman
Managing Director & CEO
Executive VP & CS
Exhibit 5: Directors
Name
Ashok Kurien
Neharika Vohra
Subodh Kumar
Name
Manish Chokhani
Sunil Sharma
Adesh Kumar Gupta
Source: Capitaline
*Independent
Exhibit 6: Auditors
Name
MGB & Co LLP
Type
Statutory
Exhibit 7: MOSL forecast v/s consensus
EPS
(INR)
FY17
FY18
MOSL
forecast
14.8
19.5
Consensus
forecast
13.5
17.3
Variation (%)
9.6
12.8
Source: Bloomberg
Source: Capitaline
25 October 2016
10

Zee Entertainment
NOTES
25 October 2016
11

Disclosures
This document has been prepared by Motilal Oswal Securities Limited (hereinafter referred to as Most) to provide information about the company (ies) and/sector(s), if any, covered in the report and may be distributed by it and/or
its affiliated company(ies). This report is for personal information of the selected recipient/s and does not construe to be any investment, legal or taxation advice to you. This research report does
Zee Entertainment
or
not constitute an offer, invitation
inducement to invest in securities or other investments and Motilal Oswal Securities Limited (hereinafter referred as MOSt) is not soliciting any action based upon it. This report is not for public distribution and has been furnished to
you solely for your general information and should not be reproduced or redistributed to any other person in any form. This report does not constitute a personal recommendation or take into account the particular investment
objectives, financial situations, or needs of individual clients. Before acting on any advice or recommendation in this material, investors should consider whether it is suitable for their particular circumstances and, if necessary, seek
professional advice. The price and value of the investments referred to in this material and the income from them may go down as well as up, and investors may realize losses on any investments. Past performance is not a guide
for future performance, future returns are not guaranteed and a loss of original capital may occur.
MOSt and its affiliates are a full-service, integrated investment banking, investment management, brokerage and financing group. We and our affiliates have investment banking and other business relationships with a some
companies covered by our Research Department. Our research professionals may provide input into our investment banking and other business selection processes. Investors should assume that MOSt and/or its affiliates are
seeking or will seek investment banking or other business from the company or companies that are the subject of this material and that the research professionals who were involved in preparing this material may educate
investors on investments in such business . The research professionals responsible for the preparation of this document may interact with trading desk personnel, sales personnel and other parties for the purpose of gathering,
applying and interpreting information. Our research professionals are paid on twin parameters of performance & profitability of MOSt.
MOSt generally prohibits its analysts, persons reporting to analysts, and members of their households from maintaining a financial interest in the securities or derivatives of any companies that the analysts cover. Additionally,
MOSt generally prohibits its analysts and persons reporting to analysts from serving as an officer, director, or advisory board member of any companies that the analysts cover. Our salespeople, traders, and other professionals or
affiliates may provide oral or written market commentary or trading strategies to our clients that reflect opinions that are contrary to the opinions expressed herein, and our proprietary trading and investing businesses may make
investment decisions that are inconsistent with the recommendations expressed herein. In reviewing these materials, you should be aware that any or all of the foregoing among other things, may give rise to real or potential
conflicts of interest. MOSt and its affiliated company(ies), their directors and employees and their relatives may; (a) from time to time, have a long or short position in, act as principal in, and buy or sell the securities or derivatives
thereof of companies mentioned herein. (b) be engaged in any other transaction involving such securities and earn brokerage or other compensation or act as a market maker in the financial instruments of the company(ies)
discussed herein or act as an advisor or lender/borrower to such company(ies) or may have any other potential conflict of interests with respect to any recommendation and other related information and opinions.; however the
same shall have no bearing whatsoever on the specific recommendations made by the analyst(s), as the recommendations made by the analyst(s) are completely independent of the views of the affiliates of MOSt even though
there might exist an inherent conflict of interest in some of the stocks mentioned in the research report
Reports based on technical and derivative analysis center on studying charts company's price movement, outstanding positions and trading volume, as opposed to focusing on a company's fundamentals and, as such, may not
match with a report on a company's fundamental analysis. In addition MOST has different business segments / Divisions with independent research separated by Chinese walls catering to different set of customers having various
objectives, risk profiles, investment horizon, etc, and therefore may at times have different contrary views on stocks sectors and markets.
Unauthorized disclosure, use, dissemination or copying (either whole or partial) of this information, is prohibited. The person accessing this information specifically agrees to exempt MOSt or any of its affiliates or employees from,
any and all responsibility/liability arising from such misuse and agrees not to hold MOSt or any of its affiliates or employees responsible for any such misuse and further agrees to hold MOSt or any of its affiliates or employees free
and harmless from all losses, costs, damages, expenses that may be suffered by the person accessing this information due to any errors and delays. The information contained herein is based on publicly available data or other
sources believed to be reliable. Any statements contained in this report attributed to a third party represent MOSt’s interpretation of the data, information and/or opinions provided by that third party either publicly or through a
subscription service, and such use and interpretation have not been reviewed by the third party. This Report is not intended to be a complete statement or summary of the securities, markets or developments referred to in the
document. While we would endeavor to update the information herein on reasonable basis, MOSt and/or its affiliates are under no obligation to update the information. Also there may be regulatory, compliance, or other reasons
that may prevent MOSt and/or its affiliates from doing so. MOSt or any of its affiliates or employees shall not be in any way responsible and liable for any loss or damage that may arise to any person from any inadvertent error in
the information contained in this report. MOSt or any of its affiliates or employees do not provide, at any time, any express or implied warranty of any kind, regarding any matter pertaining to this report, including without limitation
the implied warranties of merchantability, fitness for a particular purpose, and non-infringement. The recipients of this report should rely on their own investigations.
This report is intended for distribution to institutional investors. Recipients who are not institutional investors should seek advice of their independent financial advisor prior to taking any investment decision based on this report or
for any necessary explanation of its contents.
Most and it’s associates may have managed or co-managed public offering of securities, may have received compensation for investment banking or merchant banking or brokerage services, may have received any compensation
for products or services other than investment banking or merchant banking or brokerage services from the subject company in the past 12 months.
Most and it’s associates have not received any compensation or other benefits from the subject company or third party in connection with the research report.
Subject Company may have been a client of Most or its associates during twelve months preceding the date of distribution of the research report
MOSt and/or its affiliates and/or employees may have interests/positions, financial or otherwise of over 1 % at the end of the month immediately preceding the date of publication of the research in the securities mentioned in this
report. To enhance transparency, MOSt has incorporated a Disclosure of Interest Statement in this document. This should, however, not be treated as endorsement of the views expressed in the report.
Motilal Oswal Securities Limited is registered as a Research Analyst under SEBI (Research Analyst) Regulations, 2014. SEBI Reg. No. INH000000412
Pending Regulatory inspections against Motilal Oswal Securities Limited:
SEBI pursuant to a complaint from client Shri C.R. Mohanraj alleging unauthorized trading, issued a letter dated 29th April 2014 to MOSL notifying appointment of an Adjudicating Officer as per SEBI regulations to hold inquiry and
adjudge violation of SEBI Regulations; MOSL replied to the Show Cause Notice whereby SEBI granted us an opportunity of Inspection of Documents. Since all the documents requested by us were not covered we have requested
to SEBI vide our letter dated June 23, 2015 to provide pending list of documents for inspection.
List of associate companies of Motilal Oswal Securities Limited -
Click here to access detailed report
Analyst Certification
The views expressed in this research report accurately reflect the personal views of the analyst(s) about the subject securities or issues, and no part of the compensation of the research analyst(s) was, is, or will be directly or
indirectly related to the specific recommendations and views expressed by research analyst(s) in this report. The research analysts, strategists, or research associates principally responsible for preparation of MOSt research
receive compensation based upon various factors, including quality of research, investor client feedback, stock picking, competitive factors and firm revenues
Disclosure of Interest Statement
Analyst ownership of the stock
Served as an officer, director or employee -
ZEE ENTERTAINMENT ENTERPR
No
No
A graph of daily closing prices of securities is available at www.nseindia.com and http://economictimes.indiatimes.com/markets/stocks/stock-quotes
Regional Disclosures (outside India)
This report is not directed or intended for distribution to or use by any person or entity resident in a state, country or any jurisdiction, where such distribution, publication, availability or use would be contrary to law, regulation or
which would subject MOSt & its group companies to registration or licensing requirements within such jurisdictions.
For Hong Kong:
This report is distributed in Hong Kong by Motilal Oswal capital Markets (Hong Kong) Private Limited, a licensed corporation (CE AYY-301) licensed and regulated by the Hong Kong Securities and Futures
Commission (SFC) pursuant to the Securities and Futures Ordinance (Chapter 571 of the Laws of Hong Kong) “SFO”. As per SEBI (Research Analyst Regulations) 2014 Motilal Oswal Securities (SEBI Reg No. INH000000412)
has an agreement with Motilal Oswal capital Markets (Hong Kong) Private Limited for distribution of research report in Kong Kong. This report is intended for distribution only to “Professional Investors” as defined in Part I of
Schedule 1 to SFO. Any investment or investment activity to which this document relates is only available to professional investor and will be engaged only with professional investors.” Nothing here is an offer or solicitation of
these securities, products and services in any jurisdiction where their offer or sale is not qualified or exempt from registration. The Indian Analyst(s) who compile this report is/are not located in Hong Kong & are not conducting
Research Analysis in Hong Kong.
For U.S.
Motilal Oswal Securities Limited (MOSL) is not a registered broker - dealer under the U.S. Securities Exchange Act of 1934, as amended (the"1934 act") and under applicable state laws in the United States. In addition MOSL is
not a registered investment adviser under the U.S. Investment Advisers Act of 1940, as amended (the "Advisers Act" and together with the 1934 Act, the "Acts), and under applicable state laws in the United States. Accordingly, in
the absence of specific exemption under the Acts, any brokerage and investment services provided by MOSL, including the products and services described herein are not available to or intended for U.S. persons.
This report is intended for distribution only to "Major Institutional Investors" as defined by Rule 15a-6(b)(4) of the Exchange Act and interpretations thereof by SEC (henceforth referred to as "major institutional investors"). This
document must not be acted on or relied on by persons who are not major institutional investors. Any investment or investment activity to which this document relates is only available to major institutional investors and will be
engaged in only with major institutional investors. In reliance on the exemption from registration provided by Rule 15a-6 of the U.S. Securities Exchange Act of 1934, as amended (the "Exchange Act") and interpretations thereof by
the U.S. Securities and Exchange Commission ("SEC") in order to conduct business with Institutional Investors based in the U.S., MOSL has entered into a chaperoning agreement with a U.S. registered broker-dealer, Motilal
Oswal Securities International Private Limited. ("MOSIPL"). Any business interaction pursuant to this report will have to be executed within the provisions of this chaperoning agreement.
The Research Analysts contributing to the report may not be registered /qualified as research analyst with FINRA. Such research analyst may not be associated persons of the U.S. registered broker-dealer, MOSIPL, and
therefore, may not be subject to NASD rule 2711 and NYSE Rule 472 restrictions on communication with a subject company, public appearances and trading securities held by a research analyst account.
For Singapore
Motilal Oswal Capital Markets Singapore Pte Limited is acting as an exempt financial advisor under section 23(1)(f) of the Financial Advisers Act(FAA) read with regulation 17(1)(d) of the Financial Advisors Regulations and is a
subsidiary of Motilal Oswal Securities Limited in India. This research is distributed in Singapore by Motilal Oswal Capital Markets Singapore Pte Limited and it is only directed in Singapore to accredited investors, as defined in the
Financial Advisers Regulations and the Securities and Futures Act (Chapter 289), as amended from time to time.
In respect of any matter arising from or in connection with the research you could contact the following representatives of Motilal Oswal Capital Markets Singapore Pte Limited:
Varun Kumar
Varun.kumar@motilaloswal.com
Contact : (+65) 68189232
Office Address:21 (Suite 31),16 Collyer Quay,Singapore 04931
Kadambari Balachandran
kadambari.balachandran@motilaloswal.com
(+65) 68189233 / 65249115
25 October 2016
Motilal Oswal Tower, Level 9, Sayani Road, Prabhadevi, Mumbai 400 025
Phone: +91 22 3982 5500 E-mail: reports@motilaloswal.com
Motilal Oswal Securities Ltd
12