26 October 2016
2QFY17
Results Update | Sector: Consumer
ITC
Buy
BSE SENSEX
27,836
Bloomberg
Equity Shares (m)
M.Cap.(INRb)/(USDb)
52-Week Range (INR)
1, 6, 12 Rel. Per (%)
Avg Val, INRm
Free float (%)
S&P CNX
8,615
ITC IN
12070.8
2883.7 / 44.1
266 / 178
-3/2/-1
2634
100.0
CMP: INR239
TP: INR285 (+19%)
Cig volumes surprise on the upside
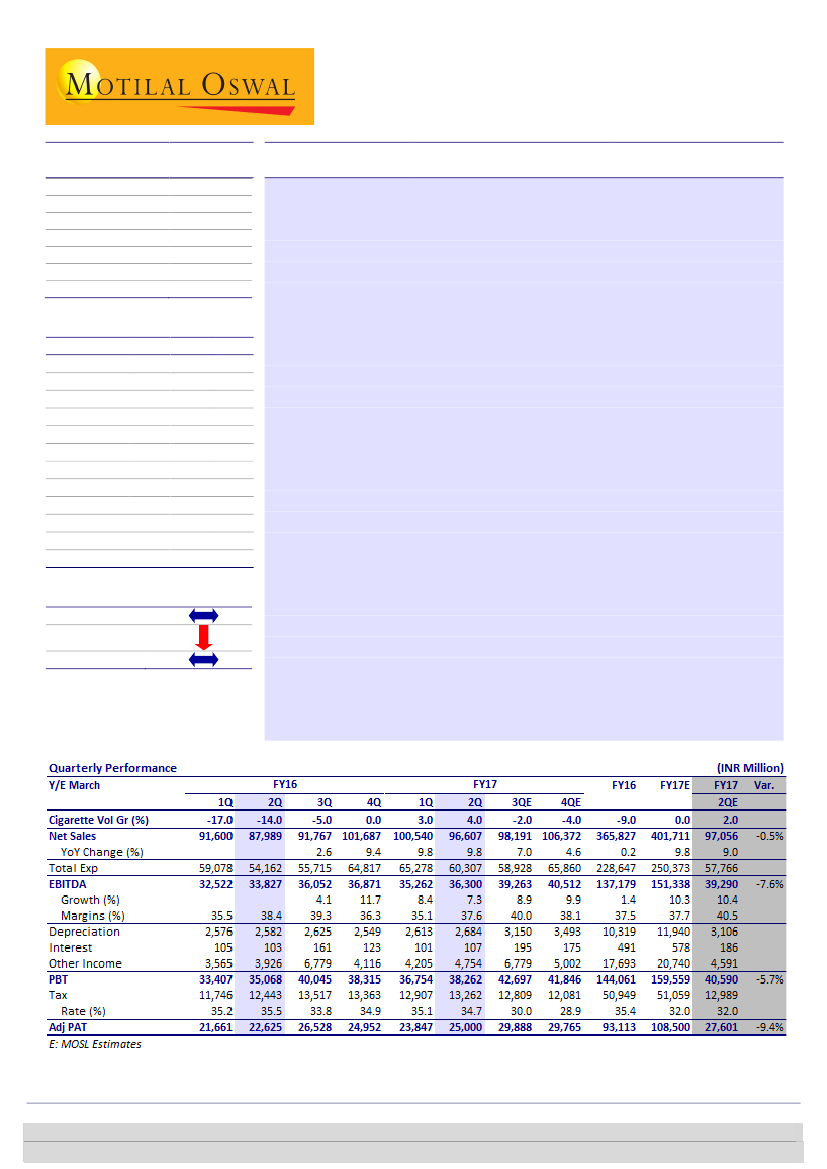
2QFY17 revenues better than estimate:
Net revenues (Ind-AS) increased 9.8%
YoY (est. of +9% YoY) to INR96.6b. EBITDA and PAT were below estimates due
to lower-than-expected EBITDA margin (-80bp YoY v/s est. of +50bp) and PAT
before other comprehensive income (+10.5% YoY to INR25b v/s est. of
+13.5%). Absolute sales, EBITDA and PAT numbers differ from our estimates
due to Ind-AS adjustments in the base quarter.
We reckon cig volumes were up 4% YoY
(best numbers since 4QFY13 and
better than our expectation of +2%), aided by higher growth in the sub-65mm
segment (now well over 20% share in overall volumes, in our view), benign
base (2QFY16: 14% volume decline) and lower price increases of late. Cig
revenues and EBIT grew 7.1% and 8.4% YoY, respectively (like-to-like), with
40bp expansion of cig EBIT margin (despite mix impact YoY). While
performance on cig volumes has been creditable, base is less favorable going
forward (3QFY16 and 4QFY16 base of -5% and 0%, respectively).
Non-cig FMCG business posted robust 13.3% YoY sales growth,
which is highly
creditable in a weak operating environment. The segment reported EBIT loss of
INR33m, worse than our expectations of marginal profit, but better than
INR45m EBIT loss in 1QFY17. Agri business revenue increased only 2% as
currency depreciation in Brazil, Russia and Australia has made their agri
products more competitive. Margins were flat YoY.
Maintain Buy:
Near-term challenges remain due to weaker cig volume base
going forward and potential cess on cigarettes (to be decided by GST Council in
November). However, cig volume growth in FY17 is likely to be better than
preceding years, and other FMCG is showing resilience in a weak market. At
22.7x FY18E, ITC trades at significant discount to peers. Maintain
Buy
with
target multiple of 25x September 2018E EPS (target price of INR285).
Financials & Valuations (INR b)
2016 2017E
Y/E Mar
Net Sales
362.2 397.7
EBITDA
137.2 151.3
NP
93.1 108.5
EPS (INR)
7.7
9.0
EPS Gr. (%)
-3.5
16.5
BV/Sh. (INR)
27.3
31.8
RoE (%)
29.3
30.4
RoCE (%)
27.8
29.2
P/E (x)
31.0
26.6
P/BV (x)
8.8
7.5
EV/EBITDA (x)
19.6
17.6
Div. Yield
2.9
2.4
2018E
448.5
176.7
126.8
10.5
16.9
36.6
30.7
30.0
22.7
6.5
14.9
2.8
Estimate change
TP change
Rating change
Investors are advised to refer through important disclosures made at the last page of the Research Report.
Motilal Oswal research is available on www.motilaloswal.com/Institutional-Equities, Bloomberg, Thomson Reuters, Factset and S&P Capital.
Krishnan Sambamoorthy
(Krishnan.Sambamoorthy@MotilalOswal.com); +91 22 6129 1545
Vishal Punmiya
(Vishal.Punmiya@MotilalOswal.com); +91 22 6129 1547

ITC
Cigarettes
ITC’s 2QFY17 topline was better than estimates. Net revenues (Ind AS) increased
9.8% YoY (est. 9%) to INR 96.6b. EBITDA and PAT were below estimates as
EBITDA margin decline stood at 80bps YoY (vs. our estimate of 50bps increase)
while PAT before other comprehensive income grew 10.5% YoY (est. 13.5%) to
INR 25b.
Cigarette volumes up 4%; Cig EBIT margin grew 40bps YoY
Cigarette volumes were up 4% YoY
(est. 2% YoY)
aided by higher growth in the
below 65mm segment
(segment now well over 20% share in the overall
volumes),
benign base
(2QFY16 reported 14% volume decline)
and lower price
increases off late.
Cig. revenue and EBIT posted 7.1% and 8.4% YoY growth resp on a like to with
40bps expansion of Cig EBIT margin (despite mix impact YoY). The focus on
higher end DSFT products has meant that price erosion in mix is not too adverse.
EBITDA margin percentage is the same as the > 65 mm products for DSFT but
absolute EBITDA contribution per stick is lower.
Cig. volumes had been impacted over the past 3 years due to consecutive excise
duty/VAT increases and regulatory headwinds but the worst impact in terms of
volume now seems to be over.
Hearing by the Karnataka High Court on the 85% packaging norm is reportedly
likely to resume shortly after part hearing in 2QFY17.
Having said that, the company had a favourable base of negative 14% cigarette
volumes in the base quarter. Advantage of favourable base extends to the next
quarter as well because 3QFY16 had witnessed 5% cigarette volume decline
according to our calculations but base is not favourable from 4QFY16.
If the gradual volume recovery persists then pricing confidence will also come
back possibly leading to more price increases towards 3QFY17 ahead of the
national and state budgets. However we believe that the company is likely to
wait and watch on the quantum of price increase until there is clarity on
possible cess on cigarettes under GST.
FMCG - Others: Remarkable performance despite multiple headwinds
In our reckoning given the weak environment as well as significant size of the
Other FMCG business in terms of sales for them to report double digit sales
growth in this segment is creditable. Segment reported EBIT loss of INR32m was
worse than our expectations of a marginal profit but was better than the 45 mn
EBIT loss in 1QFY17. Losses persist due to gestation costs of new categories like
juices, dairy, gums and health & hygiene.
Noodles sales have recovered, Atta continues to do well off a high base and
finger snacks (Bingo) is doing well. What’s doing very well for ITC in biscuits is
Mom’s Magic
cookies. While it is still early days for
Mom’s magic,
(launched less
than two years ago) it has made peers sit up and take notice which is creditable
in our view.
Personal care brands Savlon and Vivel are doing well.
26 October 2016
2

ITC
Agri business: growth moderates to 2%
Depreciation in Brazilian, Russian and Australian currencies have aided agri
exports from these countries limiting ITC’s growth. Agri margins were flat YoY.
Hotels: Weak pricing scenario prevails
Hotel segment revenues grew only 2.5% to INR2.97b impacted by weak pricing
scenario due to excessive room inventory in key domestic markets, and weak
macro environment both in India and major source markets.
Segment reported small EBIT of INR7m compared to a loss of INR55 mn in the
base quarter 2QFY16.
Paper: Flat revenues, EBIT improves
Paper and Paperboard business sales were flat at INR12.5b impacted by the
slowdown in the FMCG and Cigarette industry. Segment EBIT grew 10.3% YoY to
INR2.4b as EBIT margin expanded 170bps YoY to 17.4% led by benign input
costs.
Paper & Paper board business is economy linked. Unless there is a big pickup in
client sectors like FMCG and Pharma there is unlikely to be a sharp recovery in
the segment.
Valuation and view
Near term challenges remain due to weaker cigarette volume base going
forward and potential cess on cigarettes in GST to be decided by the GST council
in November. However cigarette volume growth in FY17 is likely to be better
than preceding years and Other FMCG is showing resilience in a weak market. At
22.7x FY18E, ITC trades at significant discount to peers.
Maintain BUY with target multiple of 25xSeptember 2018 EPS (target price of
INR285).
Exhibit 2: Falling P/E premium vs. Sensex
150
100
24.2
50
0
-50
43.2
47.2
ITC PE Relative to Sensex PE (%)
LPA (%)
Exhibit 1: ITC P/E (x): Valuations near long term averages
39.0
31.0
23.0
15.0
7.0
23.8
15.1
PE (x)
Peak(x)
Avg(x)
31.5
Min(x)
Source: Bloomberg, Company, MOSL
26 October 2016
3

ITC
Exhibit 3: Valuation Matrix of coverage universe
Company
Consumer
Asian Paints
Britannia
Colgate
Dabur
Emami
Godrej
GSK
Hind.
ITC
Jyothy Labs
Marico
Nestle
Page
Parag Milk
Pidilite Inds.
P&G Hygiene
Radico
United Brew.
United Spirits
Retail
Jubilant
Shopper's
Titan
Reco
Price
(INR)
1,123
3,263
926
296
1,169
1,579
5,968
843
239
355
281
6,822
16,718
310
709
6,969
139
874
2,327
1,059
373
375
Mkt Cap
(USD M)
16,117
5,858
3,771
7,803
3,971
8,046
3,756
27,289
43,157
962
5,422
9,843
2,791
391
5,441
3,386
276
3,458
5,061
1,042
459
4,980
EPS Growth YoY (%)
FY16 FY17E FY18E
26.3
46.3
8.7
17.2
17.7
24.4
20.4
12.9
-3.5
-41.6
26.1
-7.3
18.7
-66.7
47.3
22.3
3.9
13.6
LP
-11.7
19.3
-13.4
16.0
12.5
2.2
12.5
10.0
22.9
4.8
7.1
16.5
102.3
14.6
-5.5
28.2
38.2
23.7
9.5
-7.2
30.1
124.0
-6.2
48.9
11.4
18.8
25.0
31.1
15.5
23.9
25.8
10.0
12.8
16.9
16.2
22.8
25.5
37.0
37.9
18.2
21.6
29.7
26.3
50.8
74.7
30.9
21.0
P/E (x)
FY16
FY17E FY18E
60.0
46.6
41.5
41.7
46.4
47.6
35.7
44.3
31.0
86.6
50.1
56.9
80.1
46.2
48.1
53.5
20.2
78.3
139.1
70.8
64.1
46.7
51.7
41.4
40.6
37.1
42.2
38.7
34.1
41.3
26.6
42.8
43.7
60.2
62.5
33.4
38.9
48.8
21.7
60.2
62.1
75.4
43.0
41.9
43.5
33.1
30.9
32.1
34.1
30.8
31.0
36.6
22.7
36.8
35.6
48.0
45.6
24.2
32.9
40.2
16.8
47.7
41.2
43.2
32.9
34.6
EV/EBITDA (x)
FY16 FY17E FY18E
38.1
33.3
26.3
33.5
39.6
35.2
23.7
30.9
19.6
31.0
34.4
40.1
49.6
17.3
29.3
35.6
12.8
32.1
43.1
25.9
15.3
38.6
33.0
29.4
24.3
29.8
32.8
29.6
24.3
28.6
17.6
24.7
30.5
35.0
40.1
15.9
25.2
31.5
12.6
27.3
32.7
24.7
12.6
31.7
28.0
23.0
18.8
25.8
27.2
24.4
21.5
25.4
14.9
21.2
25.0
27.9
29.7
12.6
21.1
25.2
10.7
22.6
24.5
17.0
10.4
25.9
RoE (%)
FY16
34.7
55.9
67.9
33.3
43.4
23.4
30.8
82.4
29.3
9.1
36.9
40.9
46.0
19.5
29.9
30.9
10.2
14.9
19.8
13.4
6.3
21.3
Div.
FY16
0.8
0.6
1.2
0.7
0.7
0.6
0.9
1.9
2.9
1.1
1.2
0.7
0.5
0.0
0.6
0.6
0.5
0.1
0.0
0.2
0.0
0.6
Neutral
Buy
Buy
Neutral
Buy
Neutral
Neutral
Neutral
Buy
Neutral
Neutral
Neutral
Buy
Neutral
Buy
Buy
Neutral
Buy
Buy
Neutral
Neutral
Neutral
Note: For Nestle FY16 means CY15
Source: Company, MOSL
26 October 2016
4

ITC
Financials and Valuations
Income Statement
Y/E March
Net Sales
Operational Income
Total Revenue
Change (%)
Total Expenditure
EBITDA
Change (%)
Margin (%)
Depreciation
Int. and Fin. Charges
Other Inc. - Recurring
Profit before Taxes
Change (%)
Margin (%)
Tax
Tax Rate (%)
Profit after Taxes
Change (%)
Margin (%)
Reported PAT
Balance Sheet
Y/E March
Share Capital
Reserves
Net Worth
Loans
Deferred Liability
Capital Employed
Gross Block
Less: Accum. Depn.
Net Fixed Assets
Capital WIP
Investments
Current
Non-current
Curr. Assets, L&A
Inventory
Account Receivables
Cash and Bank Balance
Others
Curr. Liab. and Prov.
Account Payables
Other Liabilities
Provisions
Net Current Assets
Application of Funds
E: MOSL Estimates
2011
211,676
2,914
214,590
16.7
140,467
74,123
17.1
35.0
6,560
679
5,798
72,682
20.8
34.3
22,804
31.4
49,876
22.6
23.6
49,876
2012
247,984
3,490
251,475
17.2
162,788
88,687
19.6
35.8
6,985
980
8,253
88,975
22.4
35.9
26,777
30.7
61,624
23.6
24.8
61,624
2013
296,056
2,957
299,013
18.9
192,543
106,470
20.1
36.0
7,956
1,059
9,387
106,842
20.1
36.1
29,348
30.6
74,184
20.4
25.1
74,184
2014
328,826
3,560
332,386
11.2
207,631
124,755
17.2
37.9
8,999
236
11,071
126,591
18.5
38.5
37,911
30.6
87,852
18.4
26.7
87,852
2015
360,832
4,242
365,074
9.8
230,128
134,946
8.2
37.4
9,617
785
15,431
139,975
10.6
38.8
40,210
31.4
96,077
9.4
26.6
96,077
2016
362,206
3,621
365,827
0.2
228,647
137,179
1.7
37.9
10,319
491
17,693
144,061
2.9
39.8
50,949
35.4
93,113
-3.1
25.7
93,113
2017E
397,728
3,983
401,711
9.8
250,373
151,338
10.3
38.1
11,940
578
20,740
159,559
10.8
40.1
46,272
32.0
108,500
16.5
27.3
108,500
(INR Million)
2018E
448,463
4,382
452,845
12.7
276,159
176,686
16.7
39.4
13,434
578
23,796
186,470
16.9
41.6
54,076
32.0
126,800
16.9
28.3
126,800
(INR Million)
2018E
12,071
430,298
442,368
165
7,426
449,959
268,684
105,890
162,793
28,886
174,846
97,492
77,354
239,345
97,332
20,273
83,932
37,807
155,911
69,339
16,832
69,740
83,433
449,959
2011
11,455
148,077
159,532
343
8,019
167,894
127,658
44,208
83,451
13,334
55,547
42,189
13,358
97,901
52,692
8,851
22,432
13,926
82,338
39,685
8,219
34,435
15,563
167,894
2012
11,728
176,191
187,919
119
8,727
196,765
138,033
48,197
89,837
23,923
63,166
43,633
19,533
112,957
56,378
9,824
28,189
18,565
93,117
46,989
10,945
35,183
19,840
196,765
2013
11,853
211,026
222,879
113
12,037
235,029
165,884
54,698
111,186
15,786
70,603
50,594
20,009
142,600
66,002
11,633
36,150
28,815
105,146
50,571
13,091
41,485
37,454
235,029
2014
11,930
250,690
262,620
155
12,970
275,745
181,756
62,269
119,487
23,598
88,234
63,113
25,122
160,975
73,595
21,654
32,894
32,832
116,549
54,498
14,332
47,719
44,426
275,745
2015
12,023
295,334
307,357
143
16,316
323,816
209,908
72,136
137,771
25,155
84,055
59,638
24,416
194,976
78,368
17,224
75,886
23,498
118,140
53,817
14,226
50,097
76,835
323,816
2016
12,071
317,219
329,290
165
18,484
347,939
218,684
80,516
138,168
28,886
128,542
64,613
63,929
199,588
85,198
16,864
65,640
31,887
147,246
60,523
18,038
68,685
52,343
347,939
2017E
12,071
372,378
384,448
165
13,375
397,988
243,684
92,456
151,227
28,886
147,805
77,483
70,322
207,366
88,301
17,979
66,701
34,383
137,296
62,952
14,669
59,675
70,069
397,988
26 October 2016
5

ITC
Financials and Valuations
Ratios
Y/E March
Basic (INR)
EPS
Cash EPS
BV/Share
DPS
Payout %
Valuation (x)
P/E
Cash P/E
EV/Sales
EV/EBITDA
P/BV
Dividend Yield (%)
Return Ratios (%)
RoE
RoCE
RoIC
Working Capital Ratios
Debtor (Days)
Asset Turnover (x)
Leverage Ratio
Debt/Equity (x)
Cash Flow Statement
Y/E March
OP/(loss) before Tax
Int./Div. Received
Depreciation and Amort.
Interest Paid
Direct Taxes Paid
Incr in WC
CF from Operations
Incr Decr in FA
Free Cash Flow
Pur of Investments
CF from Invest.
Issue of shares
Incr in Debt
Interest Income
Interest Paid
Dividend Paid
Others
CF from Fin. Activity
Incr of Cash
Add: Opening Balance
Closing Balance
E: MOSL Estimates
2011
4.4
4.9
13.9
3.5
80.2
2012
5.3
5.9
16.0
3.5
66.4
2013
6.3
6.9
18.8
4.1
65.4
2014
7.4
8.1
22.0
4.7
63.5
2015
8.0
8.8
25.6
5.0
62.8
2016
7.7
8.6
27.3
6.8
88.4
2017E
9.0
10.0
31.8
5.8
64.4
2018E
10.5
11.6
36.6
6.8
64.4
54.9
48.5
13.3
37.9
17.2
1.5
45.5
40.8
11.3
31.5
14.9
1.5
38.2
34.5
9.4
26.1
12.7
1.7
32.4
29.4
8.4
22.1
10.9
2.0
29.9
27.2
7.5
20.2
9.3
2.1
31.0
27.9
7.4
19.6
8.8
2.9
26.6
23.9
6.7
17.6
7.5
2.4
22.7
20.6
5.9
14.9
6.5
2.8
33.2
31.8
63.2
15
1.3
35.5
34.2
71.6
14
1.3
36.1
34.7
70.5
13
1.3
36.2
34.5
66.0
18
1.2
33.7
32.2
63.8
20
1.1
29.3
27.8
62.2
17
1.0
30.4
29.2
67.8
16
1.0
30.7
30.0
70.1
16
1.0
0.0
0.0
0.0
0.0
0.0
0.0
0.0
0.0
(INR Million)
2018E
186,470
23,796
13,434
578
59,670
-3,867
120,882
25,000
95,882
27,041
-52,041
0
0
23,796
578
59,675
-15,153
-51,610
17,231
66,701
83,932
2011
72,682
5,798
6,560
679
22,806
4,522
47,402
11,224
36,178
-1,722
-9,502
5,118
183
5,798
679
38,182
1,031
-26,731
11,170
11,263
22,432
2012
88,975
8,253
6,985
980
27,352
-1,480
65,811
20,964
44,847
7,619
-28,582
7,570
-224
8,253
980
34,435
-11,656
-31,472
5,757
22,432
28,189
2013
106,842
9,387
7,956
1,059
32,658
9,654
65,612
19,714
45,898
7,437
-27,149
9,140
-6
9,387
1,059
35,183
-12,781
-30,503
7,961
28,189
36,150
2014
126,591
11,071
8,999
236
38,739
10,228
77,217
23,684
53,532
17,631
-41,313
6,859
43
11,071
236
41,485
-15,413
-39,160
-3,256
36,150
32,894
2015
139,975
15,431
9,617
785
43,898
-10,583
101,381
29,709
71,673
-4,180
-25,529
9,726
-12
15,431
785
47,719
-9,501
-32,860
42,992
32,894
75,886
2016
144,061
17,693
10,319
491
50,949
-14,246
102,416
12,507
89,909
44,488
-56,995
5,285
21
17,693
491
50,097
-28,079
-55,668
-10,246
75,886
65,640
2017E
159,559
20,740
11,940
578
51,059
16,665
83,614
25,000
58,614
19,263
-44,263
0
0
20,740
578
68,401
9,950
-38,289
1,062
65,640
66,702
26 October 2016
6

ITC
Corporate profile
Company description
ITC is an associate of BAT (British American
Tobacco) controls more than 2/3rd of the cigarette
market in India. ITC has emerged as a diversified
conglomerate
with
leading
presence
in
Paperboards, Hotels and Processed foods. E-
Choupal, the agri rural initiative of the company has
been widely appreciated for its foresight in
harnessing the potential in the rural market.
Source: MOSL/Bloomberg
Exhibit 1: Sensex rebased
Exhibit 2: Shareholding pattern (%)
Sep-16
Promoter
DII
FII
Others
0.0
34.9
21.1
44.0
Jun-16
0.0
35.0
20.8
44.3
Sep-15
0.0
35.1
21.0
43.9
Source: Capitaline
Exhibit 3: Top holders
Holder Name
Myddleton Investment Company Limited
LIC of India
Specified Undertaking of the Unit Trust of
India
Rothmans International Enterprises Limited
The New India Assurance Company Limited
% Holding
24.6
14.3
11.1
5.3
1.8
Source: Capitaline
Note: FII Includes depository receipts
Exhibit 4: Top management
Name
Yogesh Chander Deveshwar
Biswa Behari Chatterjee
Sanjiv Puri
Designation
Chairman
Executive VP & CS
Whole Time Director & COO
Exhibit 5: Directors
Name
Anil Baijal
Meera Shankar
S B Mainak
Sahibzada Syed
Rehman
Nirupama Rao
Rajiv Tandon
Habib
ur
Name
Arun Duggal
P B Ramanujam
S Banerjee
Sunil Behari Mathur
Nakul Anand
Source: Capitaline
*Independent
Exhibit 6: Auditors
Name
Deloitte Haskins & Sells
Shome & Banerjee
Type
Statutory
Cost Auditor
Exhibit 7: MOSL forecast v/s consensus
EPS
(INR)
FY17
FY18
MOSL
forecast
9.0
10.5
Consensus
forecast
8.9
10.1
Variation (%)
0.6
3.9
Source: Bloomberg
Source: Capitaline
26 October 2016
7

Disclosures
This document has been prepared by Motilal Oswal Securities Limited (hereinafter referred to as Most) to provide information about the company (ies) and/sector(s), if any, covered in the report and may be distributed by
ITC
it and/or
its affiliated company(ies). This report is for personal information of the selected recipient/s and does not construe to be any investment, legal or taxation advice to you. This research report does not constitute an offer, invitation or
inducement to invest in securities or other investments and Motilal Oswal Securities Limited (hereinafter referred as MOSt) is not soliciting any action based upon it. This report is not for public distribution and has been furnished to
you solely for your general information and should not be reproduced or redistributed to any other person in any form. This report does not constitute a personal recommendation or take into account the particular investment
objectives, financial situations, or needs of individual clients. Before acting on any advice or recommendation in this material, investors should consider whether it is suitable for their particular circumstances and, if necessary, seek
professional advice. The price and value of the investments referred to in this material and the income from them may go down as well as up, and investors may realize losses on any investments. Past performance is not a guide
for future performance, future returns are not guaranteed and a loss of original capital may occur.
MOSt and its affiliates are a full-service, integrated investment banking, investment management, brokerage and financing group. We and our affiliates have investment banking and other business relationships with a some
companies covered by our Research Department. Our research professionals may provide input into our investment banking and other business selection processes. Investors should assume that MOSt and/or its affiliates are
seeking or will seek investment banking or other business from the company or companies that are the subject of this material and that the research professionals who were involved in preparing this material may educate
investors on investments in such business . The research professionals responsible for the preparation of this document may interact with trading desk personnel, sales personnel and other parties for the purpose of gathering,
applying and interpreting information. Our research professionals are paid on twin parameters of performance & profitability of MOSt.
MOSt generally prohibits its analysts, persons reporting to analysts, and members of their households from maintaining a financial interest in the securities or derivatives of any companies that the analysts cover. Additionally,
MOSt generally prohibits its analysts and persons reporting to analysts from serving as an officer, director, or advisory board member of any companies that the analysts cover. Our salespeople, traders, and other professionals or
affiliates may provide oral or written market commentary or trading strategies to our clients that reflect opinions that are contrary to the opinions expressed herein, and our proprietary trading and investing businesses may make
investment decisions that are inconsistent with the recommendations expressed herein. In reviewing these materials, you should be aware that any or all of the foregoing among other things, may give rise to real or potential
conflicts of interest. MOSt and its affiliated company(ies), their directors and employees and their relatives may; (a) from time to time, have a long or short position in, act as principal in, and buy or sell the securities or derivatives
thereof of companies mentioned herein. (b) be engaged in any other transaction involving such securities and earn brokerage or other compensation or act as a market maker in the financial instruments of the company(ies)
discussed herein or act as an advisor or lender/borrower to such company(ies) or may have any other potential conflict of interests with respect to any recommendation and other related information and opinions.; however the
same shall have no bearing whatsoever on the specific recommendations made by the analyst(s), as the recommendations made by the analyst(s) are completely independent of the views of the affiliates of MOSt even though
there might exist an inherent conflict of interest in some of the stocks mentioned in the research report
Reports based on technical and derivative analysis center on studying charts company's price movement, outstanding positions and trading volume, as opposed to focusing on a company's fundamentals and, as such, may not
match with a report on a company's fundamental analysis. In addition MOST has different business segments / Divisions with independent research separated by Chinese walls catering to different set of customers having various
objectives, risk profiles, investment horizon, etc, and therefore may at times have different contrary views on stocks sectors and markets.
Unauthorized disclosure, use, dissemination or copying (either whole or partial) of this information, is prohibited. The person accessing this information specifically agrees to exempt MOSt or any of its affiliates or employees from,
any and all responsibility/liability arising from such misuse and agrees not to hold MOSt or any of its affiliates or employees responsible for any such misuse and further agrees to hold MOSt or any of its affiliates or employees free
and harmless from all losses, costs, damages, expenses that may be suffered by the person accessing this information due to any errors and delays. The information contained herein is based on publicly available data or other
sources believed to be reliable. Any statements contained in this report attributed to a third party represent MOSt’s interpretation of the data, information and/or opinions provided by that third party either publicly or through a
subscription service, and such use and interpretation have not been reviewed by the third party. This Report is not intended to be a complete statement or summary of the securities, markets or developments referred to in the
document. While we would endeavor to update the information herein on reasonable basis, MOSt and/or its affiliates are under no obligation to update the information. Also there may be regulatory, compliance, or other reasons
that may prevent MOSt and/or its affiliates from doing so. MOSt or any of its affiliates or employees shall not be in any way responsible and liable for any loss or damage that may arise to any person from any inadvertent error in
the information contained in this report. MOSt or any of its affiliates or employees do not provide, at any time, any express or implied warranty of any kind, regarding any matter pertaining to this report, including without limitation
the implied warranties of merchantability, fitness for a particular purpose, and non-infringement. The recipients of this report should rely on their own investigations.
This report is intended for distribution to institutional investors. Recipients who are not institutional investors should seek advice of their independent financial advisor prior to taking any investment decision based on this report or
for any necessary explanation of its contents.
Most and it’s associates may have managed or co-managed public offering of securities, may have received compensation for investment banking or merchant banking or brokerage services, may have received any compensation
for products or services other than investment banking or merchant banking or brokerage services from the subject company in the past 12 months.
Most and it’s associates have not received any compensation or other benefits from the subject company or third party in connection with the research report.
Subject Company may have been a client of Most or its associates during twelve months preceding the date of distribution of the research report
MOSt and/or its affiliates and/or employees may have interests/positions, financial or otherwise of over 1 % at the end of the month immediately preceding the date of publication of the research in the securities mentioned in this
report. To enhance transparency, MOSt has incorporated a Disclosure of Interest Statement in this document. This should, however, not be treated as endorsement of the views expressed in the report.
Motilal Oswal Securities Limited is registered as a Research Analyst under SEBI (Research Analyst) Regulations, 2014. SEBI Reg. No. INH000000412
Pending Regulatory inspections against Motilal Oswal Securities Limited:
SEBI pursuant to a complaint from client Shri C.R. Mohanraj alleging unauthorized trading, issued a letter dated 29th April 2014 to MOSL notifying appointment of an Adjudicating Officer as per SEBI regulations to hold inquiry and
adjudge violation of SEBI Regulations; MOSL replied to the Show Cause Notice whereby SEBI granted us an opportunity of Inspection of Documents. Since all the documents requested by us were not covered we have requested
to SEBI vide our letter dated June 23, 2015 to provide pending list of documents for inspection.
List of associate companies of Motilal Oswal Securities Limited -
Click here to access detailed report
Analyst Certification
The views expressed in this research report accurately reflect the personal views of the analyst(s) about the subject securities or issues, and no part of the compensation of the research analyst(s) was, is, or will be directly or
indirectly related to the specific recommendations and views expressed by research analyst(s) in this report. The research analysts, strategists, or research associates principally responsible for preparation of MOSt research
receive compensation based upon various factors, including quality of research, investor client feedback, stock picking, competitive factors and firm revenues
Disclosure of Interest Statement
Analyst ownership of the stock
Served as an officer, director or employee -
ITC
No
No
A graph of daily closing prices of securities is available at www.nseindia.com and http://economictimes.indiatimes.com/markets/stocks/stock-quotes
Regional Disclosures (outside India)
This report is not directed or intended for distribution to or use by any person or entity resident in a state, country or any jurisdiction, where such distribution, publication, availability or use would be contrary to law, regulation or
which would subject MOSt & its group companies to registration or licensing requirements within such jurisdictions.
For Hong Kong:
This report is distributed in Hong Kong by Motilal Oswal capital Markets (Hong Kong) Private Limited, a licensed corporation (CE AYY-301) licensed and regulated by the Hong Kong Securities and Futures
Commission (SFC) pursuant to the Securities and Futures Ordinance (Chapter 571 of the Laws of Hong Kong) “SFO”. As per SEBI (Research Analyst Regulations) 2014 Motilal Oswal Securities (SEBI Reg No. INH000000412)
has an agreement with Motilal Oswal capital Markets (Hong Kong) Private Limited for distribution of research report in Kong Kong. This report is intended for distribution only to “Professional Investors” as defined in Part I of
Schedule 1 to SFO. Any investment or investment activity to which this document relates is only available to professional investor and will be engaged only with professional investors.” Nothing here is an offer or solicitation of
these securities, products and services in any jurisdiction where their offer or sale is not qualified or exempt from registration. The Indian Analyst(s) who compile this report is/are not located in Hong Kong & are not conducting
Research Analysis in Hong Kong.
For U.S.
Motilal Oswal Securities Limited (MOSL) is not a registered broker - dealer under the U.S. Securities Exchange Act of 1934, as amended (the"1934 act") and under applicable state laws in the United States. In addition MOSL is
not a registered investment adviser under the U.S. Investment Advisers Act of 1940, as amended (the "Advisers Act" and together with the 1934 Act, the "Acts), and under applicable state laws in the United States. Accordingly, in
the absence of specific exemption under the Acts, any brokerage and investment services provided by MOSL, including the products and services described herein are not available to or intended for U.S. persons.
This report is intended for distribution only to "Major Institutional Investors" as defined by Rule 15a-6(b)(4) of the Exchange Act and interpretations thereof by SEC (henceforth referred to as "major institutional investors"). This
document must not be acted on or relied on by persons who are not major institutional investors. Any investment or investment activity to which this document relates is only available to major institutional investors and will be
engaged in only with major institutional investors. In reliance on the exemption from registration provided by Rule 15a-6 of the U.S. Securities Exchange Act of 1934, as amended (the "Exchange Act") and interpretations thereof by
the U.S. Securities and Exchange Commission ("SEC") in order to conduct business with Institutional Investors based in the U.S., MOSL has entered into a chaperoning agreement with a U.S. registered broker-dealer, Motilal
Oswal Securities International Private Limited. ("MOSIPL"). Any business interaction pursuant to this report will have to be executed within the provisions of this chaperoning agreement.
The Research Analysts contributing to the report may not be registered /qualified as research analyst with FINRA. Such research analyst may not be associated persons of the U.S. registered broker-dealer, MOSIPL, and
therefore, may not be subject to NASD rule 2711 and NYSE Rule 472 restrictions on communication with a subject company, public appearances and trading securities held by a research analyst account.
For Singapore
Motilal Oswal Capital Markets Singapore Pte Limited is acting as an exempt financial advisor under section 23(1)(f) of the Financial Advisers Act(FAA) read with regulation 17(1)(d) of the Financial Advisors Regulations and is a
subsidiary of Motilal Oswal Securities Limited in India. This research is distributed in Singapore by Motilal Oswal Capital Markets Singapore Pte Limited and it is only directed in Singapore to accredited investors, as defined in the
Financial Advisers Regulations and the Securities and Futures Act (Chapter 289), as amended from time to time.
In respect of any matter arising from or in connection with the research you could contact the following representatives of Motilal Oswal Capital Markets Singapore Pte Limited:
Varun Kumar
Varun.kumar@motilaloswal.com
Contact : (+65) 68189232
Office Address:21 (Suite 31),16 Collyer Quay,Singapore 04931
Kadambari Balachandran
kadambari.balachandran@motilaloswal.com
(+65) 68189233 / 65249115
Motilal Oswal Securities Ltd
26 October 2016
Motilal Oswal Tower, Level 9, Sayani Road, Prabhadevi, Mumbai 400 025
Phone: +91 22 3982 5500 E-mail: reports@motilaloswal.com
8