TVS Motor Company
BSE SENSEX
27,916
Bloomberg
Equity Shares (m)
M.Cap.(INRb)/(USDb)
52-Week Range (INR)
1, 6, 12 Rel. Per (%)
Avg Val, INR m
Free float (%)
S&P CNX
8,615
TVSL IN
475.1
195.5 / 2.9
341/201
-8/-14/16
548
42.6
27 October 2016
2QFY17 Results Update | Sector: Automobiles
CMP: INR411
TP: INR492 (+20%)
Buy
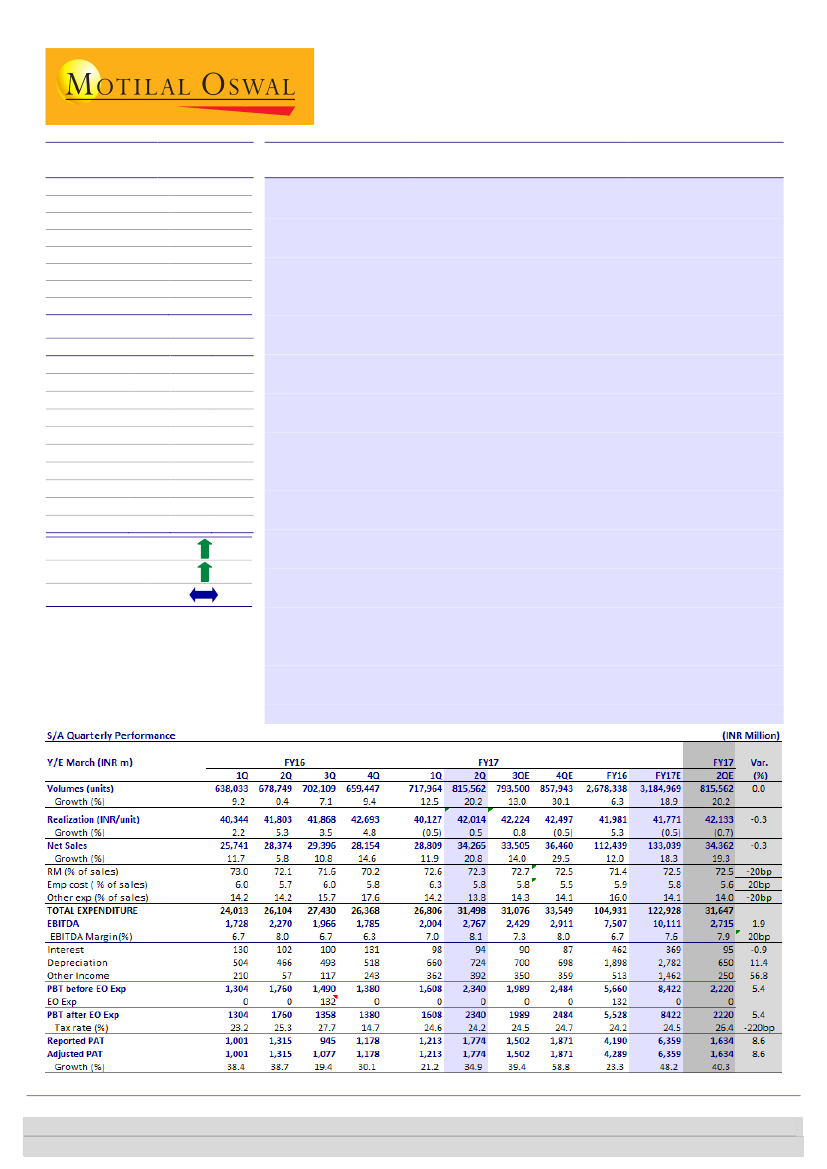
In-line; Margin improvement continues; Strong EPS growth to continue
Strong volume growth drives sales…:
Total volumes grew 20% YoY (+14% QoQ)
to 816k units, driven by ~30% YoY growth (+17% QoQ) in motorcycles and
moped segment growth of ~35% YoY (+5% QoQ). This is despite muted growth
in scooters at ~6% YoY (+17% QoQ) and decline in exports of ~12% YoY.
Realizations grew 4.7% QoQ to ~INR42k driven by better mix. Net sales grew
21% YoY (+19% QoQ) to INR34.3b.
EBITDA margins continue to rise as operating leverage benefits kick-in:
EBITDA margin expanded by 110bp QoQ (+10bp YoY) to 8.1% (v/s est 7.9%),
driven by operating leverage benefits despite decline in higher margins export
business. Higher than expected other income boosted PAT to INR1.8b (v/s est
INR1.6b), a growth of ~35% YoY (+46% QoQ).
Earnings call highlights:
a) Management re-iterated its two year target of
market share (of 18%) and EBITDA margins (double digit), b) It is taking
initiatives to recovery back lost scooter market share, c) Product from BMW
alliance to be launched during early 2017, and d) Invested ~INR500m in equity
of captive finance company TVS Credit Services (as against earlier investment
routed through preference shares of SPV).
Valuation and view:
We have upgraded our estimates for FY17/18 by 6%/3%
respectively to factor in for stronger than estimated moped volumes and
better margins. We expect strong earnings momentum for TVSL over next 2-3
years led by a) ramp-up of Victor volumes and recovery in scooter market
share, b) benefit of monsoons and 7
th
Pay commission to aid sustained volume
growth in H2FY17, c) launch of BMW Alliance product in early 2017, d) recovery
in export markets as crude oil prices recover and e) resultant margin
improvement. The stock trades at 22.2x/17.5x FY18E/19E EPS. Maintain
Buy
with a target price of INR492 (~18x FY19E EPS + ~INR68/share for BMW
alliance).
Financials & Valuations (INR b)
Y/E Mar
2017E 2018E 2019E
Net Sales
133.0 158.5 185.8
EBITDA
10.1
13.4
16.6
PAT
6.4
8.8
11.2
EPS (INR)
13.4
18.5
23.6
Gr. (%)
47.1
38.6
27.1
BV/Sh (INR)
50.8
65.8
84.5
RoE (%)
29.2
31.8
31.4
RoCE (%)
30.2
34.8
35.9
P/E (x)
30.7
22.2
17.5
P/BV (x)
8.1
6.3
4.9
Estimate change
TP change
Rating change
Jinesh Gandhi
(Jinesh@MotilalOswal.com); +91 22 3982 5416
Venil Shah
(Venil.Shah@MotilalOswal.com); +91 22 3982 5445
/Aditya Vora
(Aditya.Vora@MotilalOswal.com); +91 22 3078 4701
Investors are advised to refer through important disclosures made at the last page of the Research Report.
Motilal Oswal research is available on www.motilaloswal.com/Institutional-Equities, Bloomberg, Thomson Reuters, Factset and S&P Capital.

TVS Motor Company
Net sales driven by volume growth; Lower moped share aids QoQ
realisations jump
Total volumes grew 20.2% YoY (+13.6% QoQ) to 816k units, driven by ~30% YoY
growth (+17% QoQ) in motorcycles even as scooters grew just 5.7% YoY (but
+17% QoQ). The moped segment grew ~35% YoY (+5% QoQ). 3W volumes (-38%
YoY) were lower due to a sharp slump in export volumes.
Overall Exports declined by ~12% YoY. 3W exports declined ~60% YoY and have
hit the hardest as key export markets have been hit by USD unavailability
leading to higher pricing for vehicles and reduced purchasing power.
Realizations increased 5% QoQ (+0.5% YoY) to ~INR42k (in-line with estimates)
led by decline in the share of the moped segment which declined 230 bp QoQ to
28.6%, while share of motorcycles increased +140bp QoQ to 40.7%.
As a result, Net sales grew ~21% YoY (+19% QoQ) to INR34b (in-line).
Exhibit 2: 3W volumes decline for 3rd consecutive quarter
Volume Growth (%)
30.3
5.3
34.9
Exhibit 1: Motorcycles/Mopeds drive volumes for Q2FY17
Volumes ('000 units)
Growth (%)
476 502 533 565 584 676 656 603 638 679 702 659 718 816
Motorcycles
Source: Company, MOSL
Scooters
Mopeds
(38.0)
Three-wheelers
Source: Company, MOSL
Exhibit 3: Market share (%) – Newly launched Victor and Apache push market share in
motorcycle segment; Competition in scooter segment intensifies
Motorcycles
20
15
10
5
0
Scooters
Overall
Source: Company, MOSL
27 October 2016
2

TVS Motor Company
Exhibit 4: Robust volumes drives revenues in 2QFY17
Net sales (INR b)
34.9
23.5
28.9
31.0
Growth (%)
20.8
Exhibit 5: Share of mopeds drops QoQ, but rises YoY
Motorcycles
Scooters
Mopeds
3Ws
16.1 14.4
(4.8)
13.8
11.7
5.8
10.8
14.6 11.9
38 38 41 28 32 34 45 31 29 29 31 29 26 26 29 31 29
25 24 23
26 29 28 28 26 32 33 30 27 28
25 22 19
20
35 38 37 43 39 39 31 39 38 38 36 40 38 37 37 39 41
Source: Company, MOSL
EBITDA margins in line at 8.1% driven by operating leverage benefits
Gross margins improved ~30bp QoQ to ~27.7% despite mild pressure on RM
price front.
EBITDA margin expansion by 110bp QoQ (+10bp YoY) to 8.1% (v/s est 7.9%) was
driven by operating leverage benefits as volumes jumped 13.6% QoQ. Employee
costs to sales declined 50 bp QoQ to 5.8%, while other expenses to sales
declined 40 bp QoQ to 13.8%.
Higher than expected other income negated higher depreciation costs and
thereby PAT grew 35% YoY to INR1.8b (v/s est INR1.6b).
Exhibit 7: Higher other income and lower tax rate offsets
higher depreciation drives PAT growth of 35% YoY
PAT
61.9
46.6
29.6
1.5
31.2
39.4
31.1
Growth (%)
38.4
38.7
19.4
6.2
30.1
34.9
21.2
Exhibit 6: EBITDA margins rise 90bps QoQ on strong
operating leverage benefits
EBITDA margin (%)
8.0
8.1
6.7
6.7 6.3 7.0
6.6
6.1
5.7 6.1 6.0
5.6 5.9 6.0
EBITDA (INR m)
Source: Company, MOSL
Other key highlight from the conference call
Management hopeful of robust growth in festive season:
Following strong
growth in Dussera, management is hopeful that Dhanteras volume growth
would also be strong.
Victor/Apache 200
volumes have done well post their pan-India launch in
1QFY17. Management clarified that there is no capacity constraint for ramping
up Apache volumes to meet demand. Management targets 23-24% market
share in this premium motorcycle segment.
As per the management
rural demand
has been impacted by unseasonal rains in
some states and some localized problems in some southern states. Rural
27 October 2016
3

TVS Motor Company
demand is likely to pick-up in H2FY17 as these problems recede and macro
factors improve.
Management targets 18% market share in 2W segment,
up from 13.8% YTD
FY17. Management also acknowledged the need to add more products in order
to gain market share (especially in the 125 cc executive segment)
BMW alliance:
Project is on track, with its first product (G310R) to be launched
during FY17 and not specifically during the festive season.
Inventory at dealers increased from 27-28 days to 31-32 days in 1QFY17.Retail
inventory is estimated to be marginally higher QoQ.
Management
maintained EBITDA margin target
of ~10% in next couple of years
Exports volumes continue to struggle, especially 3W volumes (- 60% in 2QFY17).
Management is hopeful of higher exports in H2FY17 as forex availability in key
export markets improves going forward, on crude oil prices recovery
Debt reduction: With strong cash flows of INR3.6b in H1, there has been a debt
reduction of ~INR3b. Management expects the company to turn debt-free in the
next 12-18 months.
Capex:
FY16 capex was at INR4.5b; the management has guided ~INR 4b in FY17
which includes brownfield expansion at its existing manufacturing plants.
It invested INR500m in its equity shares of TVS Credit Services Limited, a wholly
owned subsidiary of TVS Motor Services. This is a direct equity investment in
TVS Credit Services, as against earlier investment routed through preference
shares of TVS Motor Services. TVS Credit Services has a book of INR45b, with the
portfolio being split equally between a) Two Wheelers and b) Tractors and used
cars.
BMW Motorrad tie-up to give additional revenue stream, technological
edge
We believe this tie-up would give TVSL an additional revenue stream in the form
of contract manufacturing for BMW Motorrad. Moreover, it would give an
aspirational value to TVSL products, particularly premium ones.
TVSL would invest EUR20m over CY13-15, with the first product expected to be
launched in early 2017.
BMW showcased concept from TVS alliance in Brazil, receiving very good
response. We are yet to factor in for this alliance in our estimates, now factor in
for TVS-BMW alliance in our estimates.
Based on ~7.5% market share for BMW (BMW enjoys ~14% market share in
>650cc segment) in global market in 250-650cc segment (~1m units market
size), implies EPS contribution of ~INR4 per share.
We value this alliance at 18x FY19E EPS resulting in INR68 per share to our
target price.
27 October 2016
4

TVS Motor Company
Exhibit 8: BMW G310-R bike
Source: Company
Exhibit 9: Motorcycle industry volumes (>250 cc) in select global markets
Europe
USA
India
Brazil
Canada
Japan
Australia
Others
Size of (250cc-650cc) Motorcycle market
Size of (650cc and above) Motorcycle market
400-450k units
400-450k units
400k units
150k units
35k units
32k units
30k units
60k units
1mn Units
1mn Units
Source: MOSL
Exhibit 10: TVS-BMW alliance scenario analysis
Scenario - Potential Market Share (%)
Volumes global market (250-650cc) Units
BMW Alliance Volumes (Units)
Net Realization (INR)
Revenues in (INR m)
EBITDA Margins (%)
EBITDA (INR m)
Tax rate (%)
PAT (INR m)
Incremental contribution to EPS
EPS (Post JV)
Upside to FY18E EPS on account of JV (%)
5
1,000,000
50,000
238,645
11,932
9
1,074
25
805
1.7
25.0
7.3
10
1,000,000
75,000
238,645
23,865
10
2,386
25
1,802
3.8
27.4
16.1
14
1,000,000
140,000
238,645
33,410
11
3,675
25
2,756
5.8
29.1
24.9
17.5
1,000,000
175,000
238,645
41,763
12
5,012
25
3,759
7.9
31.2
34.0
Source: Company, MOSL
27 October 2016
5

TVS Motor Company
Valuation and view
Recent launches to plug the gap in product portfolio; becomes 3rd largest in
domestic 2Ws:
Successful launch of Jupiter and Star City Plus are driving
customers back to TVS brand, after long time. Market share in both the scooters
and motorcycles are on rising trend, with TVS now 3rd largest in domestic 2W.
With the newly launched Victor, we believe TVS will address the gap in its
existing portfolio (absence in the Executive 100 segment). Refreshed version of
Apache to strengthen its hold in the growing premium segment.
To regain lost market share in the scooter segment:
TVS’ scooter volumes have
grown 10.5% YoY even as the industry has grown 27% YoY, leading to ~200 bp
YoY drop in market share. Management also seemed confident of regaining back
the lost market share by putting appropriate measures to target the same. We
build a conservative 11.7% CAGR FY16-19E volume growth for TVS’ scooter
portfolio.
EBITDA margins to improve 250bp over FY16-19E with improving market
position and scale, expect:
TVSL has been generally aggressive in pricing the
products due to its weak brand equity. Improving competitive positioning
together with operating leverage (particularly on marketing and employee cost)
to drive 250bp margin expansion to 9.2% over FY16-19E.
BMW Motorrad tie-up to give additional revenue stream, technological edge:
Not factored in our estimates:
We believe this tie-up would give TVSL an
additional revenue stream in the form of contract manufacturing for BMW
Motorrad. Moreover, it would give an aspiration value to TVSL products,
particularly premium ones. TVSL would invest EUR20m over CY13-15, with the
first product expected to be launched in 2HFY17. We value this alliance at 18x
FY19E EPS resulting in INR67 per share to our target price.
Valuation and view (earnings momentum to remain strong):
We have
upgraded our estimates for FY17/18 by 6%/3% respectively to factor in for
stronger than estimated moped volumes and better margins. We expect strong
earnings momentum for TVSL over next 2-3 years led by a) ramp-up of Victor
volumes and recovery in scooter market share, b) benefit of monsoons and 7
th
Pay commission to aid sustained volume growth in H2FY17, c) launch of BMW
Alliance product in early 2017, d) recovery in export markets as crude oil prices
recover and e) resultant margin improvement. The stock trades at 22.2x/17.5x
FY18E/19E EPS. Maintain
Buy
with a target price of INR492 (~18x FY19E EPS +
~INR68/share for BMW alliance).
Exhibit 11: Revised Estimates(Standalone)
(INR M)
Volumes (mn units)
Net Sales
EBITDA
EBITDA (%)
Net Profit
EPS (INR)
Rev
3.19
133,039
10,111
7.6
6,359
13.4
FY17E
Old
3.15
131,790
9,950
7.6
6,030
12.7
Chg (%)
1.4
0.9
1.6
10bp
5.5
5.5
Rev
3.65
158,493
13,393
8.5
8,811
18.5
FY18E
Old
3.60
156,627
13,399
8.6
8,552
18.0
Chg (%)
1.5
1.2
0.0
-10bp
3.0
3.0
Source: Company, MOSL
27 October 2016
6

TVS Motor Company
Exhibit 12: Valuations trading above historical average,
reflecting improving fundamentals
40
32
24
16
8
0
12.7
16.5
14.5
25.1
P/E (x)
5 Yrs Avg(x)
15 Yrs Avg(x)
10 Yrs Avg(x)
10.0
8.0
6.0
4.0
2.0
0.0
P/B (x)
5 Yrs Avg(x)
15 Yrs Avg(x)
10 Yrs Avg(x)
6.9
3.7
2.5
2.1
Source: MOSL
Source: MOSL
Exhibit 13: Comparative valuation
CMP
(INR)*
Auto OEM's
Bajaj Auto
Hero MotoCorp
TVS Motor
M&M
Maruti Suzuki
Tata Motors
Ashok Leyland
Eicher Motors
Auto Ancillaries
Bharat Forge
Exide Industries
Amara Raja Batteries
BOSCH
2,764
3,315
411
1,301
5,860
522
85
24,532
857
191
998
22,278
Rating
TP
(INR)
P/E (x)
FY17E FY18E
19.4
17.5
30.6
18.3
22.1
11.7
15.7
38.9
31.0
22.2
29.9
43.8
15.0
14.9
22.2
13.6
18.2
9.4
11.4
28.3
22.9
18.4
23.3
31.4
EV/EBITDA (x)
FY17E FY18E
13.4
11.5
18.8
15.0
14.1
4.5
8.6
30.5
15.5
13.8
17.5
34.0
10.4
9.6
14.0
11.9
11.5
3.7
6.3
24.4
12.6
11.7
14.0
22.8
RoE (%)
FY17E FY18E
31.2
42.6
29.3
15.1
23.7
17.2
25.4
41.5
17.0
14.8
24.4
18.0
34.3
40.6
31.7
17.5
23.5
18.0
29.1
41.0
20.3
15.7
25.4
21.6
RoCE (%)
EPS CAGR (%)
FY17E FY18E
FY16E-18E
30.4
41.6
30.8
12.6
31.9
12.3
18.7
27.1
11.6
15.4
23.1
25.5
33.5
39.8
34.7
14.8
31.6
13.2
22.8
29.2
18.1
18.5
42.6
22.5
33.5
22.7
38.2
32.5
Buy
3,496
Neutral 3,764
Buy
486
Buy
1,693
Buy
6,865
Buy
655
Buy
97
Buy
28,807
Buy
1,137
Buy
250
Buy
1,251
Neutral 24,839
14.7
15.3
16.5
19.1
24.2
22.3
30.6
14.0
Source: Company, MOSL
27 October 2016
7

TVS Motor Company
Story in charts: Robust ~37% EPS CAGR over FY16-19E
Exhibit 14: Expect a 15% CAGR over FY16-19E
Volumes (units)
23.3
8.2
2.4
5.7
-7.5
FY12
FY13
FY14
FY15
FY16E FY17E FY18E FY19E
Source: Company, MOSL
FY13
FY14
FY15
FY16
FY17E
FY18E
FY19E
-1.1
18.9
Growth (%)
14.5
Exhibit 15: Strong 18% CAGR in revenues over FY16-18E
Net sales (INR m)
26.1
12.7
12.7
18.3
19.1
17.2
Growth (%)
12.0
Source: Company, MOSL
Exhibit 16: Operating leverage to drive margins
EBITDA (INR m)
6.7
EBITDA margin (%)
7.6
8.5
9.0
Exhibit 17: Higher PAT growth with improving margins
PAT (INR m)
44.0 33.4
24.2
(27.3)
Growth (%)
47.1
38.6
27.1
5.8
6.0
6.0
FY13
FY14
FY15
FY16
FY17E
FY18E
FY19E
FY13
FY14
FY15
FY16
FY17E
FY18E
FY19E
Source: Company, MOSL
Exhibit 18: FCF to remain strong despite high capex plans
CFO (INR m)
Capex (INR m)
14,262
5,184
3,3032,536
2,604
891
-767
FY13
-2,580
FY14
8,374
3,806
FCF (INR m)
14,588
12,072
10,588
10,262
8,072
Exhibit 19: Sharp improvement in return ratios
RoCE (%)
RoE (%)
29.2
19.7
15.1
15.7
FY13
20.3
21.9
23.3
22.7
24.1
34.8
35.9
31.8
31.4
30.2
-2,778
-3,669 -4,568
FY15
FY16
-4,000
FY17E
-4,000
FY18E
-4,000
FY19E
FY14
FY15
FY16
FY17E
FY18E
FY19E
Source: Company, MOSL
27 October 2016
8

TVS Motor Company
Key operating metrics
Exhibit 20: Snapshot of Revenue model
units
Motorcycle
Growth (%)
% of total vols
Scooter
Growth (%)
% of total vols
Moped
Growth (%)
% of total vols
Total 2Ws
Growth (%)
% of total vols
3Ws
Growth (%)
% of total vols
Domestic
Growth (%)
% of total vols
Exports
Growth (%)
% of total vols
Total volumes
Growth (%)
ASP (INR/unit)
Growth (%)
Net Sales (INR m)
Growth (%)
FY11
836,831
30.6
41.2
452,006
46.1
22.2
703,167
23.0
34.6
1,992,004
30.9
98.0
39,860
163.7
2.0
1,787,313
30.5
88.0
244,551
46.3
12.0
2,031,864
32.2
30,947
9.0
62,880
44.1
FY12
843,114
0.8
38.4
529,091
17.1
24.1
785,942
11.8
35.8
2,158,147
8.3
98.2
39,792
-0.2
1.8
1,910,226
6.9
86.9
287,713
17.6
13.1
2,197,939
8.2
32,492
5.0
71,415
13.6
FY13
749,429
-11.1
36.9
441,552
-16.5
21.7
792,069
0.8
39.0
1,983,050
-8.1
97.6
49,190
23.6
2.4
1,787,007
-6.5
87.9
245,233
-14.8
12.1
2,032,240
-7.5
34,765
7.0
70,650
-1.1
FY14
790,463
5.5
38.1
475,615
7.7
22.9
730,172
-7.8
35.2
1,996,250
0.7
96.1
80,842
64.3
3.9
1,762,073
-1.4
84.8
315,019
28.5
15.2
2,077,092
2.2
38,332
10.3
79,619
12.7
FY15
957,114
21.1
37.7
706,298
48.5
27.8
765,496
4.8
30.1
2,428,908
21.7
95.6
112,891
39.6
4.4
2,122,966
20.5
83.5
418,833
33.0
16.5
2,541,799
22.4
39,509
3.1
100,423
26.1
FY16
1,016,443
6.2
38.0
812,527
15.0
30.3
738,547
-3.5
27.6
2,567,517
5.7
95.9
110,821
-1.8
4.1
2,224,847
4.8
83.1
453,491
8.3
16.9
2,678,338
5.4
41,981
6.3
112,439
12.0
FY17E
1,311,751
29.1
41.2
870,809
7.2
27.3
924,475
25.2
29.0
3,107,035
21.0
97.6
77,934
-29.7
2.4
2,732,582
22.8
85.8
452,387
-0.2
14.2
3,184,969
18.9
41,771
-0.5
133,039
18.3
FY18E
1,550,698
18.2
42.5
985,729
13.2
27.0
1,017,477
10.1
27.9
3,553,903
14.4
97.5
91,415
17.3
2.5
3,130,484
14.6
85.9
514,834
13.8
14.1
3,645,318
14.5
43,479
4.1
158,493
19.1
FY19E
1,760,075
13.5
42.9
1,118,493
13.5
27.2
1,120,268
10.1
27.3
3,998,836
12.5
97.4
107,445
17.5
2.6
3,507,532
12.0
85.4
598,749
16.3
14.6
4,106,281
12.6
45,252
4.1
185,819
17.2
Source: Company, MOSL
27 October 2016
9

TVS Motor Company
Financials and valuations
Standalone - Income Statement
Y/E March
Volumes (units)
Growth (%)
Gross Revenues
Less: Excise Duty
Net Sales
Change (%)
Materials Consumed
% of Sales
Personnel Expenses
% of Sales
Selling & Distribution Expenses
% of Sales
General & Administrative Expenses
% of Sales
Total Expenditure
% of Sales
EBITDA
Margin (%)
Depreciation
EBIT
Int. and Finance Charges
PBT after EO Exp.
Tax Rate (%)
Reported PAT
PAT Adj for EO items
Change (%)
Net Profit
Adj EPS
FY13
2,044,000
(6.5)
77,329
6,679
70,650
-1.1
50,965
72.1
4,071
5.8
6,974
9.9
4,549
6.4
66,560
94.2
4,090
5.8
1,304
2,786
480
1,636
29.1
1,160
1,810
-27.3
1,810
3.8
FY14
2,073,000
1.4
86,521
6,902
79,619
12.7
56,728
71.3
4,761
6.0
8,421
10.6
4,927
6.2
74,838
94.0
4,781
6.0
1,317
3,465
254
3,525
25.8
2,616
2,607
44.0
2,607
5.5
FY15
2,518,000
21.5
107,580
7,156
100,423
26.1
72,971
72.7
5,924
5.9
9,071
9.0
6,391
6.4
94,357
94.0
6,066
6.0
1,533
4,533
274
4,562
23.7
3,478
3,478
33.4
3,478
7.3
FY16
2,678,702
6.4
122,321
9,883
112,439
12.0
80,255
71.4
6,642
5.9
11,186
9.9
6,849
6.1
104,931
93.3
7,507
6.7
1,898
5,609
462
5,660
23.6
4,321
4,321
24.2
4,321
9.1
FY17E
3,190,220
19.1
145,294
12,255
133,039
18.3
96,453
72.5
7,716
5.8
12,373
9.3
6,386
4.8
122,928
92.4
10,111
7.6
2,782
7,329
369
8,422
24.5
6,359
6,359
47.1
6,359
13.4
FY18E
3,651,612
14.5
172,903
14,410
158,493
19.1
114,353
72.2
8,876
5.6
14,581
9.2
7,291
4.6
145,100
91.6
13,393
8.5
3,028
10,364
298
11,748
25.0
8,811
8,811
38.6
8,811
18.5
(INR Million)
FY19E
4,113,827
12.7
202,490
16,671
185,819
17.2
134,068
72.2
10,034
5.4
16,724
9.0
8,362
4.5
169,188
91.1
16,631
9.0
3,348
13,282
287
14,929
25.0
11,197
11,197
27.1
11,197
23.6
Standalone - Balance Sheet
Y/E March
Equity Share Capital
Total Reserves
Preference Capital
Net Worth
Minority Interest
Deferred Liabilities
Total Loans
Capital Employed
Gross Block
Less: Accum. Deprn.
Net Fixed Assets
Capital WIP
Total Investments
Curr. Assets, Loans&Adv.
Inventory
Account Receivables
Cash and Bank Balance
Loans and Advances
Curr. Liability & Prov.
Account Payables
Provisions
Net Current Assets
Appl. of Funds
E: MOSL Estimates
FY13
475
11,772
0
12,247
0
931
6,345
19,523
22,479
12,365
10,115
361
8,688
12,029
5,097
3,005
175
3,752
11,670
11,136
534
359
19,523
0.0
FY14
475
13,678
0
14,153
0
1,247
4,424
19,824
24,723
13,466
11,257
481
8,959
14,950
5,482
3,341
826
5,302
15,823
14,612
1,211
-873
19,824
0.0
FY15
475
15,979
0
16,454
0
1,528
9,187
27,170
28,218
14,922
13,296
894
10,125
21,732
8,197
5,039
54
8,443
18,878
17,390
1,488
2,854
27,169
-1.0
FY16
475
18,893
0
19,368
0
1,757
7,585
28,710
31,996
16,067
15,929
310
11,846
21,542
8,260
5,787
328
7,167
20,916
19,932
985
626
28,709
-1.0
FY17E
475
23,681
0
24,156
0
1,757
7,185
33,098
35,856
18,849
17,006
450
13,346
31,350
9,773
6,847
6,751
7,979
29,055
23,575
5,479
2,296
33,098
0.0
FY18E
475
30,779
0
31,254
0
1,757
6,685
39,695
39,856
21,878
17,978
450
14,596
40,229
11,643
8,157
11,062
9,367
33,557
28,078
5,479
6,672
39,695
0.0
(INR Million)
FY19E
475
39,691
0
40,166
0
1,757
6,685
48,607
43,856
25,226
18,629
450
14,596
53,249
13,650
9,564
19,078
10,958
38,317
32,837
5,479
14,932
48,607
0.0
27 October 2016
10

TVS Motor Company
Financials and valuations
Ratios
Y/E March
Basic (INR)
EPS
Growth (%)
Cash EPS
BV/Share
DPS
Payout (%)
Valuation (x)
P/E
Cash P/E
P/BV
EV/Sales
EV/EBITDA
Dividend Yield (%)
Return Ratios (%)
EBITDA Margins (%)
Net Profit Margins (%)
RoE
RoCE
RoIC
Operating Ratios
Fixed Asset Turnover (x)
Inventory (Days)
Debtor (Days)
Creditor (Days)
Working Capital (Days)
Leverage Ratio (x)
Current Ratio
Interest Cover Ratio
Debt/Equity
FY13
3.8
-27.3
6.6
25.8
1.2
56.5
108.0
62.8
16.0
2.9
49.3
0.3
5.8
2.6
15.1
15.7
14.7
FY14
5.5
44.0
8.3
29.8
1.4
29.6
75.0
49.8
13.8
2.5
41.6
0.3
6.0
3.3
19.7
20.3
23.0
FY15
7.3
33.4
10.5
34.6
2.0
34.0
56.2
39.0
11.9
2.0
33.7
0.5
6.0
3.5
22.7
21.9
24.0
3.6
29.8
17
63
10
FY16
9.1
24.2
13.1
40.8
2.7
33.7
45.2
31.4
10.1
1.8
27.0
0.6
6.7
3.8
24.1
23.3
23.4
3.5
26.8
17
65
1
FY17E
13.4
47.1
19.2
50.8
2.8
24.7
30.7
21.4
8.1
1.5
19.4
0.7
7.6
4.8
29.2
30.2
35.6
3.7
26.8
17
65
-12
FY18E
18.5
38.6
24.9
65.8
3.0
19.4
22.2
16.5
6.3
1.2
14.3
0.7
8.5
5.6
31.8
34.8
55.8
4.0
26.8
17
65
-10
FY19E
23.6
27.1
30.6
84.5
4.0
20.4
17.5
13.4
4.9
1.0
11.0
1.0
9.0
6.0
31.4
35.9
67.3
4.2
26.8
17
65
-8
3
26.3
14
58
1
3.2
25.1
14
67
-8
1.0
6
0.5
0.9
14
0.3
1.2
17
0.6
1.0
12
0.4
1.1
20
0.3
1.2
35
0.2
1.4
46
0.2
Standalone - Cash Flow Statement
Y/E March
CF from Operating incl EO
(inc)/dec in FA
Free Cash Flow
CF from Investments
(Inc)/Dec in Debt
Interest Paid
Dividend Paid
CF from Fin. Activity
Inc/Dec of Cash
Add: Beginning Balance
Closing Balance
FY13
4,181
-767
3,414
-985
-276
-517
-715
-3,152
45
130
175
FY14
5,238
-2,580
2,658
-2,598
-1,069
-230
-690
-1,988
651
175
826
FY15
846
-3,669
-2,823
-4,933
4,429
-285
-831
3,308
-778
832
54
FY16
8,457
-4,568
3,889
-5,195
-461
-461
-2,065
-3,006
255
29
284
FY17E
12,800
-4,000
8,800
-4,038
-400
-369
-1,570
-2,340
6,423
284
6,707
FY18E
10,390
-4,000
6,390
-3,568
-500
-298
-1,713
-2,511
4,310
6,707
11,017
(INR Million)
FY19E
12,654
-4,000
8,654
-2,066
0
-287
-2,284
-2,572
8,016
11,017
19,033
27 October 2016
11

TVS Motor Company
Corporate profile
Company description
TVS Motor Company is 4
th
largest two-wheeler
company in India. TVS Motor Company is the
flagship company of the 100 year old six billion USD
TVS Group, which has some 40 companies and
holdings in the automotive sector. TVS Motor
Company offers the widest range of product in the
Indian two and three wheeler industry. TVS Motor
Company has international presence in more than
50 countries in Asia, Africa and Latin America.
Exhibit 1: Sensex rebased
Source: MOSL/Bloomberg
Exhibit 2: Shareholding pattern (%)
Sep-16
Promoter
DII
FII
Others
57.4
13.5
16.7
12.4
Jun-16
57.4
14.5
15.3
12.8
Sep-15
57.4
16.1
13.0
13.5
Source: Capitaline
Exhibit 3: Top holders
Holder Name
Reliance Capital Trustee Co Ltd
Jwalamukhi Investment Holdings
Franklin Templeton Mutual Fund
Tree Line Asia Master Fund (Singapore) PTE
Columbia Acorn International
% Holding
5.4
4.4
3.4
1.5
1.4
Source: Capitaline
Note: FII Includes depository receipts
Exhibit 4: Top management
Name
Venu Srinivasan
Sudarshan Venu
K S Srinivasan
Designation
Chairman & Managing Director
Joint Managing Director
Company Secretary
Exhibit 5: Directors
Name
C R Dua
Hemant Krishan Singh
Prince Asirvatham
T Kannan
Name
H Lakshmanan
Lakshmi Venu
R Ramakrishnan
Source: Capitaline
*Independent
Exhibit 6: Auditors
Name
A N Raman
V Sankar Aiyar & Co
Type
Cost Auditor
Statutory
Exhibit 7: MOSL forecast v/s consensus
EPS
(INR)
FY17
FY18
MOSL
forecast
13.4
18.5
Consensus
forecast
12.5
16.6
Variation (%)
7.2
11.2
Source: Bloomberg
Source: Capitaline
27 October 2016
12

TVS Motor Company
NOTES
27 October 2016
13

Disclosures
This document has been prepared by Motilal Oswal Securities Limited (hereinafter referred to as Most) to provide information about the company (ies) and/sector(s), if any, covered in the report and may be distributed by it and/or its affiliated
company(ies). This report is for personal information of the selected recipient/s and does not construe to be any investment, legal or taxation advice to you. This research report does not constitute an offer, invitation or inducement to invest in securities
or other investments and Motilal Oswal Securities Limited (hereinafter referred as MOSt) is not soliciting any action based upon it. This report is not for public distribution and has been furnished to you solely for your general information and should not
be reproduced or redistributed to any other person in any form. This report does not constitute a personal recommendation or take into account the particular investment objectives, financial situations, or needs of individual clients. Before acting on any
advice or recommendation in this material, investors should consider whether it is suitable for their particular circumstances and, if necessary, seek professional advice. The price and value of the investments referred to in this material and the income
from them may go down as well as up, and investors may realize losses on any investments. Past performance is not a guide for future performance, future returns are not guaranteed and a loss of original capital may occur.
MOSt and its affiliates are a full-service, integrated investment banking, investment management, brokerage and financing group. We and our affiliates have investment banking and other business relationships with a some companies covered by our
Research Department. Our research professionals may provide input into our investment banking and other business selection processes. Investors should assume that MOSt and/or its affiliates are seeking or will seek investment banking or other
business from the company or companies that are the subject of this material and that the research professionals who were involved in preparing this material may educate investors on investments in such business . The research professionals
responsible for the preparation of this document may interact with trading desk personnel, sales personnel and other parties for the purpose of gathering, applying and interpreting information. Our research professionals are paid on twin parameters of
performance & profitability of MOSt.
MOSt generally prohibits its analysts, persons reporting to analysts, and members of their households from maintaining a financial interest in the securities or derivatives of any companies that the analysts cover. Additionally, MOSt generally prohibits
its analysts and persons reporting to analysts from serving as an officer, director, or advisory board member of any companies that the analysts cover. Our salespeople, traders, and other professionals or affiliates may provide oral or written market
commentary or trading strategies to our clients that reflect opinions that are contrary to the opinions expressed herein, and our proprietary trading and investing businesses may make investment decisions that are inconsistent with the
recommendations expressed herein. In reviewing these materials, you should be aware that any or all of the foregoing among other things, may give rise to real or potential conflicts of interest. MOSt and its affiliated company(ies), their directors and
employees and their relatives may; (a) from time to time, have a long or short position in, act as principal in, and buy or sell the securities or derivatives thereof of companies mentioned herein. (b) be engaged in any other transaction involving such
securities and earn brokerage or other compensation or act as a market maker in the financial instruments of the company(ies) discussed herein or act as an advisor or lender/borrower to such company(ies) or may have any other potential conflict of
interests with respect to any recommendation and other related information and opinions.; however the same shall have no bearing whatsoever on the specific recommendations made by the analyst(s), as the recommendations made by the analyst(s)
are completely independent of the views of the affiliates of MOSt even though there might exist an inherent conflict of interest in some of the stocks mentioned in the research report
Reports based on technical and derivative analysis center on studying charts company's price movement, outstanding positions and trading volume, as opposed to focusing on a company's fundamentals and, as such, may not match with a report on a
company's fundamental analysis. In addition MOST has different business segments / Divisions with independent research separated by Chinese walls catering to different set of customers having various objectives, risk profiles, investment horizon,
etc, and therefore may at times have different contrary views on stocks sectors and markets.
Unauthorized disclosure, use, dissemination or copying (either whole or partial) of this information, is prohibited. The person accessing this information specifically agrees to exempt MOSt or any of its affiliates or employees from, any and all
responsibility/liability arising from such misuse and agrees not to hold MOSt or any of its affiliates or employees responsible for any such misuse and further agrees to hold MOSt or any of its affiliates or employees free and harmless from all losses,
costs, damages, expenses that may be suffered by the person accessing this information due to any errors and delays. The information contained herein is based on publicly available data or other sources believed to be reliable. Any statements
contained in this report attributed to a third party represent MOSt’s interpretation of the data, information and/or opinions provided by that third party either publicly or through a subscription service, and such use and interpretation have not been
reviewed by the third party. This Report is not intended to be a complete statement or summary of the securities, markets or developments referred to in the document. While we would endeavor to update the information herein on reasonable basis,
MOSt and/or its affiliates are under no obligation to update the information. Also there may be regulatory, compliance, or other reasons that may prevent MOSt and/or its affiliates from doing so. MOSt or any of its affiliates or employees shall not be in
any way responsible and liable for any loss or damage that may arise to any person from any inadvertent error in the information contained in this report. MOSt or any of its affiliates or employees do not provide, at any time, any express or implied
warranty of any kind, regarding any matter pertaining to this report, including without limitation the implied warranties of merchantability, fitness for a particular purpose, and non-infringement. The recipients of this report should rely on their own
investigations.
This report is intended for distribution to institutional investors. Recipients who are not institutional investors should seek advice of their independent financial advisor prior to taking any investment decision based on this report or for any necessary
explanation of its contents.
Most and it’s associates may have managed or co-managed public offering of securities, may have received compensation for investment banking or merchant banking or brokerage services, may have received any compensation for products or
services other than investment banking or merchant banking or brokerage services from the subject company in the past 12 months.
Most and it’s associates have not received any compensation or other benefits from the subject company or third party in connection with the research report.
Subject Company may have been a client of Most or its associates during twelve months preceding the date of distribution of the research report
MOSt and/or its affiliates and/or employees may have interests/positions, financial or otherwise of over 1 % at the end of the month immediately preceding the date of publication of the research in the securities mentioned in this report. To enhance
transparency, MOSt has incorporated a Disclosure of Interest Statement in this document. This should, however, not be treated as endorsement of the views expressed in the report.
Motilal Oswal Securities Limited is registered as a Research Analyst under SEBI (Research Analyst) Regulations, 2014. SEBI Reg. No. INH000000412
Pending Regulatory inspections against Motilal Oswal Securities Limited:
SEBI pursuant to a complaint from client Shri C.R. Mohanraj alleging unauthorized trading, issued a letter dated 29th April 2014 to MOSL notifying appointment of an Adjudicating Officer as per SEBI regulations to hold inquiry and adjudge violation of
SEBI Regulations; MOSL replied to the Show Cause Notice whereby SEBI granted us an opportunity of Inspection of Documents. Since all the documents requested by us were not covered we have requested to SEBI vide our letter dated June 23,
2015 to provide pending list of documents for inspection.
List of associate companies of Motilal Oswal Securities Limited -Click
here to access detailed report
Analyst Certification
The views expressed in this research report accurately reflect the personal views of the analyst(s) about the subject securities or issues, and no part of the compensation of the research analyst(s) was, is, or will be directly or indirectly related to the
specific recommendations and views expressed by research analyst(s) in this report. The research analysts, strategists, or research associates principally responsible for preparation of MOSt research receive compensation based upon various factors,
including quality of research, investor client feedback, stock picking, competitive factors and firm revenues
Disclosure of Interest Statement
TVS Motor Company
Analyst ownership of the stock
No
Served as an officer, director or employee -
No
A graph of daily closing prices of securities is available at www.nseindia.com and http://economictimes.indiatimes.com/markets/stocks/stock-quotes
TVS Motor Company
Regional Disclosures (outside India)
This report is not directed or intended for distribution to or use by any person or entity resident in a state, country or any jurisdiction, where such distribution, publication, availability or use would be contrary to law, regulation or which would subject
MOSt & its group companies to registration or licensing requirements within such jurisdictions.
For Hong Kong:
This report is distributed in Hong Kong by Motilal Oswal capital Markets (Hong Kong) Private Limited, a licensed corporation (CE AYY-301) licensed and regulated by the Hong Kong Securities and Futures Commission (SFC) pursuant
to the Securities and Futures Ordinance (Chapter 571 of the Laws of Hong Kong) “SFO”. As per SEBI (Research Analyst Regulations) 2014 Motilal Oswal Securities (SEBI Reg No. INH000000412) has an agreement with Motilal Oswal capital Markets
(Hong Kong) Private Limited for distribution of research report in Kong Kong. This report is intended for distribution only to “Professional Investors” as defined in Part I of Schedule 1 to SFO. Any investment or investment activity to which this document
relates is only available to professional investor and will be engaged only with professional investors.” Nothing here is an offer or solicitation of these securities, products and services in any jurisdiction where their offer or sale is not qualified or exempt
from registration. The Indian Analyst(s) who compile this report is/are not located in Hong Kong & are not conducting Research Analysis in Hong Kong.
For U.S.
Motilal Oswal Securities Limited (MOSL) is not a registered broker - dealer under the U.S. Securities Exchange Act of 1934, as amended (the"1934 act") and under applicable state laws in the United States. In addition MOSL is not a registered
investment adviser under the U.S. Investment Advisers Act of 1940, as amended (the "Advisers Act" and together with the 1934 Act, the "Acts), and under applicable state laws in the United States. Accordingly, in the absence of specific exemption
under the Acts, any brokerage and investment services provided by MOSL, including the products and services described herein are not available to or intended for U.S. persons.
This report is intended for distribution only to "Major Institutional Investors" as defined by Rule 15a-6(b)(4) of the Exchange Act and interpretations thereof by SEC (henceforth referred to as "major institutional investors"). This document must not be
acted on or relied on by persons who are not major institutional investors. Any investment or investment activity to which this document relates is only available to major institutional investors and will be engaged in only with major institutional investors.
In reliance on the exemption from registration provided by Rule 15a-6 of the U.S. Securities Exchange Act of 1934, as amended (the "Exchange Act") and interpretations thereof by the U.S. Securities and Exchange Commission ("SEC") in order to
conduct business with Institutional Investors based in the U.S., MOSL has entered into a chaperoning agreement with a U.S. registered broker-dealer, Motilal Oswal Securities International Private Limited. ("MOSIPL"). Any business interaction pursuant
to this report will have to be executed within the provisions of this chaperoning agreement.
The Research Analysts contributing to the report may not be registered /qualified as research analyst with FINRA. Such research analyst may not be associated persons of the U.S. registered broker-dealer, MOSIPL, and therefore, may not be subject to
NASD rule 2711 and NYSE Rule 472 restrictions on communication with a subject company, public appearances and trading securities held by a research analyst account.
For Singapore
Motilal Oswal Capital Markets Singapore Pte Limited is acting as an exempt financial advisor under section 23(1)(f) of the Financial Advisers Act(FAA) read with regulation 17(1)(d) of the Financial Advisors Regulations and is a subsidiary of Motilal
Oswal Securities Limited in India. This research is distributed in Singapore by Motilal Oswal Capital Markets Singapore Pte Limited and it is only directed in Singapore to accredited investors, as defined in the Financial Advisers Regulations and the
Securities and Futures Act (Chapter 289), as amended from time to time.
In respect of any matter arising from or in connection with the research you could contact the following representatives of Motilal Oswal Capital Markets Singapore Pte Limited:
Varun Kumar
Varun.kumar@motilaloswal.com
Contact : (+65) 68189232
Office Address:21 (Suite 31),16 Collyer Quay,Singapore 04931
Kadambari Balachandran
kadambari.balachandran@motilaloswal.com
(+65) 68189233 / 65249115
Motilal Oswal Securities Ltd
Motilal Oswal Tower, Level 9, Sayani Road, Prabhadevi, Mumbai 400 025
Phone: +91 22 3982 5500 E-mail: reports@motilaloswal.com
27 October 2016
14