28 October 2016
Q3CY16 Results Update | Sector: Consumer
Nestle India
Neutral
BSE SENSEX
27,942
Bloomberg
Equity Shares (m)
M.Cap.(INRb)/(USDb)
52-Week Range (INR)
1, 6, 12 Rel. Per (%)
Avg Val, INRm
Free float (%)
S&P CNX
8,638
NEST IN
96.4
671.1 / 10.0
7390/4990
8/12/7
270
37.2
CMP: INR6,961 TP: INR7,410 (+6%)
Sales better than anticipated; expect gradual recovery ahead
Financials & Valuations (INR b)
Y/E Dec
2015 2016E 2017E
Net Sales
81.2
92.6 110.0
EBITDA
15.9
18.8
23.4
PAT
11.6
11.8
14.8
EPS (INR)
119.9 122.3 153.9
Gr. (%)
-7.3
2.0
25.8
BV/Sh (INR)
292.3 340.0 406.7
RoE (%)
40.9
38.7
41.2
RoCE (%)
40.7
38.7
41.2
P/E (x)
58.1
56.9
45.2
P/BV (x)
23.8
20.5
17.1
Estimate change
TP change
Rating change
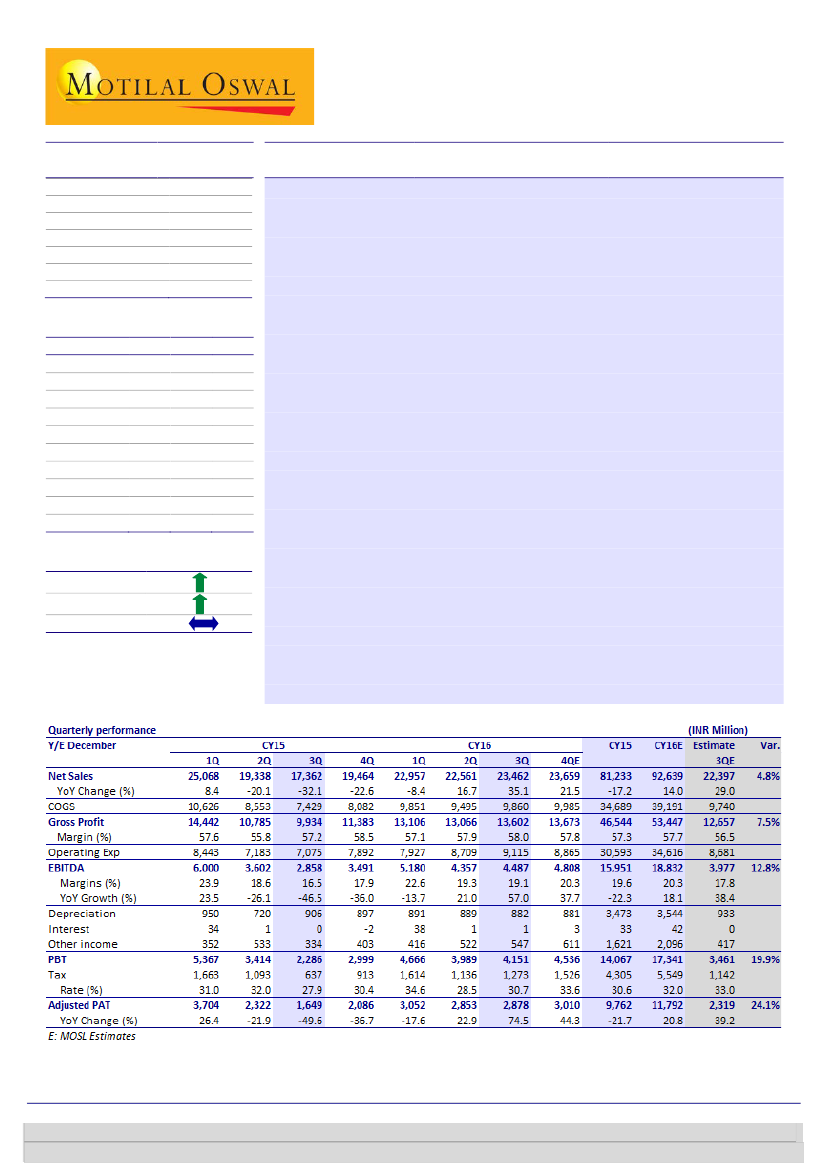
Nestle India’s (NEST) 3QCY16 operating performance better than
expectations:
Net sales were up 35.1% YoY (+4% QoQ) to INR23.5b (est. of
INR22.4b), primarily as the base quarter had sales write-backs and no Maggi
sales. The 25 new products and variants launched over past few months will
gradually help the company to gain some traction. Adj. PAT before
contingencies grew 74.5% YoY to INR2.88b (est. of INR2.32b) over a very weak
base quarter. Sequential EBITDA/PAT growth was 3%/1%.
EBITDA margin expanded 260bp YoY
(est. of +120bp), led by 80bp YoY
improvement in gross margin and 190bp savings on staff costs. EBITDA rose
57% YoY to INR4.49b (est. of INR4b).
9MCY16 results:
9MCY16 sales, EBITDA and PAT growth was muted at 11.7%,
12.6% and 14.4% YoY, respectively, despite absence of Maggi sales for nearly
half of the corresponding period last year, sales write-offs, and logistics and
incineration-related costs on Maggi in the base period.
Valuation and view:
We are encouraged by the much-needed strategic
changes made by the new CEO over the past year. The 25 new launches
(variants of existing products, some premium products and some interesting
new categories) too offer comfort. However, it is still early to gauge the
response to these new products. Based on sequential sales growth and data
presented in the analyst meet two months ago, there is no sign that the
absence of volume growth across categories for the past few years is
undergoing a change for the better. There is also no discernable hint of any
significant change in the overt premiumization strategy that had held back
volume growth for many years. While we raise our EPS forecast by ~8% on
good results, valuations are fair at 39.4x September 2018 EPS. Maintain
Neutral
with a target price of 7,410 (42x September 2018 EPS).
Investors are advised to refer through important disclosures made at the last page of the Research Report.
Motilal Oswal research is available on www.motilaloswal.com/Institutional-Equities, Bloomberg, Thomson Reuters, Factset and S&P Capital.
Krishnan Sambamoorthy
(Krishnan.Sambamoorthy@MotilalOswal.com); +91 22 3982 5428
Vishal Punmiya
(Vishal.Punmiya@MotilalOswal.com); +91 22 3980 4261

Nestle India
Key quarterly charts
Exhibit 1: Domestic sales grew 37.9% YoY in 3QCY16 on a
base of 33.8% de-growth in 3QCY15
Domestic Sales (INR b)
Sales Growth (%)
37.9
13.7 9.6
7.7 9.2 8.0 3.7 3.4 9.7 9.911.37.6
7.6
17.5
Exhibit 2: Exports grew 5.1% YoY on a base of 6.4% de-
growth
Exports Growth (%)
(8.7)
(20.6) (24.0)
(33.8)
Source: Company, MOSL
Exhibit 3: Reported gross margins expanded 80bp YoY
Gross Margins (%)
Exhibit 4: ..while reported EBITDA margin expanded 270bp
YoY led by lower staff costs coupled with gross margin
expansion
EBITDA Margin (%)
Source: Company, MOSL
Valuation and view
We are encouraged by much needed strategic changes led by the new CEO over the
past year. Spate of 25 new launches in the form of variants of existing products,
some premium products and some interesting new categories has been impressive.
However it is still early to gauge the response to these new products.
Based on sequential sales growth and data presented in the analyst meet two
months ago, there is no sign that the absence of volume growth across categories
for the past few years is undergoing a change for the better. There is also no
discernable hint of any significant change in the overt premiumization strategy that
had held back volume growth for many years.
While we have raised EPS forecasts by ~8% on good 3QCY16 results, valuations are
fair at 39.4x September 2018 EPS. Maintain Neutral rating with target price of 7,410
(42x September 2018 EPS).
28 October 2016
2

Nestle India
Exhibit 5: Raised estimates upwards by 8% to factor in sales and margin beat
New
INR M
Net Sales
EBITDA
Adjusted PAT
2016E
92,639
18,832
11,792
2017E
109,956
23,436
14,840
2016E
92,140
18,204
10,918
Old
2017E
109,317
22,610
13,701
% Change
2016E
2017E
0.5%
3.4%
8.0%
0.6%
3.7%
8.3%
Source: Company, MOSL
Exhibit 6: Nestle P/E (x)
73.0
58.0
43.0
28.0
13.0
36.2
19.4
PE (x)
Peak(x)
Avg(x)
59.6
50.4
Min(x)
Exhibit 7: Nestle P/E premium vs. Sensex
Nestle PE Relative to Sensex PE (%)
240
180
120
60
0
-60
115.5
LPA (%)
197.0
Source: Company, MOSL
Exhibit 8: Valuation Matrix of coverage universe
Company Reco
Price
Mkt Cap EPS Growth YoY (%)
(INR)
(USD M) FY16 FY17E FY18E
Consumer
Asian Paints Neutral
Britannia
Buy
Colgate
Buy
Dabur
Neutral
Emami
Buy
Godrej
Neutral
GSK
Neutral
HUL
Neutral
ITC
Buy
Jyothy Labs Neutral
Marico
Neutral
Nestle
Neutral
Page
Buy
Parag Milk Neutral
Pidilite Inds. Buy
P&G Hygiene Buy
Radico
Neutral
United Brew. Buy
United Spirits Buy
Retail
Jubilant
Neutral
Shopper's
Neutral
Titan
Neutral
1,070
3,306
973
291
1,209
1,606
6,051
838
243
357
282
6,961
16,397
312
719
7,032
141
869
2,253
1,000
368
374
15,360
5,935
3,960
7,669
4,105
8,184
3,809
27,140
43,817
966
5,445
10,044
2,737
393
5,514
3,416
280
3,438
4,899
984
453
4,975
26.3
46.3
8.7
17.2
17.7
24.4
20.4
12.9
-3.5
-41.6
26.1
-7.3
18.7
-66.7
47.3
22.3
3.9
13.6
LP
-11.7
19.3
-13.4
16.0
12.5
1.3
6.6
3.8
22.9
4.8
6.9
16.5
102.3
12.9
2.0
28.2
38.2
23.7
9.5
-7.2
30.1
105.7
-1.4
48.9
11.4
18.8
25.0
31.3
18.5
26.8
25.8
10.0
12.7
16.9
16.2
23.7
25.8
37.0
37.9
18.2
21.6
29.7
26.3
50.8
67.3
30.9
21.0
P/E (x)
FY16 FY17E FY18E
57.1
47.2
43.5
40.9
48.0
48.4
36.2
44.0
31.4
86.9
50.3
58.1
78.6
46.5
48.7
54.0
20.5
77.9
134.7
66.8
63.1
46.6
49.2
42.0
43.0
38.4
46.2
39.4
34.6
41.2
27.0
43.0
44.6
56.9
61.3
33.6
39.4
49.3
22.1
59.9
65.5
67.8
42.4
41.8
41.5
33.6
32.7
32.4
36.5
31.3
31.4
36.5
23.1
37.0
36.0
45.2
44.8
24.4
33.3
40.5
17.0
47.4
43.4
40.5
32.4
34.6
EV/EBITDA (x)
RoE (%) Div.
FY16 FY17E FY18E FY16
FY16
36.3
33.7
27.6
32.8
40.9
35.8
24.1
30.7
19.9
31.1
34.6
41.0
48.7
17.4
29.7
35.9
12.9
31.9
41.9
24.5
15.1
38.5
31.4
29.8
25.8
30.8
34.4
30.1
24.7
28.8
17.9
24.8
31.1
34.4
39.3
16.0
25.5
31.8
12.8
27.2
33.7
22.8
12.5
31.7
26.6
23.3
19.9
25.8
28.6
24.8
21.8
25.6
15.1
21.3
25.2
27.2
29.1
12.7
21.4
25.5
10.8
22.5
25.5
15.9
10.3
25.9
34.7
55.9
67.9
33.3
43.4
23.4
30.8
82.4
29.3
9.1
36.9
40.9
46.0
19.5
29.9
30.9
10.2
14.9
19.8
13.4
6.3
21.3
0.8
0.6
1.1
0.7
0.7
0.6
0.9
1.9
2.8
1.1
1.2
0.7
0.5
0.0
0.6
0.6
0.5
0.1
0.0
0.2
0.0
0.6
Note: For Nestle FY16 means CY15
Source: Company, MOSL
28 October 2016
3

Nestle India
Story in chart
Exhibit 9: Sales declined 17% in CY15 due to Maggi issue
Price Growth (%)
Sales Growth (%)
23.922.6
22.120.3
16.8
14.5
11.8 9.3
11.411.4
11.4
8.0
6.6
4.1
(16.8)
19.5
Exhibit 10: EBITDA margin declined YoY in CY15
Gross Margin (%)
EBITDA Margin (%)
56.9
53.0
51.8
51.8 51.2 52.1
51.0
20.5 20.2
20.1 20.2
21.0
54.3
54.3 53.6
22.3 22.2
21.3
20.1
CY06 CY07 CY08 CY09 CY10 CY11 CY12 CY13 CY14 CY15
Source: Company, MOSL
Exhibit 11: Rising volume contribution of Prepared Dishes
(%)
Milk Products/ Nutrition
Prepared Dishes
12.4
43.6
6.5
37.6
CY09
12.8
46.3
6.3
34.6
CY10
11.8
49.1
6.0
33.2
CY11
10.6
52.6
5.6
31.2
CY12
Beverages
Chocolate & Conf.
10.2
53.5
6.0
30.3
CY13
9.0
55.8
5.4
29.7
CY14
11.4
35.5
7.6
45.5
CY15
Exhibit 12: Milk Products contribution to revenues improved
in CY14 (%)
Milk Products/ Nutrition
Prepared Dishes
14.8
25.6
15.4
44.3
CY09
15.3
27.1
14.1
43.5
CY10
14.3
28.1
13.9
43.7
CY11
13.6
28.3
13.1
45.0
CY12
Beverages
Chocolate & Conf.
13.7
28.8
14.1
43.4
CY13
12.4
29.2
13.2
45.2
CY14
13.2
15.6
15.8
55.4
CY15
Source: Company, MOSL
Exhibit 13: Milk Products grew just 2% in CY15
Volume Growth (%)
Sales Growth (%)
22.6 23.0
9.4
19.2 20.1 20.7
Price Growth (%)
Exhibit 14: Prepared Dishes slowed down in CY15
Volume Growth (%)
Sales Growth (%)
40.0
19.2
30.6
34.7
26.9 29.2 24.9
Price Growth (%)
30.0
20.0
10.0
0.0
-10.0
15.2
5.5
12.4
2.1
20.0
-
(20.0)
(40.0)
(60.0)
12.8 11.0 9.7
(55.6)
CY06 CY07 CY08 CY09 CY10 CY11 CY12 CY13 CY14 CY15
Source: Company, MOSL
CY06 CY07 CY08 CY09 CY10 CY11 CY12 CY13 CY14 CY15
Source: Company, MOSL
28 October 2016
4

Nestle India
Financials and valuations
Income Statement
Y/E December
Net Sales
Change (%)
Total Expenditure
EBITDA
Change (%)
Margin (%)
Depreciation
Int. and Fin. Ch.
Other Inc.- Rec.
PBT
Change (%)
Margin (%)
Tax
Tax Rate (%)
Adjusted PAT
Change (%)
Margin (%)
Non-rec. (Exp)/Inc.
Reported PAT
Balance Sheet
Y/E December
Share Capital
Reserves
Net Worth
Loans
Capital Employed
Gross Block
Less: Accum. Depn.
Net Fixed Assets
Capital WIP
Investments
Current
Non-current
Curr. Assets, L&A
Inventory
Account Receivables
Cash and Bank Balance
Others
Curr. Liab. and Prov.
Account Payables
Other Liabilities
Provisions
Net Curr. Assets
Def. Tax Liability
Appl. of Funds
E: MOSL Estimates
2012
83,023
10.8
64,766
18,257
17.6
22.0
2,772
266
633
15,852
9.7
19.1
4,847
30.6
11,006
8.0
13.3
327
10,679
2013
90,619
9.1
70,815
19,804
8.5
21.9
3,300
365
1,222
17,362
9.5
19.2
5,609
32.3
11,753
6.8
13.0
582
11,171
2014
98,063
8.2
77,536
20,527
3.7
20.9
3,375
142
1,359
18,368
5.8
18.7
5,897
32.1
12,472
6.1
12.7
625
11,847
2015
81,233
-17.2
65,287
15,946
-22.3
19.6
3,473
33
1,621
14,062
-23.4
17.3
2,504
17.8
11,558
-7.3
14.2
5,925
5,633
2016E
92,639
14.0
73,807
18,832
18.1
20.3
3,544
42
2,096
17,341
23.3
18.7
5,549
32.0
11,792
2.0
12.7
1,008
10,784
(INR Million)
2017E
2018E
109,956
126,744
18.7
15.3
86,520
23,436
24.4
21.3
3,926
1
2,640
22,149
27.7
20.1
7,309
33.0
14,840
25.8
13.5
1,109
13,731
99,011
27,733
18.3
21.9
4,189
1
2,940
26,483
19.6
20.9
8,739
33.0
17,743
19.6
14.0
1,220
16,523
(INR Million)
2018E
964
47,327
48,292
10
48,302
60,377
33,854
26,523
2,308
17,720
14,302
3,418
45,798
13,520
1,454
27,250
3,572
41,670
10,098
5,309
26,263
4,128
-2,377
48,301
2012
964
17,020
17,984
10,502
28,486
44,276
12,233
32,043
3,441
3,649
3,649
0
12,507
7,456
876
2,370
1,806
21,532
5,394
5,580
10,558
-9,025
-1,621
28,486
2013
964
22,723
23,687
11,872
35,559
49,032
15,339
33,693
2,947
8,511
6,270
2,241
17,992
7,359
843
7,494
2,296
25,429
6,330
5,026
14,073
-7,437
-2,155
35,559
2014
964
27,408
28,372
196
28,568
50,090
18,323
31,766
2,448
8,118
5,074
3,045
15,863
8,441
991
4,458
1,972
27,400
7,287
4,096
16,017
-11,537
-2,227
28,568
2015
964
27,214
28,178
177
28,356
51,174
22,195
28,979
2,308
13,249
9,831
3,418
16,269
8,208
784
4,996
2,281
30,720
7,435
4,659
18,625
-14,451
-1,729
28,356
2016E
964
31,820
32,784
10
32,794
53,061
25,739
27,322
2,308
14,232
10,815
3,418
22,385
9,768
1,055
8,978
2,584
31,558
7,301
4,333
19,923
-9,173
-1,896
32,794
2017E
964
38,250
39,214
10
39,224
55,987
29,665
26,323
2,308
15,855
12,437
3,418
33,752
11,614
1,253
17,816
3,069
36,898
8,759
4,572
23,567
-3,146
-2,115
39,224
28 October 2016
5

Nestle India
Financials and valuations
Ratios
Y/E December
Basic (INR)
EPS
Cash EPS
BV/Share
DPS
Payout (%)
Valuation (x)
P/E
Cash P/E
EV/Sales
EV/EBITDA
P/BV
Dividend Yield (%)
Return Ratios (%)
RoE
RoCE
RoIC
Working Capital Ratios
Debtor (Days)
Asset Turnover (x)
Leverage Ratio
Debt/Equity (x)
Cash Flow Statement
Y/E December
OP/(loss) before Tax
Int./Div. Received
Depn. and Amort.
Interest Paid
Direct Taxes Paid
Incr in WC
CF from Operations
Incr in FA
Free Cash Flow
Pur of Investments
CF from Invest.
Incr in Debt
Dividend Paid
Others
CF from Fin. Activity
Incr/Decr of Cash
Add: Opening Balance
Closing Balance
E: MOSL Estimates
2012
114.1
142.9
186.5
48.5
42.5
2013
121.9
156.1
245.7
48.5
39.8
2014
129.4
164.4
294.3
63.0
48.7
2015
119.9
155.9
292.3
48.5
40.5
2016E
122.3
159.1
340.0
55.0
45.0
2017E
153.9
194.6
406.7
65.0
42.2
2018E
184.0
227.5
500.9
66.0
35.9
61.0
48.7
8.1
37.0
37.3
0.7
57.1
44.6
7.4
33.7
28.3
0.7
53.8
42.3
6.7
32.1
23.7
0.9
58.1
44.6
8.0
41.0
23.8
0.7
56.9
43.8
7.0
34.4
20.5
0.8
45.2
35.8
5.8
27.2
17.1
0.9
37.8
30.6
4.9
22.6
13.9
0.9
71.6
43.9
89.1
3.7
3.1
56.4
37.5
62.7
3.3
2.7
47.9
39.2
77.2
3.6
2.9
40.9
40.7
96.1
3.4
2.7
38.7
38.7
137.9
4.0
2.9
41.2
41.2
248.5
4.0
2.9
40.6
40.5
739.1
4.0
2.8
0.6
0.5
0.0
0.0
0.0
0.0
0.0
(INR Million)
2018E
23,544
2,940
4,189
1
8,477
2,161
18,478
4,389
14,089
1,866
-6,255
0
7,445
4,657
-2,788
9,435
17,816
27,251
2012
15,485
633
2,468
266
3,728
1,254
15,113
8,476
6,636
2,305
-10,781
793
5,435
408
-4,234
98
2,272
2,370
2013
16,505
1,222
3,106
365
5,075
3,536
17,214
4,262
12,952
4,862
-9,125
1,370
5,471
1,136
-2,965
5,124
2,370
7,494
2014
17,152
1,359
2,985
142
5,824
1,065
14,161
559
13,602
-393
-166
-11,676
7,166
1,812
-17,030
-3,035
7,494
4,458
2015
12,473
1,621
3,872
33
2,899
3,451
15,308
944
14,364
5,131
-6,075
-18
5,633
-3,045
-8,696
537
4,458
4,995
2016E
15,288
2,096
3,544
42
5,383
-1,296
10,100
1,888
8,212
983
-2,871
-167
6,178
3,099
-3,246
3,983
4,996
8,978
2017E
19,510
2,640
3,926
1
7,090
2,811
16,518
2,926
13,592
1,622
-4,548
0
7,301
4,169
-3,132
8,838
8,978
17,816
28 October 2016
6

Nestle India
Corporate profile
Company description
Nestle India is the largest packaged food
company in India. A subsidiary of Nestle S.A
(63% share), the company has a diversified
portfolio with strong brands like Maggi,
Nescafe, Everyday, etc.
Exhibit 1: Sensex rebased
Source: MOSL/Bloomberg
Exhibit 2: Shareholding pattern (%)
Sep-16
Promoter
DII
FII
Others
62.8
6.0
14.2
17.1
Jun-16
62.8
6.0
14.3
17.0
Sep-15
62.8
4.9
12.2
20.2
Source: Capitaline
Exhibit 3: Top holders
Holder Name
Life Insurance Corporation Of India
Arisaig Partners (Asia) Pte Ltd A/C Arisaig
India Fund Limited
Aberdeen Global Indian Equity Limited
NA
NA
% Holding
3.1
1.9
1.2
0.0
0.0
Source: Capitaline
Note: FII Includes depository receipts
Exhibit 4: Top management
Name
Suresh Narayanan
Shobinder Duggal
B Murli
Designation
Chairman & Managing
Director
Director (Finance &
Control)
Company Secretary
Exhibit 5: Directors
Name
Ashok Kumar Mahindra
Ravinder Narain
Aristides Protonotarios
Name
Rajya Vardhan Kanoria
Swati A Piramal
*Independent
Source: Capitaline
Exhibit 6: Auditors
Name
A F Ferguson & Co
Ramanath Iyer & Co
Type
Statutory
Cost Auditor
Exhibit 7: MOSL forecast v/s consensus
EPS
(INR)
FY17
FY18
MOSL
forecast
122.3
153.9
Consensus
forecast
144.6
166.3
Variation (%)
-15.4
-7.5
Source: Bloomberg
Source: Capitaline
28 October 2016
7

This document has been prepared by Motilal Oswal Securities Limited (hereinafter referred to as Most) to provide information about the company (ies) and/sector(s), if any, covered in the report and may be
Nestle India
distributed by it and/or
its affiliated company(ies). This report is for personal information of the selected recipient/s and does not construe to be any investment, legal or taxation advice to you. This research report does not constitute an offer, invitation or
inducement to invest in securities or other investments and Motilal Oswal Securities Limited (hereinafter referred as MOSt) is not soliciting any action based upon it. This report is not for public distribution and has been furnished to
you solely for your general information and should not be reproduced or redistributed to any other person in any form. This report does not constitute a personal recommendation or take into account the particular investment
objectives, financial situations, or needs of individual clients. Before acting on any advice or recommendation in this material, investors should consider whether it is suitable for their particular circumstances and, if necessary, seek
professional advice. The price and value of the investments referred to in this material and the income from them may go down as well as up, and investors may realize losses on any investments. Past performance is not a guide
for future performance, future returns are not guaranteed and a loss of original capital may occur.
MOSt and its affiliates are a full-service, integrated investment banking, investment management, brokerage and financing group. We and our affiliates have investment banking and other business relationships with a some
companies covered by our Research Department. Our research professionals may provide input into our investment banking and other business selection processes. Investors should assume that MOSt and/or its affiliates are
seeking or will seek investment banking or other business from the company or companies that are the subject of this material and that the research professionals who were involved in preparing this material may educate
investors on investments in such business . The research professionals responsible for the preparation of this document may interact with trading desk personnel, sales personnel and other parties for the purpose of gathering,
applying and interpreting information. Our research professionals are paid on twin parameters of performance & profitability of MOSt.
MOSt generally prohibits its analysts, persons reporting to analysts, and members of their households from maintaining a financial interest in the securities or derivatives of any companies that the analysts cover. Additionally,
MOSt generally prohibits its analysts and persons reporting to analysts from serving as an officer, director, or advisory board member of any companies that the analysts cover. Our salespeople, traders, and other professionals or
affiliates may provide oral or written market commentary or trading strategies to our clients that reflect opinions that are contrary to the opinions expressed herein, and our proprietary trading and investing businesses may make
investment decisions that are inconsistent with the recommendations expressed herein. In reviewing these materials, you should be aware that any or all of the foregoing among other things, may give rise to real or potential
conflicts of interest. MOSt and its affiliated company(ies), their directors and employees and their relatives may; (a) from time to time, have a long or short position in, act as principal in, and buy or sell the securities or derivatives
thereof of companies mentioned herein. (b) be engaged in any other transaction involving such securities and earn brokerage or other compensation or act as a market maker in the financial instruments of the company(ies)
discussed herein or act as an advisor or lender/borrower to such company(ies) or may have any other potential conflict of interests with respect to any recommendation and other related information and opinions.; however the
same shall have no bearing whatsoever on the specific recommendations made by the analyst(s), as the recommendations made by the analyst(s) are completely independent of the views of the affiliates of MOSt even though
there might exist an inherent conflict of interest in some of the stocks mentioned in the research report
Reports based on technical and derivative analysis center on studying charts company's price movement, outstanding positions and trading volume, as opposed to focusing on a company's fundamentals and, as such, may not
match with a report on a company's fundamental analysis. In addition MOST has different business segments / Divisions with independent research separated by Chinese walls catering to different set of customers having various
objectives, risk profiles, investment horizon, etc, and therefore may at times have different contrary views on stocks sectors and markets.
Unauthorized disclosure, use, dissemination or copying (either whole or partial) of this information, is prohibited. The person accessing this information specifically agrees to exempt MOSt or any of its affiliates or employees from,
any and all responsibility/liability arising from such misuse and agrees not to hold MOSt or any of its affiliates or employees responsible for any such misuse and further agrees to hold MOSt or any of its affiliates or employees free
and harmless from all losses, costs, damages, expenses that may be suffered by the person accessing this information due to any errors and delays. The information contained herein is based on publicly available data or other
sources believed to be reliable. Any statements contained in this report attributed to a third party represent MOSt’s interpretation of the data, information and/or opinions provided by that third party either publicly or through a
subscription service, and such use and interpretation have not been reviewed by the third party. This Report is not intended to be a complete statement or summary of the securities, markets or developments referred to in the
document. While we would endeavor to update the information herein on reasonable basis, MOSt and/or its affiliates are under no obligation to update the information. Also there may be regulatory, compliance, or other reasons
that may prevent MOSt and/or its affiliates from doing so. MOSt or any of its affiliates or employees shall not be in any way responsible and liable for any loss or damage that may arise to any person from any inadvertent error in
the information contained in this report. MOSt or any of its affiliates or employees do not provide, at any time, any express or implied warranty of any kind, regarding any matter pertaining to this report, including without limitation
the implied warranties of merchantability, fitness for a particular purpose, and non-infringement. The recipients of this report should rely on their own investigations.
This report is intended for distribution to institutional investors. Recipients who are not institutional investors should seek advice of their independent financial advisor prior to taking any investment decision based on this report or
for any necessary explanation of its contents.
Most and it’s associates may have managed or co-managed public offering of securities, may have received compensation for investment banking or merchant banking or brokerage services, may have received any compensation
for products or services other than investment banking or merchant banking or brokerage services from the subject company in the past 12 months.
Most and it’s associates have not received any compensation or other benefits from the subject company or third party in connection with the research report.
Subject Company may have been a client of Most or its associates during twelve months preceding the date of distribution of the research report
MOSt and/or its affiliates and/or employees may have interests/positions, financial or otherwise of over 1 % at the end of the month immediately preceding the date of publication of the research in the securities mentioned in this
report. To enhance transparency, MOSt has incorporated a Disclosure of Interest Statement in this document. This should, however, not be treated as endorsement of the views expressed in the report.
Motilal Oswal Securities Limited is registered as a Research Analyst under SEBI (Research Analyst) Regulations, 2014. SEBI Reg. No. INH000000412
Pending Regulatory inspections against Motilal Oswal Securities Limited:
SEBI pursuant to a complaint from client Shri C.R. Mohanraj alleging unauthorized trading, issued a letter dated 29th April 2014 to MOSL notifying appointment of an Adjudicating Officer as per SEBI regulations to hold inquiry and
adjudge violation of SEBI Regulations; MOSL replied to the Show Cause Notice whereby SEBI granted us an opportunity of Inspection of Documents. Since all the documents requested by us were not covered we have requested
to SEBI vide our letter dated June 23, 2015 to provide pending list of documents for inspection.
List of associate companies of Motilal Oswal Securities Limited -
Click here to access detailed report
Analyst Certification
The views expressed in this research report accurately reflect the personal views of the analyst(s) about the subject securities or issues, and no part of the compensation of the research analyst(s) was, is, or will be directly or
indirectly related to the specific recommendations and views expressed by research analyst(s) in this report. The research analysts, strategists, or research associates principally responsible for preparation of MOSt research
receive compensation based upon various factors, including quality of research, investor client feedback, stock picking, competitive factors and firm revenues
Disclosures
Disclosure of Interest Statement
Analyst ownership of the stock
Served as an officer, director or employee -
NESTLE INDIA
No
No
A graph of daily closing prices of securities is available at www.nseindia.com and http://economictimes.indiatimes.com/markets/stocks/stock-quotes
Regional Disclosures (outside India)
This report is not directed or intended for distribution to or use by any person or entity resident in a state, country or any jurisdiction, where such distribution, publication, availability or use would be contrary to law, regulation or
which would subject MOSt & its group companies to registration or licensing requirements within such jurisdictions.
For Hong Kong:
This report is distributed in Hong Kong by Motilal Oswal capital Markets (Hong Kong) Private Limited, a licensed corporation (CE AYY-301) licensed and regulated by the Hong Kong Securities and Futures
Commission (SFC) pursuant to the Securities and Futures Ordinance (Chapter 571 of the Laws of Hong Kong) “SFO”. As per SEBI (Research Analyst Regulations) 2014 Motilal Oswal Securities (SEBI Reg No. INH000000412)
has an agreement with Motilal Oswal capital Markets (Hong Kong) Private Limited for distribution of research report in Kong Kong. This report is intended for distribution only to “Professional Investors” as defined in Part I of
Schedule 1 to SFO. Any investment or investment activity to which this document relates is only available to professional investor and will be engaged only with professional investors.” Nothing here is an offer or solicitation of
these securities, products and services in any jurisdiction where their offer or sale is not qualified or exempt from registration. The Indian Analyst(s) who compile this report is/are not located in Hong Kong & are not conducting
Research Analysis in Hong Kong.
For U.S.
Motilal Oswal Securities Limited (MOSL) is not a registered broker - dealer under the U.S. Securities Exchange Act of 1934, as amended (the"1934 act") and under applicable state laws in the United States. In addition MOSL is
not a registered investment adviser under the U.S. Investment Advisers Act of 1940, as amended (the "Advisers Act" and together with the 1934 Act, the "Acts), and under applicable state laws in the United States. Accordingly, in
the absence of specific exemption under the Acts, any brokerage and investment services provided by MOSL, including the products and services described herein are not available to or intended for U.S. persons.
This report is intended for distribution only to "Major Institutional Investors" as defined by Rule 15a-6(b)(4) of the Exchange Act and interpretations thereof by SEC (henceforth referred to as "major institutional investors"). This
document must not be acted on or relied on by persons who are not major institutional investors. Any investment or investment activity to which this document relates is only available to major institutional investors and will be
engaged in only with major institutional investors. In reliance on the exemption from registration provided by Rule 15a-6 of the U.S. Securities Exchange Act of 1934, as amended (the "Exchange Act") and interpretations thereof by
the U.S. Securities and Exchange Commission ("SEC") in order to conduct business with Institutional Investors based in the U.S., MOSL has entered into a chaperoning agreement with a U.S. registered broker-dealer, Motilal
Oswal Securities International Private Limited. ("MOSIPL"). Any business interaction pursuant to this report will have to be executed within the provisions of this chaperoning agreement.
The Research Analysts contributing to the report may not be registered /qualified as research analyst with FINRA. Such research analyst may not be associated persons of the U.S. registered broker-dealer, MOSIPL, and
therefore, may not be subject to NASD rule 2711 and NYSE Rule 472 restrictions on communication with a subject company, public appearances and trading securities held by a research analyst account.
For Singapore
Motilal Oswal Capital Markets Singapore Pte Limited is acting as an exempt financial advisor under section 23(1)(f) of the Financial Advisers Act(FAA) read with regulation 17(1)(d) of the Financial Advisors Regulations and is a
subsidiary of Motilal Oswal Securities Limited in India. This research is distributed in Singapore by Motilal Oswal Capital Markets Singapore Pte Limited and it is only directed in Singapore to accredited investors, as defined in the
Financial Advisers Regulations and the Securities and Futures Act (Chapter 289), as amended from time to time.
In respect of any matter arising from or in connection with the research you could contact the following representatives of Motilal Oswal Capital Markets Singapore Pte Limited:
Varun Kumar
Varun.kumar@motilaloswal.com
Contact : (+65) 68189232
Office Address:21 (Suite 31),16 Collyer Quay,Singapore 04931
Kadambari Balachandran
kadambari.balachandran@motilaloswal.com
(+65) 68189233 / 65249115
28 October 2016
Motilal Oswal Tower, Level 9, Sayani Road, Prabhadevi, Mumbai 400 025
Phone: +91 22 3982 5500 E-mail: reports@motilaloswal.com
Motilal Oswal Securities Ltd
8