28 October 2016
2QFY17 Results Update | Sector: Automobiles
Eicher Motors
Buy
BSE SENSEX
27,941
Bloomberg
Equity Shares (m)
M.Cap.(INRb)/(USDb)
52-Week Range (INR)
1, 6, 12 Rel. Per (%)
Avg Val, INRm
Free float (%)
S&P CNX
8,638
EIM IN
27.2
652.6 / 9.7
26602/14818
-1/11/35
1158.2
49.4
CMP: INR24,026
TP: INR33,436 (+39.2%)
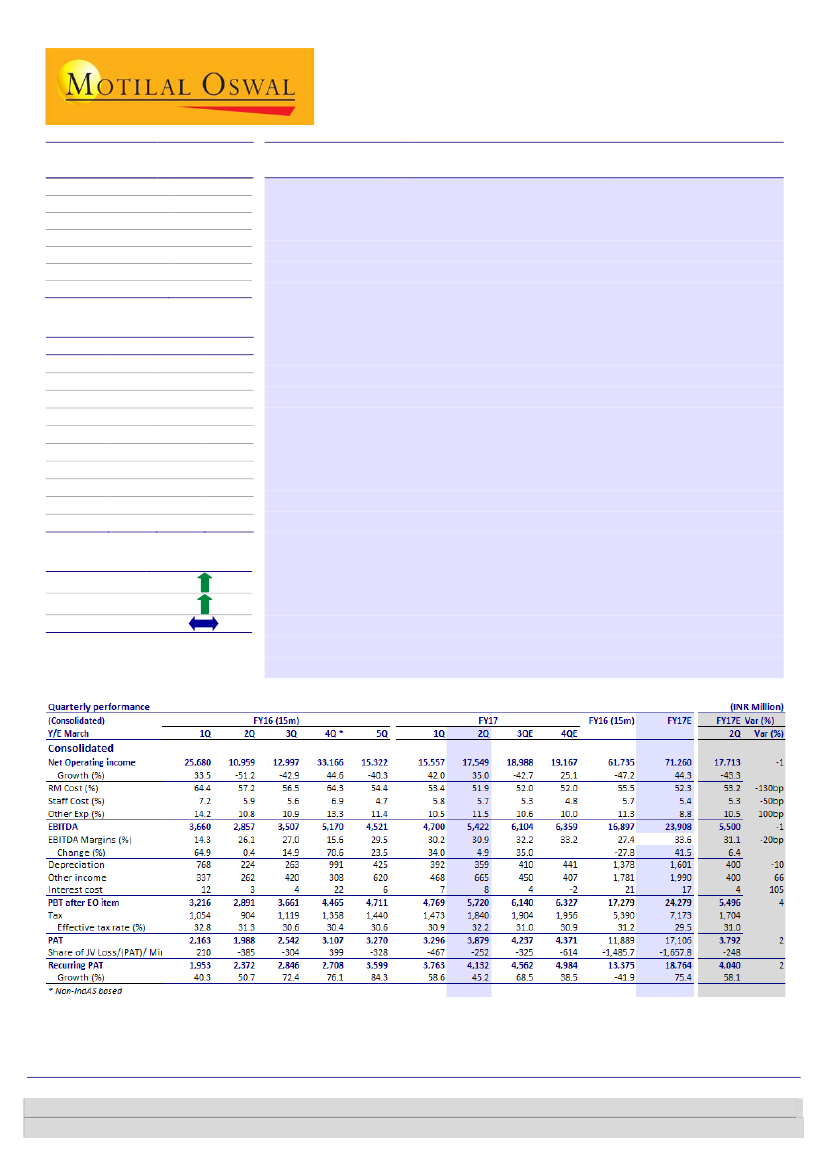
RE scales new highs, but VECV disappoints
Royal Enfield (RE) records best-ever EBITDA margin:
RE volumes grew 31% YoY
(+13% QoQ). Net realization grew 4% YoY (flat QoQ) to ~INR106k (in-line).
EBITDA margin expanded ~410bp YoY (+50bp QoQ) to 31.3% (v/s est. of
~30.6%), driven by efficiency-led reduction in RM costs (-450bp YoY; -140bp
QoQ). Adj. PAT rose 54% YoY to INR3.9b (v/s est. of ~INR3.8b), primarily driven
by higher other income (+58% YoY).
VECV margins decline due to unfavorable product mix:
VECV realizations
increased ~11% QoQ (-4% YoY) to ~INR1.47m (est. of ~INR1.46m) due to a
lower base of 1QFY17. EBITDA margin of 7.2% (-70bp YoY; -180bp QoQ) missed
our estimate of 7.7% due to unfavorable product mix. PAT declined ~3% YoY to
~INR657m (est. of ~INR685m).
Earnings call highlights:
a) RE’s classic model enjoys a waiting period of three
months, while other models have 1-1.5 months of waiting period. b) Top-20
cities continue to grow at 15%. d) Management indicated that it still has
enough headroom to further improve efficiencies by optimizing sourcing. c)
Current production capacity of 60k units/month should remain stable until
third plant is commissioned by 2QFY18 with initial capacity of 25-30k
units/month. For FY19, it maintained target of 900k/annum. d) Price increase
of 1% was taken in Aug-16 for RE bikes. e) RE plans to launch one new product
in FY18. f) Discounting in CVs at ‘super high’ levels.
Valuation and view:
We upgrade our EPS for FY17/18 by 2%/7% to factor in higher
RE volumes and strong margins. EIM trades at 26x/20.6x FY18E/19E EPS. Maintain
Buy
with a target price of INR33,436 (FY19 SOTP-based).
Financials & Valuations (INR b)
2016 2017E
Y/E Dec
Net Income
61.7
71.3
EBITDA
16.9
22.6
Net Profit
13.4
17.4
EPS (INR)
492.9
642.1
EPS Gr. (%)
73.7
62.9
BV/Sh. (INR) 1,276
1,777
RoE (%)
35.8
42.1
RoCE (%)
21.3
27.9
Payout (%)
0.4
0.5
Div. Yield,%
0.4
0.5
2018E
91.5
30.3
25.1
925.4
44.1
2,532
42.9
31.3
0.6
0.6
Estimate change
TP change
Rating change
Jinesh Gandhi
(Jinesh@MotilalOswal.com); +91 22 6129 1524
Aditya Vora
(Aditya.Vora@MotilalOswal.com); +91 22 6129 1533 /
Venil Shah
(Venil.Shah@motilaloswal.com); +91 22 3982 5445
Investors are advised to refer through important disclosures made at the last page of the Research Report.
Motilal Oswal research is available on www.motilaloswal.com/Institutional-Equities, Bloomberg, Thomson Reuters, Factset and S&P Capital.

Eicher Motors
Royal Enfield: It keeps getting better…
Revenues continue to make new high, driven by 31% YoY volume growth;
Realizations lend support
Royal Enfield volumes grew by 31% YoY (+13% QoQ) with domestic segment
which accounts for 98% of sales volumes increased by 31% YoY while exports
growth moderated to 30% (export volumes at ~3120 units)
Net realization grew by 4% YoY; (flat QoQ) due to price hike of ~1% taken in
Aug-16 and marginal support from improvement in product mix (launch of
Himalayan bike)
As a result operating revenues crosses the previous high achieved in 1QFY17,
growing 36% YoY (+13% QoQ) to INR17.6b (in-line)
EBITDA margins continue to make new highs led by lower RM costs and
operating leverage
Strong revenue growth coupled with RM cost savings led to EBITDA of ~INR 5.5b
(v/s est ~INR 5.5b); growth of 56% YoY ( +15% QoQ)
EBITDA margins expanded by ~410bp YoY (+50bp QoQ) to 31.3% (v/s est
~31.1%), driven by sharp reduction in RM costs (-450bp YoY; -140 bp QoQ) and
benefits of operating leverage. However other expense was higher QoQ
primarily due to marketing expenses on account of newly launched Himalayan
bike.
Further, jump in other income (+58% YoY) boosted Adj PAT to ~ INR3.9b (v/s est
~INR 3.8b) in 2QFY17; growth of 54% YoY. However effective tax rate was higher
at 32% in 2QFY17.
28 October 2016
2

Eicher Motors
Exhibit 1: RE’s Realizations improve by ~4% YoY
Royal Enfield Realizations (INR)
Source: Company, MOSL
Exhibit 2: Strong volume growth of 31% YoY
Royal Enfield volumes (units)
Growth YoY %
84 85
72
70
68
61
56 53 61
50
49 44 44
45
48
45
38 31
Exhibit 3: Margins continue to make new highs
Royal Enfield EBITDA margins %
23.1
25.0
26.1
27.2
26.1
28.6
30.8
31.3
15.3
17.7
19.3
11.5
15.1
17.8 18.6
24.9
23.6
29.6
Source: Company, MOSL
VECV
EBITDA margins under pressure due to unfavorable product mix QoQ
VECV volumes grew ~15% YoY to ~13.4k units with domestic segment which
accounted for 84% of volumes contributed to 18% YoY growth; while exports
moderated sharply to 5% YoY.
Domestic trucks grew by 12% YoY as both LMD and HD trucks growth slowed
down to 9% and 21% respectively on account of higher base of 2QFY16
Realizations increased ~11% QoQ (-4% YoY) to ~INR1.47m (v/s est ~INR1.46m),
on account of a lower base sequentially. Discounts continued to remain at a
high level.
Consequently, net revenues grew ~11% to ~INR19.7b (v/s ~INR19.6b) driven by
a 15% YoY growth in volumes but pulled down by 4 % decline in realizations YoY.
EBITDA margins at 7.2% (-70bp YoY; -180 bp QoQ) primarily due to unfavorable
product mix on account of higher share of LMD trucks and decline in share of
buses and HMD trucks.
PAT declined ~3% YoY to ~INR657m (v/s est ~INR 685m).
28 October 2016
3

Eicher Motors
Exhibit 5: Margins moderate to 7.2% on adverse product
mix
VECV EBITDA margins %
33
15
5.8
7.6
6.2
8.0
7.6 5.6
5.9
5.8
6.9
7.3
6.6
7.1
8.0 7.4
8.2
8.0
9.1
7.2
Exhibit 4: Volume recovery moderates to 15% on high base
VECV volumes (units)
Growth YoY %
21
6
30
41
-13
9 -14
-9
-9 -14
-23 -20
5 5
8
10
Source: Company, MOSL
Exhibit 6: VECV: Product mix
L&MD - Trucks (Dom)
% of total CV volumes
HD - Trucks (Dom)
% of total CV volumes
Total Dom. Trucks
% of total CV volumes
Buses (Dom)
% of total CV volumes
Total Domestic
% of total CV volumes
Total Exports
% of total CV volumes
Total ETB
% of total CV volumes
Volvo Truck India (units)
% of total CV volumes
Total CV Volumes
2QFY17
6,376
48
2,301
17
8,677
65
2,585
19
11,262
84
1,887
14
13,149
98
259
2
13,408
3QFY16
5,863
50
1,901
16
7,764
67
1,747
15
9,511
82
1,799
15
11,310
97
347
3
11,657
YoY (%)
8.7
21.0
11.8
48.0
18.4
4.9
16.3
-25.4
15.0
1QFY17
6,178
38
3,205
20
9,383
58
4,219
26
13,602
85
2,312
14
15,914
99
157
1
16,071
QoQ (%)
3.2
-28.2
-7.5
-38.7
-17.2
-18.4
-17.4
65.0
-16.6
Source: Company, MOSL
Exhibit 7: MDEP volumes grew ~26% YoY
MDEP volumes (Units)
5,975
3,200
3,800
2,600
3,900
4,353
4,800
4,728
4,622
6,048
2,600
1QCY14
2QCY14
3QCY14
4QCY14
1QCY15
2QCY15
3QCY15
4QCY15
5QFY16
1QFY17
2QFY17
Source: Company, MOSL
28 October 2016
4

Eicher Motors
Exhibit 8:
VECV: Quarterly (derived)
Y/E December
Total CV Volumes
Growth (%)
Net Realn (INR
'000/unit)
Change - YoY (%)
Net Op. Income
Growth (%)
EBITDA
EBITDA Margins
(%)
EBITDA (INR/unit)
Recurring PAT
Growth (%)
E: MOSL Estimates
FY16 (15m)
1Q
2Q 3Q * 4Q *
5Q
11,020 12,128 11,657 12,692 15,553
10.4
6.3
20.8
30.2
41.1
1,458 1,472 1,529 1,602 1,427
13.0
12.0
1.5
6.5
-2.1
16,069 17,852 17,825 20,327 22,199
24.7
19.1
22.6
38.7
38.2
1,148 1,460 1,418 1,502 1,779
7.1
8.2
8.0
7.4
8.0
FY17
1Q
2Q
3QE
4QE
16,071 13,408 14,394 18,673
32.5
15.0
13.4
20.1
1,331 1,470 1,478 1,509
-9.6
-3.8
-7.7
5.7
21,395 19,716 21,272 28,183
19.8
10.6
4.6
27.0
1,940 1,428 1,713 2,572
9.1
7.2
8.1
9.1
FY16
(15m)
63,050
23.7
1,526
8.1
96,239
33.7
7,620
7.9
FY17E
62,546
24.0
1,448
-5.1
90,566
17.6
7,653
8.5
2QE Var (%)
13,408
0.0
15.0
1,464
-6.3
19,630
7.8
1,508
7.7
0.4
0.4
-5.3
-40bp
104,129 120,383 121,644 118,334 114,351
436
768
677
657
830
20.0
69.5
50.3
15.4
90.3
120,714 106,504 119,010 137,739
1,082
657
827 1,400
40.9
-3.0
25.9
68.8
120,850122,359
112,474
3,817
3,966
685
-40.6
29.9
19.6
-4.1
Key takeaways from Con-Call
Royal Enfield
RE waiting period for Classic (which accounts for ~65% of domestic RE volumes)
stood at ~ 3 months while other models had a waiting period of 1-1.5 months on
an average.
Top 20 cities account for 33% of total RE dealership; recording a growth of 15%
YoY.
Order flow continues to remain robust with order book growing MoM and
expected to grow in November as well.
Management indicated that it still has enough headroom to further improve
efficiencies by optimizing sourcing and rationalizing vendors.
Commodity costs are expected to marginally harden during 2HFY17.
Spare part sales growth is largely in line with RE’s motorcycle growth rate for
1HFY17.
Customer profile: First time buyers rising with migration happening from 150cc
motorcycle to RE bikes. It estimates 90% RE bikes are used for commuting
purposes
RE expects to launch a new product in the next financial year (FY18); The
Company wants to focus on the newly created category Himalayan.
Management believes, the increasing share of its model Classic in overall
portfolio could be due to waiting periods reducing coupled with higher resale
value for the motorcycle.
Dealer count in Sep-16 stood at 605 dealers Pan India.
The company’s technology center at UK is likely to open next quarter while its
Chennai R&D facility is likely to be commissioned at the start of FY18.
Current exit rate stood at 60k units/month. Management expects the first phase
of its 3
rd
plant at Vallam Vadagal to come up in 2QFY18 with an initial capacity of
25-30k units/month. For FY19, it maintained target of 900k.
Price increase of 1% was taken in Aug-16.
28 October 2016
5

Eicher Motors
VECV
Discounts continue to remain high in the HD segment; mainly by the market
leader. Management believes higher discounts are primarily to gain market
share rather than to boost demand.
Demand for HD trucks was weak due to subdued coal mining activity impacting
demand for Tippers.
VECV has 280-285 touch points.
JV with Polaris: It is present in 8 states and 60 locations with its personal utility
vehicle Multix.
MDEP engine volumes at ~6000 units; Growth of 26% YoY
Valuation and view
RE volume momentum to further strengthen as focus shifts from production to
products:
With confidence in managing capacities, management’s focus has
shifted to products and marketing process. It is now focusing on expanding
addressable market through a) improving product quality, b) new product
launches, c) expanding dealership (in sync with capacity expansion) and d)
driving paradigm change in retail identity, in turn improving visibility of
sustenance of strong growth. Further, it has expanded managerial bandwidth
and plugged gaps in skill sets by hiring best in the business.
Export market huge opportunity, but to fully play out over next few years:
RE
is focused on creating an affordable leisure biking segment in 250-650cc and in
price range of USD3-7,000. Globally, size of 250cc-650cc segment is ~1m
annually, dominated by sports/street biking segment. Exports from India for
premium segment (Ex RE, >150cc) is over 0.5m annually. However, RE’s exports
are just ~9,000 units, restricted due to capacity constraints and limited relevant
product portfolio for export markets. EIM has recently started executing its
export strategy, based on experiential marketing like they have done it in India,
and is opening exclusive stores in markets like LatAm, Indonesia, London, Paris,
Madrid etc. We believe that export market can be a meaningful contributor to
volumes in next 5 years given the huge opportunity size and differentiated
positioning of Royal Enfield.
New product launches and capacity addition to drive strong volume growth,
margins:
After no meaningful launch over last few years, RE is planning to
launch several new products over next 5 years, with Himalayan motorcycle
launched in Feb-16. Further, its 3rd plant would come on-stream in FY19, taking
total capacity of ~900k. Current exit rate stood at 60k units/month. Its new plant
is expected to start operations from 2QFY18 with an initial 25-30k units month.
We expect RE volumes to grow 36% over FY16-19E. We expect margins to
expand 640 bps over FY16-19E on back of higher operating leverage and
consolidation of its vendor base near its 3 plants in Tamil Nadu.
VECV well prepared for CV cycle recovery:
While Pro series launch of LMD and
HD range (big upgrade of existing platform) is largely done, we believe
acceptance of new range would happen gradually. Pro series will help to ramp-
up exports over next 2 years, with focus on Africa and Asia. MDEP ramp-up
continues with ~18,000 units in CY15. We estimate VECV’s sales/PAT to post
20%/29% CAGR (FY16-18E).
28 October 2016
6

Eicher Motors
Growth remains strong, with more legs to it!:
We are upgrading our EPS for
FY17/18 by 2%/7%, to factor in for higher RE volumes and strong margins of RE.
EIM trades at 26x/20.6x FY18E/19E EPS. Consol EPS to grow ~44% CAGR over
FY16-19E, with RoIC improving from ~37% in CY14 to ~62% in FY19. Maintain
Buy
with target price of INR33,436 (FY19E SOTP-based, valuing RE at 30x EPS
and VECV at 10x EV/EBITDA).
FY17E
Rev
Old
666,924
70,931
22,134
31.2
14,222
16,569
610.1
63,008
91,782
8,361
9.1
3,888
89.1
630.7
Chg (%)
0.8
0.5
2.0
50bp
2.3
3.5
3.5
(0.7)
(1.3)
(8.5)
-70bp
(12.5)
(10.9)
1.8
Rev
840,530
91,488
30,338
33.2
20,254
23,725
873.5
73,533
112,369
10,296
9.2
4,899
113.7
925.3
FY18E
Old
804,141
88,362
28,054
31.7
18,623
21,895
806.2
74,071
113,916
11,192
9.8
5,571
127.2
865.8
Chg (%)
4.5
3.5
8.1
140bp
8.8
8.4
8.4
(0.7)
(1.4)
(8.0)
-70bp
(12.1)
(10.6)
6.9
Exhibit 9: Revised forecast
(INR M)
Standalone (RE)
Volumes (units)
Net Sales
EBITDA
EBITDA (%)
Core Profit
Net Profit
EPS (INR)
VECV
Volumes (units)
Net Sales
EBITDA
EBITDA (%)
Core Profit
EPS (INR)
Consol EPS (INR)
672,424
71,260
22,584
31.7
14,556
17,143
631.2
62,546
90,559
7,652
8.4
3,404
79.4
642.1
Source: Company, MOSL
Exhibit 10: SOTP Valuations
INR M
Royal Enfield
PAT (ex VECV div)
Equity Value
VECV (@ 54.4% Economic interest)
EBITDA
EV
Net Debt
Equity Value
Total Equity Value
Target Price (INR/Sh)
Upside (%)
PE (x)
PE based
FY18E
30
22,444
673,312
5,602
56,019
-4,679
60,698
734,009
27,025
12.5
FY19E
30
27,561
826,825
7,490
74,903
-6,394
81,297
908,121
33,436
39.2
@ 9x EV/EBITDA
Source: Company, MOSL
28 October 2016
7

Eicher Motors
Exhibit 11: Valuations trading above historical average, reflecting improving fundamentals
45
36
27
18
9
0
13.8
22.5
17.3
P/E (x)
5 Yrs Avg(x)
15 Yrs Avg(x)
10 Yrs Avg(x)
27.9
16.0
12.0
8.0
4.0
0.0
6.9
4.2
3.3
P/B (x)
5 Yrs Avg(x)
15 Yrs Avg(x)
10 Yrs Avg(x)
10.2
Source: MOSL
Source: MOSL
Exhibit 12: Comparative Valuation
Auto OEM's
Bajaj Auto
Hero MotoCorp
TVS Motor
M&M
Maruti Suzuki
Tata Motors
Ashok Leyland
Eicher Motors
Auto Ancillaries
Bharat Forge
Exide Industries
Amara Raja Batteries
BOSCH
CMP Rating
(INR)*
2,835 Buy
3,348 Neutral
405 Buy
1,311 Buy
5,875 Buy
536 Buy
90 Buy
24,026 Buy
885 Buy
196 Buy
1,014 Buy
22,025 Neutral
TP
(INR)
3,414
3,764
492
1,693
6,865
655
97
33,436
1,137
250
1,255
24,839
P/E (x)
FY17E FY18E
19.2
15.8
17.7
15.1
30.2
21.8
18.5
13.7
22.1
18.2
12.0
9.6
16.7
12.1
37.4
26.0
32.0
22.7
30.4
43.3
23.7
18.8
23.7
31.0
EV/EBITDA (x)
FY17E FY18E
13.3
10.5
11.6
9.7
19.1
14.0
15.1
12.0
14.1
11.5
4.6
3.8
9.1
6.7
29.4
22.2
16.0
14.1
17.8
33.6
13.0
11.9
14.2
22.6
RoE (%)
FY17E FY18E
32.1
33.3
42.6
40.6
29.2
31.8
15.1
17.5
23.7
23.5
17.2
18.0
25.4
29.1
42.1
42.9
17.0
14.8
24.4
18.0
20.3
15.7
25.4
21.6
RoCE (%)
EPS CAGR (%)
FY17E FY18E FY16E-18E
31.2
32.3
16.6
41.6
39.8
18.5
30.2
34.8
42.8
12.6
14.8
22.5
31.9
31.6
33.5
12.3
13.2
22.7
18.7
22.8
38.2
27.9
31.3
37.0
11.6
15.4
23.1
25.5
14.7
16.5
24.2
30.6
15.3
19.1
22.3
14.0
Source: Company, MOSL
28 October 2016
8

Eicher Motors
Operating metrics
Exhibit 13: Snapshot of Revenue Model
000 units
ROYAL ENFIELD (S/A)
Total 2W (units)
Growth (%)
Net realn (INR'000/unit)
Growth (%)
RE Revenues (INR b)
Growth (%)
VECV
Dom - LMD
Growth (%)
% of CV Vols
Dom - HCV
Growth (%)
% of CV Vols
Total Dom.
Growth (%)
% of CV Vols
Exports
Growth (%)
% of CV Vols
Total CV vols
Growth (%)
MDEP Vols (Ex captive)
Net realn (INR'000/unit)
Growth (%)
VECV Revenues (INR b)
Growth (%)
Net Consol sales (INR b)
Growth (%)
CY12
113
52.0
92
3.0
10
56.3
36
-3.9
75.3
9
14.8
19.2
45
-0.6
94.5
3
-16.3
5.5
48
-1.6
1,111
8
53
5.9
64
11.6
CY13
178
57.0
95
2.7
17
63.3
31
-13.3
76.1
7
-27.4
16.3
38
-16.1
92.3
3
20.1
7.7
41
-14.1
3
1,236
11
51
-4.1
68
6.6
CY14 FY16 (15m)
303
69.9
100
5.4
30
76.9
28
-9.9
70.1
6
-8.2
15.3
34
-9.6
85.4
6
86.5
14.6
40
-2.3
12
1,412
14
58
12.3
87
28.3
600
98.3
103
3.0
62
104.1
42
50.0
68.1
12
98.2
19.7
54
58.6
87.8
8
29.0
12.2
62
54.3
24
1,526
8
96
67.1
62
-29.4
FY17E
672
40.0
106
2.8
71
44.0
40
18.6
64.9
13
33.9
21.1
53
22.1
86.0
9
42.4
14.0
61
24.5
20
1,448
19
91
17.6
71
44.3
FY18E
841
25.0
108
2.7
91
28.4
46
15.0
63.5
16
24.0
22.3
62
17.2
85.8
10
19.4
14.2
72
17.5
24
1,528
6
112
24.1
91
28.4
FY19E
968
15.2
112
2.9
108
18.5
53
15.0
63.0
19
19.5
23.0
72
16.2
85.9
12
15.0
14.1
84
16.0
26
1,552
2
132
17.8
108
18.5
Source: Company, MOSL
28 October 2016
9

Eicher Motors
Eicher Motors| Story in charts: Multiple growth drivers
Exhibit 14: Capacity addition and healthy demand to drive
RE volumes…
Volumes (units)
69.9
57.0
58.7
Growth (%)
Exhibit 15: …together with efficiencies of new plant to drive
RE margins
EBITDA
27.6
EBITDA Margins (%)
31.7
33.2
34.1
40.0
19.0
25.0
15.2
24.2
CY13
CY14 FY16E (15m) FY17E
FY18E
FY19E
CY13
CY14
FY16E
(15m)
FY17E
FY18E
FY19E
Source: Company, MOSL
Exhibit 16: VECV recovery expected to get stronger in FY18
VECV (units)
54.3
Growth YoY %
Exhibit 17: Improved demand, lower discounts
favorable product mix to drive VECV margins
EBITDA (INR m)
7.7
7.9
8.4
EBITDA (%)
9.2
and
10.4
24.5
(1.6)
47,544
CY12
(14.1)
40,817
CY13
(2.3)
39,892 61,551
CY14
FY16E
(15m)
61,324
FY17E
6.7
17.5
16.0
72,065
FY18E
83,605
FY19E
CY13
CY14
FY16E
(15m)
FY17E
FY18E
FY19E
Source: Company, MOSL
Exhibit 18: Royal Enfield to contribute ~83% of FY19 EBITDA
Royal Enfield
44
60
(4)
0
22
78
2
18
80
VECV (ex-MDEP)
1
14
84
1
14
84
MDEP
1
16
83
Exhibit 19: Robust growth to drive RoE and RoCE (%)
60
40
20
21
27
37
RoE
RoIC
42
50
43
59
39
62
36 38
Source: Company, MOSL
28 October 2016
10

Eicher Motors
Financials and Valuations
Income Statement (Consolidated)
Y/E March
Net Sales
Change (%)
EBITDA
EBITDA Margin (%)
Depreciation
Interest cost
Other Income
PBT
Tax
Effective Rate (%)
PAT
Change (%)
Less: Minority Interest
Adj. PAT
Change (%)
Note: FY16 onwards IndAS
2012
63,299
11.5
5,490
7.8
822
38
1,366
5,997
1,249
20.8
4,749
-4.5
1,506
3,243
5.0
CY13
66,858
5.6
7,137
9.6
1,300
79
953
6,711
1,452
21.6
5,259
10.8
1,314
3,945
21.7
CY14 FY16E(15m)
85,987
61,735
28.6
-
11,147
16,908
11.9
22.0
2,198
1,378
98
21
1,074
1,781
9,926
17,290
2,909
5,390
29.3
31.2
7,017
11,900
33.4
35.7
864
-1,486
6,153
13,386
56.0
74.0
FY17E
70,982
14.9
22,584
28.2
1,601
17
1,990
22,956
7,173
31.2
15,783
65.8
-1,658
17,441
62.9
(INR Million)
FY18E
91,132
28.4
30,338
29.5
2,229
15
3,125
31,219
8,775
28.1
22,444
42.2
-2,689
25,133
44.1
FY19E
108,027
18.5
36,947
30.3
2,899
15
4,400
38,433
10,872
28.3
27,561
22.8
-4,121
31,682
26.1
Balance Sheet (Consolidated)
Y/E March
Share Capital
Net Worth
Minority Interest
Deferred Tax
Loans
Capital Employed
Application of Funds
Gross Fixed Assets
Less: Depreciation
Net Fixed Assets
Capital WIP
- of which Goodwill
Investments
Curr.Assets, L & Adv.
Inventory
Sundry Debtors
Cash & Bank Balances
Loans & Advances
Others
Current Liab. & Prov.
Sundry Creditors
Other Liabilities
Provisions
Net Current Assets
Application of Funds
E: MOSL Estimates
2012
270
17,549
9,485
1,232
384
28,649
15,260
5,342
9,918
5,044
223
6,385
23,368
4,888
4,459
8,035
5,503
483
16,066
14,356
6
1,704
7,302
28,649
CY13
270
20,554
10,397
1,805
839
33,595
22,993
6,431
16,561
4,636
223
8,255
23,914
5,268
5,125
6,826
6,163
532
19,771
17,612
0
2,159
4,143
33,595
CY14 FY16E(15m)
271
272
25,159
34,643
10,851
11,569
2,394
3,382
584
859
38,986
50,452
31,374
8,280
23,093
4,188
223
10,777
25,974
6,455
5,622
3,533
8,534
1,830
25,046
15,127
6,706
3,213
928
38,987
39,341
9,658
29,683
3,453
223
16,383
35,269
10,143
8,336
5,914
9,886
990
34,336
25,093
7,048
2,195
933
50,452
FY17E
272
48,275
9,911
3,625
859
62,670
52,835
11,259
41,576
1,250
223
7,098
54,313
11,704
8,552
21,831
10,993
1,232
41,566
28,107
7,329
6,130
12,746
62,670
(INR Million)
FY18E
272
68,767
7,222
3,950
859
80,798
64,085
13,489
50,596
1,250
223
7,098
74,164
14,733
8,324
36,812
12,746
1,550
52,310
35,338
9,389
7,584
21,854
80,798
FY19E
272
95,104
3,101
4,353
859
103,416
76,585
16,387
60,198
1,250
223
7,098
96,600
17,406
9,813
52,208
15,341
1,831
61,729
41,739
11,126
8,864
34,870
103,416
28 October 2016
11

Eicher Motors
Financials and Valuations
Ratios (Consolidated)
Y/E March
Basic (INR)
EPS
EPS Growth (%)
Cash EPS
Book Value per Share
DPS
Payout (Incl. Div. Tax) %
Valuation (x)
P/E
Cash P/E
EV/EBITDA
EV/Sales
Price to Book Value
Dividend Yield (%)
Profitability Ratios (%)
RoE
RoCE
RoIC
Turnover Ratios
Debtors (Days)
Inventory (Days)
Creditors (Days)
Working Capital (Days)
Asset Turnover (x)
Leverage Ratio
Debt/Equity (x)
2012
120.1
5.0
150.5
650.0
20.0
17.3
200.1
159.6
175.9
16.1
37.0
0.1
20.0
18.0
59.6
25
28
82
-29
2.2
0.0
CY13
145.9
21.5
194
760
30.0
22.3
164.7
123.9
118.0
14.2
31.6
0.1
20.7
17.1
39.7
27
28
94
-39
2.0
0.0
CY14 FY16E(15m)
227.1
55.6
308
928
35.0
25.1
105.8
78.0
67.9
10.4
25.9
0.1
26.9
19.5
36.8
23
27
63
-13
2.2
0.0
492.9
73.7
544
1,276
100.0
23.4
48.7
44.2
30.3
5.6
18.8
0.4
35.8
21.3
37.8
62
75
185
-49
3.1
0.0
FY17E
642.1
62.9
701
1,777
125.0
21.8
37.4
34.3
23.4
5.2
13.5
0.5
42.1
27.9
50.4
44
60
144
-40
1.1
0.0
FY18E
925.4
44.1
1,007
2,532
150.0
18.5
26.0
23.8
16.8
4.0
9.5
0.6
42.9
31.3
59.3
33
59
141
-49
1.1
0.0
FY19E
1,166.5
26.1
1,273
3,502
175.0
16.9
20.6
18.9
13.1
3.2
6.9
0.7
38.7
29.9
62.2
33
59
140
-49
1.0
0.0
Cash Flow Statement (Consolidated)
Y/E March
Profit before Tax
Depreciation & Amort.
Direct Taxes Paid
(Inc)/Dec in Working Capital
Interest/Div. Received
Other Items
CF from Oper. Activity
(Inc)/Dec in FA+CWIP
Free Cash Flow
(Pur)/Sale of Invest.
CF from Inv. Activity
Issue of Shares
Inc/(Dec) in Debt
Interest Paid
Dividends Paid
CF from Fin. Activity
Inc/(Dec) in Cash
Add: Beginning Balance
Closing Balance
E: MOSL Estimates
2012
5,997
822
-1,077
391
1,351
-1,308
6,177
-7,820
-1,644
-1,263
-9,083
4
-43
-40
-895
-974
-3,880
11,915
8,035
0
CY13
6,706
1,300
-1,504
1,491
1,023
-819
8,197
-7,054
1,143
-1,879
-8,933
17
610
-80
-1,020
-474
-1,209
8,035
6,826
0
CY14 FY16E(15m)
9,926
17,290
2,198
1,378
-2,810
-4,345
2,020
3,564
950
1,781
-1,809
-2,948
10,475
16,721
-9,682
-7,232
793
9,489
-1,190
-5,606
-10,872
-12,838
79
-764
-255
275
-98
-21
-1,348
-3,138
-1,622
-3,648
-2,020
235
6,826
4,806
4,806
5,041
1,273
-874
FY17E
22,956
1,601
-6,930
1,236
1,990
895
21,748
-11,291
10,457
9,285
-2,006
0
0
-17
-3,808
-3,825
15,917
5,041
20,958
-874
(INR Million)
FY18E
31,219
2,229
-8,450
4,431
3,125
-1,668
30,886
-11,250
19,636
0
-11,250
0
0
-15
-4,641
-4,656
14,980
20,958
35,938
-874
FY19E
38,433
2,899
-10,469
2,240
4,400
-4,245
33,257
-12,500
20,757
0
-12,500
0
0
-15
-5,345
-5,360
15,397
35,938
51,334
-874
28 October 2016
12

Eicher Motors
Corporate profile
Company description
Promoted by the Delhi-based Vikram Lal Group,
Eicher Motors (EIM) is a diversified engineering
company. It is engaged in the business of high end
motorcycles (350cc & above) under the brand
'Royal Enfield', and commercial vehicles (CVs),
automotive gears and components, and engineering
solutions through its subsidiary, Volvo Eicher
Commercial Vehicles (VECV).
Source: MOSL/Bloomberg
Exhibit 1: Sensex rebased
Exhibit 2: Shareholding pattern (%)
Sep-16
Promoter
DII
FII
Others
50.6
3.5
33.3
12.7
Jun-16
50.7
3.8
32.4
13.1
Sep-15
54.9
4.3
27.1
13.8
Source: Capitaline
Exhibit 3: Top holders
Holder Name
Europacific Growth Fund
Cartica Capital Ltd
Tiaa-Cref Funds - Tiaa Cref International
Equity
% Holding
4.0
2.4
1.1
Note: FII Includes depository receipts
Source: Capitaline
Exhibit 4: Top management
Name
S Sandilya
Siddhartha Lal
Manhar Kapoor
Designation
Chairman
Managing Director & CEO
Company Secretary
Exhibit 5: Directors
Name
M J Subbaiah
Priya Brat
Name
Prateek Jalan
Manvi Sinha
Source: Capitaline
*Independent
Exhibit 6: Auditors
Name
Deloitte Haskins & Sells
V Kalyanaraman
Type
Statutory
Cost Auditor
Exhibit 7: MOSL forecast v/s consensus
EPS
(INR)
FY17
FY18
MOSL
forecast
642.1
925.4
Consensus
forecast
644.9
822.6
Variation (%)
-0.4
12.5
Source: Bloomberg
Source: Capitaline
28 October 2016
13

Disclosures
This document has been prepared by Motilal Oswal Securities Limited (hereinafter referred to as Most) to provide information about the company (ies) and/sector(s), if any, covered in the report and may be distributed by it and/or
Eicher Motors
its affiliated company(ies). This report is for personal information of the selected recipient/s and does not construe to be any investment, legal or taxation advice to you. This research report does not constitute an offer, invitation or
inducement to invest in securities or other investments and Motilal Oswal Securities Limited (hereinafter referred as MOSt) is not soliciting any action based upon it. This report is not for public distribution and has been furnished to
you solely for your general information and should not be reproduced or redistributed to any other person in any form. This report does not constitute a personal recommendation or take into account the particular investment
objectives, financial situations, or needs of individual clients. Before acting on any advice or recommendation in this material, investors should consider whether it is suitable for their particular circumstances and, if necessary, seek
professional advice. The price and value of the investments referred to in this material and the income from them may go down as well as up, and investors may realize losses on any investments. Past performance is not a guide
for future performance, future returns are not guaranteed and a loss of original capital may occur.
MOSt and its affiliates are a full-service, integrated investment banking, investment management, brokerage and financing group. We and our affiliates have investment banking and other business relationships with a some
companies covered by our Research Department. Our research professionals may provide input into our investment banking and other business selection processes. Investors should assume that MOSt and/or its affiliates are
seeking or will seek investment banking or other business from the company or companies that are the subject of this material and that the research professionals who were involved in preparing this material may educate
investors on investments in such business . The research professionals responsible for the preparation of this document may interact with trading desk personnel, sales personnel and other parties for the purpose of gathering,
applying and interpreting information. Our research professionals are paid on twin parameters of performance & profitability of MOSt.
MOSt generally prohibits its analysts, persons reporting to analysts, and members of their households from maintaining a financial interest in the securities or derivatives of any companies that the analysts cover. Additionally,
MOSt generally prohibits its analysts and persons reporting to analysts from serving as an officer, director, or advisory board member of any companies that the analysts cover. Our salespeople, traders, and other professionals or
affiliates may provide oral or written market commentary or trading strategies to our clients that reflect opinions that are contrary to the opinions expressed herein, and our proprietary trading and investing businesses may make
investment decisions that are inconsistent with the recommendations expressed herein. In reviewing these materials, you should be aware that any or all of the foregoing among other things, may give rise to real or potential
conflicts of interest. MOSt and its affiliated company(ies), their directors and employees and their relatives may; (a) from time to time, have a long or short position in, act as principal in, and buy or sell the securities or derivatives
thereof of companies mentioned herein. (b) be engaged in any other transaction involving such securities and earn brokerage or other compensation or act as a market maker in the financial instruments of the company(ies)
discussed herein or act as an advisor or lender/borrower to such company(ies) or may have any other potential conflict of interests with respect to any recommendation and other related information and opinions.; however the
same shall have no bearing whatsoever on the specific recommendations made by the analyst(s), as the recommendations made by the analyst(s) are completely independent of the views of the affiliates of MOSt even though
there might exist an inherent conflict of interest in some of the stocks mentioned in the research report
Reports based on technical and derivative analysis center on studying charts company's price movement, outstanding positions and trading volume, as opposed to focusing on a company's fundamentals and, as such, may not
match with a report on a company's fundamental analysis. In addition MOST has different business segments / Divisions with independent research separated by Chinese walls catering to different set of customers having various
objectives, risk profiles, investment horizon, etc, and therefore may at times have different contrary views on stocks sectors and markets.
Unauthorized disclosure, use, dissemination or copying (either whole or partial) of this information, is prohibited. The person accessing this information specifically agrees to exempt MOSt or any of its affiliates or employees from,
any and all responsibility/liability arising from such misuse and agrees not to hold MOSt or any of its affiliates or employees responsible for any such misuse and further agrees to hold MOSt or any of its affiliates or employees free
and harmless from all losses, costs, damages, expenses that may be suffered by the person accessing this information due to any errors and delays. The information contained herein is based on publicly available data or other
sources believed to be reliable. Any statements contained in this report attributed to a third party represent MOSt’s interpretation of the data, information and/or opinions provided by that third party either publicly or through a
subscription service, and such use and interpretation have not been reviewed by the third party. This Report is not intended to be a complete statement or summary of the securities, markets or developments referred to in the
document. While we would endeavor to update the information herein on reasonable basis, MOSt and/or its affiliates are under no obligation to update the information. Also there may be regulatory, compliance, or other reasons
that may prevent MOSt and/or its affiliates from doing so. MOSt or any of its affiliates or employees shall not be in any way responsible and liable for any loss or damage that may arise to any person from any inadvertent error in
the information contained in this report. MOSt or any of its affiliates or employees do not provide, at any time, any express or implied warranty of any kind, regarding any matter pertaining to this report, including without limitation
the implied warranties of merchantability, fitness for a particular purpose, and non-infringement. The recipients of this report should rely on their own investigations.
This report is intended for distribution to institutional investors. Recipients who are not institutional investors should seek advice of their independent financial advisor prior to taking any investment decision based on this report or
for any necessary explanation of its contents.
Most and it’s associates may have managed or co-managed public offering of securities, may have received compensation for investment banking or merchant banking or brokerage services, may have received any compensation
for products or services other than investment banking or merchant banking or brokerage services from the subject company in the past 12 months.
Most and it’s associates have not received any compensation or other benefits from the subject company or third party in connection with the research report.
Subject Company may have been a client of Most or its associates during twelve months preceding the date of distribution of the research report
MOSt and/or its affiliates and/or employees may have interests/positions, financial or otherwise of over 1 % at the end of the month immediately preceding the date of publication of the research in the securities mentioned in this
report. To enhance transparency, MOSt has incorporated a Disclosure of Interest Statement in this document. This should, however, not be treated as endorsement of the views expressed in the report.
Motilal Oswal Securities Limited is registered as a Research Analyst under SEBI (Research Analyst) Regulations, 2014. SEBI Reg. No. INH000000412
Pending Regulatory inspections against Motilal Oswal Securities Limited:
SEBI pursuant to a complaint from client Shri C.R. Mohanraj alleging unauthorized trading, issued a letter dated 29th April 2014 to MOSL notifying appointment of an Adjudicating Officer as per SEBI regulations to hold inquiry and
adjudge violation of SEBI Regulations; MOSL replied to the Show Cause Notice whereby SEBI granted us an opportunity of Inspection of Documents. Since all the documents requested by us were not covered we have requested
to SEBI vide our letter dated June 23, 2015 to provide pending list of documents for inspection.
List of associate companies of Motilal Oswal Securities Limited -
Click here to access detailed report
Analyst Certification
The views expressed in this research report accurately reflect the personal views of the analyst(s) about the subject securities or issues, and no part of the compensation of the research analyst(s) was, is, or will be directly or
indirectly related to the specific recommendations and views expressed by research analyst(s) in this report. The research analysts, strategists, or research associates principally responsible for preparation of MOSt research
receive compensation based upon various factors, including quality of research, investor client feedback, stock picking, competitive factors and firm revenues
Disclosure of Interest Statement
Analyst ownership of the stock
Served as an officer, director or employee -
EICHER MOTORS
No
No
A graph of daily closing prices of securities is available at www.nseindia.com and http://economictimes.indiatimes.com/markets/stocks/stock-quotes
Regional Disclosures (outside India)
This report is not directed or intended for distribution to or use by any person or entity resident in a state, country or any jurisdiction, where such distribution, publication, availability or use would be contrary to law, regulation or
which would subject MOSt & its group companies to registration or licensing requirements within such jurisdictions.
For Hong Kong:
This report is distributed in Hong Kong by Motilal Oswal capital Markets (Hong Kong) Private Limited, a licensed corporation (CE AYY-301) licensed and regulated by the Hong Kong Securities and Futures
Commission (SFC) pursuant to the Securities and Futures Ordinance (Chapter 571 of the Laws of Hong Kong) “SFO”. As per SEBI (Research Analyst Regulations) 2014 Motilal Oswal Securities (SEBI Reg No. INH000000412)
has an agreement with Motilal Oswal capital Markets (Hong Kong) Private Limited for distribution of research report in Kong Kong. This report is intended for distribution only to “Professional Investors” as defined in Part I of
Schedule 1 to SFO. Any investment or investment activity to which this document relates is only available to professional investor and will be engaged only with professional investors.” Nothing here is an offer or solicitation of
these securities, products and services in any jurisdiction where their offer or sale is not qualified or exempt from registration. The Indian Analyst(s) who compile this report is/are not located in Hong Kong & are not conducting
Research Analysis in Hong Kong.
For U.S.
Motilal Oswal Securities Limited (MOSL) is not a registered broker - dealer under the U.S. Securities Exchange Act of 1934, as amended (the"1934 act") and under applicable state laws in the United States. In addition MOSL is
not a registered investment adviser under the U.S. Investment Advisers Act of 1940, as amended (the "Advisers Act" and together with the 1934 Act, the "Acts), and under applicable state laws in the United States. Accordingly, in
the absence of specific exemption under the Acts, any brokerage and investment services provided by MOSL, including the products and services described herein are not available to or intended for U.S. persons.
This report is intended for distribution only to "Major Institutional Investors" as defined by Rule 15a-6(b)(4) of the Exchange Act and interpretations thereof by SEC (henceforth referred to as "major institutional investors"). This
document must not be acted on or relied on by persons who are not major institutional investors. Any investment or investment activity to which this document relates is only available to major institutional investors and will be
engaged in only with major institutional investors. In reliance on the exemption from registration provided by Rule 15a-6 of the U.S. Securities Exchange Act of 1934, as amended (the "Exchange Act") and interpretations thereof by
the U.S. Securities and Exchange Commission ("SEC") in order to conduct business with Institutional Investors based in the U.S., MOSL has entered into a chaperoning agreement with a U.S. registered broker-dealer, Motilal
Oswal Securities International Private Limited. ("MOSIPL"). Any business interaction pursuant to this report will have to be executed within the provisions of this chaperoning agreement.
The Research Analysts contributing to the report may not be registered /qualified as research analyst with FINRA. Such research analyst may not be associated persons of the U.S. registered broker-dealer, MOSIPL, and
therefore, may not be subject to NASD rule 2711 and NYSE Rule 472 restrictions on communication with a subject company, public appearances and trading securities held by a research analyst account.
For Singapore
Motilal Oswal Capital Markets Singapore Pte Limited is acting as an exempt financial advisor under section 23(1)(f) of the Financial Advisers Act(FAA) read with regulation 17(1)(d) of the Financial Advisors Regulations and is a
subsidiary of Motilal Oswal Securities Limited in India. This research is distributed in Singapore by Motilal Oswal Capital Markets Singapore Pte Limited and it is only directed in Singapore to accredited investors, as defined in the
Financial Advisers Regulations and the Securities and Futures Act (Chapter 289), as amended from time to time.
In respect of any matter arising from or in connection with the research you could contact the following representatives of Motilal Oswal Capital Markets Singapore Pte Limited:
Varun Kumar
Varun.kumar@motilaloswal.com
Contact : (+65) 68189232
Office Address:21 (Suite 31),16 Collyer Quay,Singapore 04931
Kadambari Balachandran
kadambari.balachandran@motilaloswal.com
(+65) 68189233 / 65249115
28 October 2016
Motilal Oswal Tower, Level 9, Sayani Road, Prabhadevi, Mumbai 400 025
Phone: +91 22 3982 5500 E-mail: reports@motilaloswal.com
Motilal Oswal Securities Ltd
14