2 November 2016
2QFY17 Results Update | Sector: Cement
J K Cement
Buy
BSE SENSEX
27,527
Bloomberg
Equity Shares (m)
M.Cap.(INRb)/(USDb)
52-Week Range (INR)
1, 6, 12 Rel. Per (%)
Avg Val, INRm
Free float (%)
S&P CNX
8,514
JKCE IN
69.9
63.5 / 1.0
990 / 425
5/48/34
22
33.0
2018E
46.2
9.0
4.0
56.9
59.8
311.0
19.9
11.9
14.4
15.9
2.9
9.2
CMP: INR909
TP: INR1,107 (+22%)
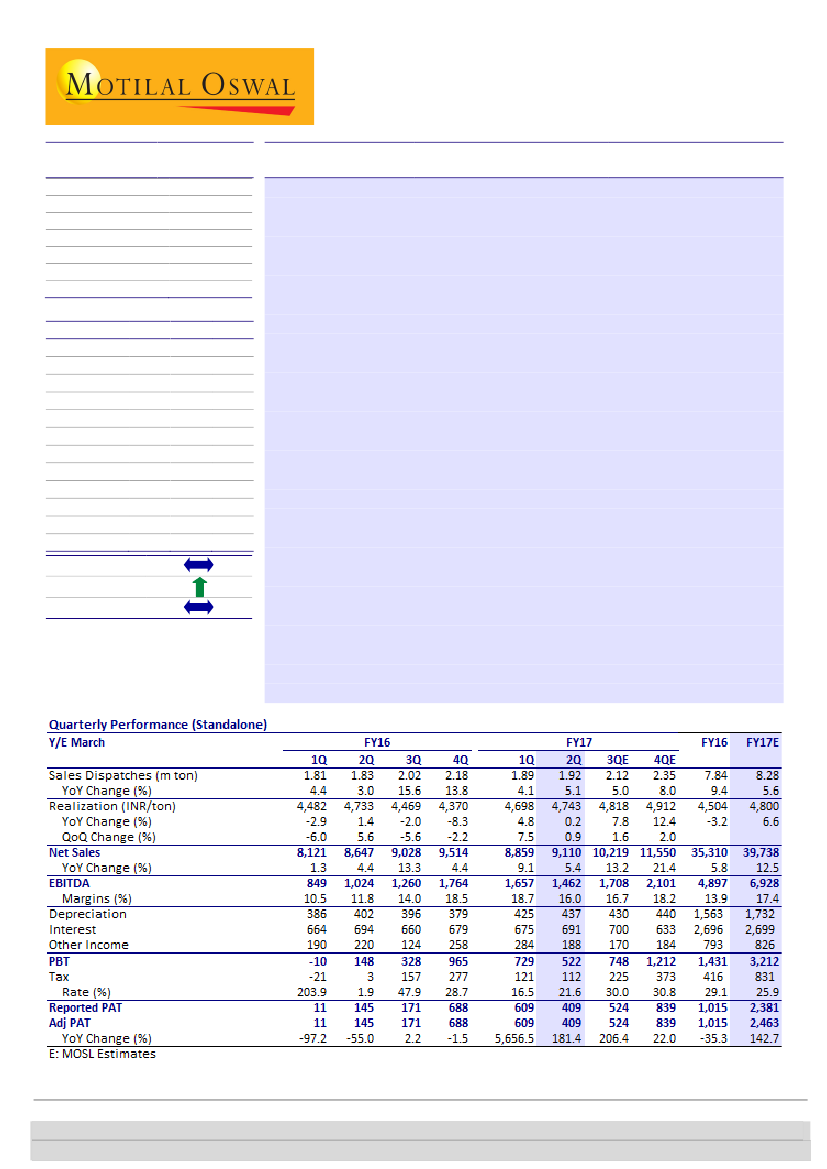
Revenues strengthened by white cement
Stable realizations and better performance in white cement drive profits:
2QFY17 revenues grew 5% YoY to INR9.1b (13% above estimate). Grey cement
revenue was flat YoY at INR6b, while white cement revenue increased 19% YoY
to INR3.1b (highest quarterly revenue). Grey cement volume growth of 3.6%
YoY was led by better performance in north, partially offset by lower volume in
south. White cement volume growth was strong at 16% YoY. Blended
realizations improved 1% QoQ (flat YoY), led by better pricing in north. PAT
increased 181% YoY to INR409m, led by lower tax outgo.
Margin expansion led by cost savings:
EBITDA grew 43% YoY (-12% QoQ) to
INR1.46b, translating into margins of 16% (-2.7pp QoQ, +4.2pp YoY). Grey
cement margin contracted 6.1% QoQ (+3.9pp YoY) to 10.9% on account of
rehab-related cost for south operations and one-time cost of INR100m in
2QFY17. White cement margin expanded 5.9pp YoY to 30%. Blended
EBITDA/ton stood at INR761 (-13% QoQ, +36% YoY), while grey cement
EBITDA/ton was INR398 (+49% YoY, -35% QoQ).
Management commentary
: 1)
White cement volume likely to grow at
~22%/15% YoY for FY17/FY18E. 2) White cement capacity can be enhanced by
0.2m tons at north operations to cater to higher demand. 3) West market and
Karnataka have witnessed price increases of INR40/bag and INR20/bag,
respectively, since Aug-16. This should bode well for its south operations. 4) RIL
has reduced petcoke prices by INR200/t effective 1-Nov-16.
Preferred leverage play on earnings growth in north-west markets:
With
lower immediate capex and FCFE of INR3.5-4b in FY17-18, there remains
visibility of deleveraging from the FY16 peak of INR27b (1.6x). We maintain our
Buy
rating with a target price of INR1,107 (EV of USD127/ton on blended
capacity, 10x FY18E grey cement EBITDA and 9x FY18E white cement EBITDA).
Financials & Valuations (INR b)
2016 2017E
Y/E Mar
Sales
35.3
39.7
EBITDA
4.9
6.9
NP
1.0
2.5
Adj EPS (INR)
14.5
35.6
EPS Gr. (%)
-18.8 145.5
BV/Sh. (INR)
232.4 262.2
RoE (%)
6.3
14.4
RoCE (%)
6.2
9.2
Payout (%)
32.2
16.4
P/E (x)
62.6
25.5
P/BV (x)
3.9
3.5
EV/EBITDA (x)
17.8
12.5
Estimate change
TP change
Rating change
Abhishek Ghosh
(Abhishek.Ghosh@motilaloswal.com); +91 22 3982 5436
Varun Gadia
(Varun.gadia@motilaloswal.com); +91 22 3982 5446
Investors are advised to refer through important disclosures made at the last page of the Research Report.
Motilal Oswal research is available on www.motilaloswal.com/Institutional-Equities, Bloomberg, Thomson Reuters, Factset and S&P Capital.

J K Cement
Valuation and views
Medium-term growth levers strong:
Post 3mt expansion, JKCE’s North capacity
is operating at ~66% utilization (new plant at near maximum and older units at
~50%). This coupled with 60% utilization in the South plant provides headroom
to outperform industry growth. Market mix is healthy, with North & West India
accounting for ~70% of its dispatches and likely to benefit from incremental
demand from mega infrastructure projects. JKCE has limestone reserve of
375mt to add a further 5-6mt in its North line with low incremental capex.
Vintage issues partially offset by induced efficiencies:
JKCE’s grey cement
profitability lagged peers in the past due to (a) older plants (low operating
efficiency) and (b) higher lead distance/freight cost (absence of split grinding).
New plants at Mangrol and Jhajjar offer better cost structure (energy/total cost
lower by INR150/300 per ton); railway siding enables savings on in-bound
logistics. While blended operating efficiency may be diluted, its grey cement
cost structure would remain better than past, with induced efficiencies and
economies of scale.
White cement a cash cow:
It is the second largest player in the duopolistic white
cement industry in India, with 40% market share. Moderation in white cement
growth (owing to lower exports to the Middle East) would be offset by healthy
growth in putty and 0.2mt expansion in Katni (Madhya Pradesh) by FY16-end.
With INR3b-3.5b of steady EBITDA cushion, white cement business remains a
cash cow.
Middle East a drag on return ratios:
UAE white cement plant (0.6mt) has been a
drag on return ratios (INR9b capital employed 20% of overall capital employed),
with net loss due to (a) weaker demand in the Middle East (oil price fall), and (b)
unavailability of grid power hurting profitability (resolution nearing).
Preferred leverage play on earning growth of north-west market:
With lower
immediate capex and FCFE of INR3.5-4b in FY17-18, there remains visibility of
deleveraging from the FY16 peak of INR27b (1.6x). We maintain our
Buy
rating
with a target price of INR1107 (EV of USD127/ton on blended capacity, 10x
FY18E grey cement EBITDA and 9x FY18E white cement EBITDA).
Exhibit 1: Key performance indicators (blended)
INR/Ton
Net realization
RM Cost
Employee Expenses
Power, Oil & Fuel
Freight
Other Expenses
Total Exp
EBITDA
2QFY17
4,743
919
356
790
925
992
3,982
761
2QFY16
4,733
974
316
1,061
984
838
4,173
560
YoY (%)
0.2
-5.6
12.7
-25.6
-6.0
18.4
-4.6
35.8
1QFY17
4,698
901
349
736
902
932
3,820
879
QoQ (%)
0.9
2
2
7
3
6
4
-13
Source: Company, MOSL
2 November 2016
2

J K Cement
Exhibit 2: JKCE: Sum of the parts valuation
Grey Cement
White Cement
UAE White Cement
EV (INR m)
Consol Net debt (INR m)
Equity value (INR m)
Equity value (INR/Shr)
Implied EV/Ton (blended)
EV/EBITDA
10.0
9
7
FY18E
55,608
33,515
7,691
96,814
19,399
77,414
1,107
127
Exhibit 3: Revenue mix (%)
White
Grey
Exhibit 4: Strong Grey Cement volume growth for North (%)
18
2
-5
-16
-7
Grey Volume (mt)
22 22
5
0
Growth(%)
15
11
16
4 3
13
1.4 3.6
13
6
Source: Company, MOSL
Exhibit 5: White cement mix (%)
White Cement
Wall Care Putty
Exhibit 6: Grey Cement EBITDA/ton decreased to INR398
Grey EBITDA/ton
Source: Company, MOSL
Exhibit 7: White cement volume gaining strength (%)
42
30
17
21
Exhibit 8: White cement realizations were higher QoQ
(INR/ton)
White (incl Putty)
25
19
23
12 13 12
16
7
9
5 4
11
25
19
16
Source: Company, MOSL
2 November 2016
Source: Company, MOSL
3

J K Cement
Exhibit 9: Strong growth in White cement profitability led by
increase in realizations (INR/ton)
White (incl Putty)
Exhibit 10: Blended EBITDA/ton down by 13% QoQ due to
increase in Power and Fuel and Raw Material costs
Blended EBITDA/Ton
Source: Company, MOSL
2 November 2016
4

J K Cement
Story in charts
Exhibit 11: Strong volume lever in place with expanded
capacity
Capacity (mt)
94
68
71
76
72
76
60
66
69
40
18
18
15
60
49
Volume mix
Source: Company, MOSL
Dispatch (mt)
Utilization (%)
Exhibit 12:
Market mix getting better (%)
North
South
East
West
Central
57
FY08 FY10 FY11 FY12 FY13 FY14 FY15 FY16 FY17E FY18E
Source: Company, MOSL
Capacity mix
Exhibit 13: Grey cement EBITDA/ton to improve as
operating leverage and cost triggers kick in (INR)
Exhibit 14: Trend in EBITDA (INR b)
Grey
White (Domestic)
White (UAE)
1.1
0.7
0.4
1.0
3.6
1.2
1.6
1.6
3.6
2.0
3.6
2.2
1.6
0.2
2.5
3.0
3.8
3.4
5.6
3.7
1,010 835
306
667
637
298
332
309
525
701
FY08 FY10 FY11 FY12 FY13 FY14 FY15 FY16 FY17E FY18E
Source: Company, MOSL
2.1 2.1
-0.1
FY08 FY10 FY11 FY12 FY13 FY14 FY15E FY16E FY17E FY18E
Source: Company, MOSL
3.8
Exhibit 15: Gearing peaked out
Net debt (INR b)
1.3
0.8
0.6
10.6
8.5
0.5
8.4
23.0 25.8 26.7 25.9 25.4
1.6
DER (x)
1.6
1.4
1.2
0.7
0.4
4.4
9.4
Exhibit 16: RoE and RoCE Trend (%)
30
25
20
15
10
5
0
RoE
RoCE
FY08 FY10 FY11 FY12 FY13 FY14 FY15 FY16 FY17E FY18E
Source: Company, MOSL
2 November 2016
5

J K Cement
Financials and Valuations
Income Statement
Y/E March
Net Sales
Change (%)
Total Expenditure
% of Sales
EBITDA
Margin (%)
Depreciation
EBIT
Int. and Finance Charges
Other Income - Rec.
PBT bef. EO Exp.
EO Expense/(Income)
PBT after EO Exp.
Current Tax
Deferred Tax
Tax Rate (%)
Reported PAT
PAT Adj for EO items
Change (%)
Margin (%)
Less: Mionrity Interest
Net Profit
2012
25,379
21.8
20,329
80.1
5,050
19.9
1,256
3,794
1,443
558
2,908
78
2,830
902
182
38.3
1,746
1,794
214.2
7.1
0
1,794
2013
29,040
14.4
23,547
81.1
5,493
18.9
1,287
4,206
1,398
567
3,375
0
3,375
1,071
0
31.7
2,305
2,305
28.5
7.9
-3.083
2,308
2014
27,815
-4.2
24,431
87.8
3,384
12.2
1,342
2,042
1,526
626
1,142
0
1,142
392
0
34.4
749
749
-67.5
2.7
-22.1
772
2015
33,874
21.8
29,566
87.3
4,308
12.7
1,461
2,847
2,291
713
1,269
-172
1,441
22
0
1.5
1,419
1,250
66.8
3.7
-17.2
1,267
2016
35,310
4.2
30,413
86.1
4,897
13.9
1,563
3,334
2,696
793
1,431
0
1,431
416
0
29.1
1,015
1,015
-18.8
2.9
0.0
1,015
2017E
39,738
12.5
32,809
82.6
6,928
17.4
1,732
5,196
2,699
826
3,323
0
3,323
997
-166
25.0
2,492
2,492
145.5
6.3
0.0
2,492
(INR Million)
2018E
46,234
16.3
37,208
80.5
9,026
19.5
1,745
7,281
2,765
793
5,309
0
5,309
1,593
-265
25.0
3,982
3,982
59.8
8.6
0.0
3,982
Balance Sheet
Y/E March
Equity Share Capital
Total Reserves
Net Worth
Deferred Liabilities
Total Loans
Capital Employed
Gross Block
Less: Accum. Deprn.
Net Fixed Assets
Capital WIP
Total Investments
Curr. Assets, Loans&Adv.
Inventory
Account Receivables
Cash and Bank Balance
Loans and Advances
Curr. Liability & Prov.
Account Payables
Provisions
Net Current Assets
Appl. of Funds
E: MOSL Estimates
2012
699
14,522
15,221
2,291
12,963
30,475
29,013
5,845
23,167
904
92
11,596
3,628
837
4,332
2,799
5,284
2,286
630
6,312
30,476
2013
699
16,206
16,905
2,490
12,482
31,925
30,822
7,132
23,690
2,546
324
13,518
4,614
1,153
3,753
3,998
8,152
1,966
799
5,365
31,925
2014
699
16,762
17,462
2,685
27,750
48,041
31,743
8,474
23,269
17,875
675
15,814
5,420
1,117
4,086
5,191
9,592
4,401
497
6,222
48,041
2015
699
15,470
16,170
2,798
30,308
49,404
50,671
9,935
40,736
3,373
365
16,027
5,415
1,771
4,171
4,670
11,097
3,071
673
4,929
49,404
2016
699
15,556
16,255
3,284
32,272
51,910
53,716
11,498
42,218
3,211
806
16,909
5,384
2,113
4,807
4,604
11,235
3,047
707
5,674
51,910
2017E
699
17,639
18,338
3,118
31,272
52,826
55,927
13,230
42,697
3,000
675
17,183
5,305
2,381
4,698
4,799
10,729
3,031
498
6,454
52,826
(INR Million)
2018E
699
21,048
21,747
2,853
30,272
54,970
57,927
14,975
42,952
3,000
675
19,989
5,731
2,770
6,198
5,290
11,646
3,527
478
8,343
54,970
2 November 2016
6

J K Cement
Financials and Valuations
Ratios
Y/E March
Basic (INR) *
Consol EPS
Cash EPS
BV/Share
DPS
Payout (%)
Valuation (x) *
P/E
Cash P/E
P/BV
EV/Sales
EV/EBITDA
EV/Ton (US$)
Dividend Yield (%)
Return Ratios (%)
RoIC
RoE
RoCE
Working Capital Ratios
Asset Turnover (x)
Inventory (Days)
Debtor (Days)
Leverage Ratio (x)
Current Ratio
Debt/Equity
2012
25.7
43.6
217.7
5.0
23.3
2013
33.0
51.4
241.7
6.5
23.1
2014
10.7
29.9
249.7
3.0
32.7
2015
17.9
38.8
231.2
4.0
23.1
50.8
23.4
3.9
2.5
19.9
114
0.4
9.2
12.3
9.6
0.8
52.2
11
2.2
0.9
11.4
14.4
11.3
0.9
58.0
13
1.7
0.7
5.3
4.5
4.7
0.6
71.1
13
1.6
1.6
8.4
7.5
7.6
0.7
58.3
17
1.4
1.9
2016
14.5
36.9
232.4
4.0
32.2
62.6
24.6
3.9
2.5
17.8
115
0.4
5.6
6.3
6.2
0.7
55.7
19
1.5
2.0
2017E
35.6
60.4
262.2
5.0
16.4
25.5
15.0
3.5
2.2
12.5
114
0.6
8.9
14.4
9.2
0.8
48.7
19
1.6
1.7
2018E
56.9
81.9
311.0
7.0
14.4
15.9
11.1
2.9
1.8
9.3
110
0.8
12.2
19.9
11.9
0.8
45.2
19
1.7
1.4
Cash Flow Statement
Y/E March
Oper. Profit/(Loss) before Tax
Interest/Dividends Recd.
Depreciation
Direct Taxes Paid
(Inc)/Dec in WC
CF from Operations
EO expense
CF from Operating incl EO
(inc)/dec in FA
Free Cash Flow
(Pur)/Sale of Investments
CF from investments
Issue of Shares
(Inc)/Dec in Debt
Interest Paid
Dividend Paid
CF from Fin. Activity
Inc/Dec of Cash
Add: Beginning Balance
Closing Balance
2012
3,794
558
1,256
-902
633
5,338
29
5,368
-1,439
3,929
-50
-1,489
-68
-845
-1,443
-406
-2,761
1,117
3,215
4,332
2013
4,206
567
1,287
-872
419
5,608
-1
5,607
-3,451
2,156
-232
-3,683
-91
-481
-1,398
-532
-2,503
-579
4,332
3,753
2014
2,042
626
1,342
-198
-528
3,284
4
3,288
-16,250
-12,962
-351
-16,601
30
15,268
-1,526
-245
13,527
214
3,753
3,967
2015
2,847
713
1,461
91
1,550
6,662
0
6,662
-4,426
2,237
310
-4,116
-2,401
2,558
-2,291
-327
-2,462
85
4,086
4,171
2016
3,334
793
1,563
70
-109
5,651
0
5,651
-2,883
2,768
-441
-3,324
-602
1,965
-2,696
-327
-1,661
666
4,171
4,837
(INR Million)
2017E
5,196
826
1,732
-997
-889
5,868
0
5,868
-2,000
3,868
131
-1,869
0
-1,000
-2,699
-409
-4,109
-109
4,807
4,698
2018E
7,281
793
1,745
-1,593
-389
7,837
0
7,837
-2,000
5,837
0
-2,000
0
-1,000
-2,765
-573
-4,337
1,500
4,698
6,198
2 November 2016
7

J K Cement
Corporate profile
Company description
JKCE is one of India's leading cement producers,
with 7.5mtpa of gray cement capacity -4.5mtpa in
the North (Rajasthan) and 3mtpa in the South
(Karnataka). It is the second largest white cement
manufacturer in India, with a capacity of 0.4mtpa
(0.6mtpa by FY14). Its ongoing 3mtpa split grinding
expansion in the North would take its gray cement
capacity to 10.5mtpa by FY15. JKCE is also
expanding its international footprint through a
0.6mtpa Greenfield white cement plant in UAE to
address rising international demand.
Exhibit 1: Sensex rebased
Source: MOSL/Bloomberg
Exhibit 2: Shareholding pattern (%)
Sep-16
Promoter
DII
FII
Others
67.0
14.1
11.2
7.6
Jun-16
67.0
13.7
11.3
7.9
Sep-15
67.0
14.0
11.0
8.1
Source: Capitaline
Exhibit 3: Top holders
Holder Name
Fidellity Investment Trust Fidelity Series
HDFC Standard Life Insurance Co.Ltd
Franklin Templeton Investment Funds
Franklin Templetion Mutual Fund A/c
Templeton Global Investment Trust
% Holding
4.6
3.8
3.2
1.9
1.1
Source: Capitaline
Note: FII Includes depository receipts
Exhibit 4: Top management
Name
Yadupati Singhania
Shambhu Singh
Designation
Chairman
&
Managing
Director
Company Secretary
Exhibit 5: Directors
Name
Achintya Karati
K B Agarwal
Paul Hugentobler
Suparas Bhandari
S L Bansal
Name
Jayant Narayan Godbole
Kailash Nath Khandelwal
Raj Kumar Lohia
Sushila Devi Singhania
Source: Capitaline
*Independent
Exhibit 6: Auditors
Name
K G Goyal & Co
P L Tandon & Co
Type
Cost Auditor
Statutory
Exhibit 7: MOSL forecast v/s consensus
EPS
(INR)
FY17
FY18
MOSL
forecast
35.6
56.9
Consensus
forecast
34.8
55.3
Variation (%)
2.3
3.0
Source: Bloomberg
Source: Capitaline
2 November 2016
8

J K Cement
NOTES
2 November 2016
9

Disclosures
This document has been prepared by Motilal Oswal Securities Limited (hereinafter referred to as Most) to provide information about the company (ies) and/sector(s), if any, covered in the report and may be distributed by it and/or
J K Cement
its affiliated company(ies). This report is for personal information of the selected recipient/s and does not construe to be any investment, legal or taxation advice to you. This research report does not constitute an offer, invitation or
inducement to invest in securities or other investments and Motilal Oswal Securities Limited (hereinafter referred as MOSt) is not soliciting any action based upon it. This report is not for public distribution and has been furnished to
you solely for your general information and should not be reproduced or redistributed to any other person in any form. This report does not constitute a personal recommendation or take into account the particular investment
objectives, financial situations, or needs of individual clients. Before acting on any advice or recommendation in this material, investors should consider whether it is suitable for their particular circumstances and, if necessary, seek
professional advice. The price and value of the investments referred to in this material and the income from them may go down as well as up, and investors may realize losses on any investments. Past performance is not a guide
for future performance, future returns are not guaranteed and a loss of original capital may occur.
MOSt and its affiliates are a full-service, integrated investment banking, investment management, brokerage and financing group. We and our affiliates have investment banking and other business relationships with a some
companies covered by our Research Department. Our research professionals may provide input into our investment banking and other business selection processes. Investors should assume that MOSt and/or its affiliates are
seeking or will seek investment banking or other business from the company or companies that are the subject of this material and that the research professionals who were involved in preparing this material may educate
investors on investments in such business . The research professionals responsible for the preparation of this document may interact with trading desk personnel, sales personnel and other parties for the purpose of gathering,
applying and interpreting information. Our research professionals are paid on twin parameters of performance & profitability of MOSt.
MOSt generally prohibits its analysts, persons reporting to analysts, and members of their households from maintaining a financial interest in the securities or derivatives of any companies that the analysts cover. Additionally,
MOSt generally prohibits its analysts and persons reporting to analysts from serving as an officer, director, or advisory board member of any companies that the analysts cover. Our salespeople, traders, and other professionals or
affiliates may provide oral or written market commentary or trading strategies to our clients that reflect opinions that are contrary to the opinions expressed herein, and our proprietary trading and investing businesses may make
investment decisions that are inconsistent with the recommendations expressed herein. In reviewing these materials, you should be aware that any or all of the foregoing among other things, may give rise to real or potential
conflicts of interest. MOSt and its affiliated company(ies), their directors and employees and their relatives may; (a) from time to time, have a long or short position in, act as principal in, and buy or sell the securities or derivatives
thereof of companies mentioned herein. (b) be engaged in any other transaction involving such securities and earn brokerage or other compensation or act as a market maker in the financial instruments of the company(ies)
discussed herein or act as an advisor or lender/borrower to such company(ies) or may have any other potential conflict of interests with respect to any recommendation and other related information and opinions.; however the
same shall have no bearing whatsoever on the specific recommendations made by the analyst(s), as the recommendations made by the analyst(s) are completely independent of the views of the affiliates of MOSt even though
there might exist an inherent conflict of interest in some of the stocks mentioned in the research report
Reports based on technical and derivative analysis center on studying charts company's price movement, outstanding positions and trading volume, as opposed to focusing on a company's fundamentals and, as such, may not
match with a report on a company's fundamental analysis. In addition MOST has different business segments / Divisions with independent research separated by Chinese walls catering to different set of customers having various
objectives, risk profiles, investment horizon, etc, and therefore may at times have different contrary views on stocks sectors and markets.
Unauthorized disclosure, use, dissemination or copying (either whole or partial) of this information, is prohibited. The person accessing this information specifically agrees to exempt MOSt or any of its affiliates or employees from,
any and all responsibility/liability arising from such misuse and agrees not to hold MOSt or any of its affiliates or employees responsible for any such misuse and further agrees to hold MOSt or any of its affiliates or employees free
and harmless from all losses, costs, damages, expenses that may be suffered by the person accessing this information due to any errors and delays. The information contained herein is based on publicly available data or other
sources believed to be reliable. Any statements contained in this report attributed to a third party represent MOSt’s interpretation of the data, information and/or opinions provided by that third party either publicly or through a
subscription service, and such use and interpretation have not been reviewed by the third party. This Report is not intended to be a complete statement or summary of the securities, markets or developments referred to in the
document. While we would endeavor to update the information herein on reasonable basis, MOSt and/or its affiliates are under no obligation to update the information. Also there may be regulatory, compliance, or other reasons
that may prevent MOSt and/or its affiliates from doing so. MOSt or any of its affiliates or employees shall not be in any way responsible and liable for any loss or damage that may arise to any person from any inadvertent error in
the information contained in this report. MOSt or any of its affiliates or employees do not provide, at any time, any express or implied warranty of any kind, regarding any matter pertaining to this report, including without limitation
the implied warranties of merchantability, fitness for a particular purpose, and non-infringement. The recipients of this report should rely on their own investigations.
This report is intended for distribution to institutional investors. Recipients who are not institutional investors should seek advice of their independent financial advisor prior to taking any investment decision based on this report or
for any necessary explanation of its contents.
Most and it’s associates may have managed or co-managed public offering of securities, may have received compensation for investment banking or merchant banking or brokerage services, may have received any compensation
for products or services other than investment banking or merchant banking or brokerage services from the subject company in the past 12 months.
Most and it’s associates have not received any compensation or other benefits from the subject company or third party in connection with the research report.
Subject Company may have been a client of Most or its associates during twelve months preceding the date of distribution of the research report
MOSt and/or its affiliates and/or employees may have interests/positions, financial or otherwise of over 1 % at the end of the month immediately preceding the date of publication of the research in the securities mentioned in this
report. To enhance transparency, MOSt has incorporated a Disclosure of Interest Statement in this document. This should, however, not be treated as endorsement of the views expressed in the report.
Motilal Oswal Securities Limited is registered as a Research Analyst under SEBI (Research Analyst) Regulations, 2014. SEBI Reg. No. INH000000412
Pending Regulatory inspections against Motilal Oswal Securities Limited:
SEBI pursuant to a complaint from client Shri C.R. Mohanraj alleging unauthorized trading, issued a letter dated 29th April 2014 to MOSL notifying appointment of an Adjudicating Officer as per SEBI regulations to hold inquiry and
adjudge violation of SEBI Regulations; MOSL replied to the Show Cause Notice whereby SEBI granted us an opportunity of Inspection of Documents. Since all the documents requested by us were not covered we have requested
to SEBI vide our letter dated June 23, 2015 to provide pending list of documents for inspection.
List of associate companies of Motilal Oswal Securities Limited -
Click here to access detailed report
Analyst Certification
The views expressed in this research report accurately reflect the personal views of the analyst(s) about the subject securities or issues, and no part of the compensation of the research analyst(s) was, is, or will be directly or
indirectly related to the specific recommendations and views expressed by research analyst(s) in this report. The research analysts, strategists, or research associates principally responsible for preparation of MOSt research
receive compensation based upon various factors, including quality of research, investor client feedback, stock picking, competitive factors and firm revenues
Disclosure of Interest Statement
Analyst ownership of the stock
Served as an officer, director or employee -
JK CEMENT
No
No
A graph of daily closing prices of securities is available at www.nseindia.com and http://economictimes.indiatimes.com/markets/stocks/stock-quotes
Regional Disclosures (outside India)
This report is not directed or intended for distribution to or use by any person or entity resident in a state, country or any jurisdiction, where such distribution, publication, availability or use would be contrary to law, regulation or
which would subject MOSt & its group companies to registration or licensing requirements within such jurisdictions.
For Hong Kong:
This report is distributed in Hong Kong by Motilal Oswal capital Markets (Hong Kong) Private Limited, a licensed corporation (CE AYY-301) licensed and regulated by the Hong Kong Securities and Futures
Commission (SFC) pursuant to the Securities and Futures Ordinance (Chapter 571 of the Laws of Hong Kong) “SFO”. As per SEBI (Research Analyst Regulations) 2014 Motilal Oswal Securities (SEBI Reg No. INH000000412)
has an agreement with Motilal Oswal capital Markets (Hong Kong) Private Limited for distribution of research report in Kong Kong. This report is intended for distribution only to “Professional Investors” as defined in Part I of
Schedule 1 to SFO. Any investment or investment activity to which this document relates is only available to professional investor and will be engaged only with professional investors.” Nothing here is an offer or solicitation of
these securities, products and services in any jurisdiction where their offer or sale is not qualified or exempt from registration. The Indian Analyst(s) who compile this report is/are not located in Hong Kong & are not conducting
Research Analysis in Hong Kong.
For U.S.
Motilal Oswal Securities Limited (MOSL) is not a registered broker - dealer under the U.S. Securities Exchange Act of 1934, as amended (the"1934 act") and under applicable state laws in the United States. In addition MOSL is
not a registered investment adviser under the U.S. Investment Advisers Act of 1940, as amended (the "Advisers Act" and together with the 1934 Act, the "Acts), and under applicable state laws in the United States. Accordingly, in
the absence of specific exemption under the Acts, any brokerage and investment services provided by MOSL, including the products and services described herein are not available to or intended for U.S. persons.
This report is intended for distribution only to "Major Institutional Investors" as defined by Rule 15a-6(b)(4) of the Exchange Act and interpretations thereof by SEC (henceforth referred to as "major institutional investors"). This
document must not be acted on or relied on by persons who are not major institutional investors. Any investment or investment activity to which this document relates is only available to major institutional investors and will be
engaged in only with major institutional investors. In reliance on the exemption from registration provided by Rule 15a-6 of the U.S. Securities Exchange Act of 1934, as amended (the "Exchange Act") and interpretations thereof by
the U.S. Securities and Exchange Commission ("SEC") in order to conduct business with Institutional Investors based in the U.S., MOSL has entered into a chaperoning agreement with a U.S. registered broker-dealer, Motilal
Oswal Securities International Private Limited. ("MOSIPL"). Any business interaction pursuant to this report will have to be executed within the provisions of this chaperoning agreement.
The Research Analysts contributing to the report may not be registered /qualified as research analyst with FINRA. Such research analyst may not be associated persons of the U.S. registered broker-dealer, MOSIPL, and
therefore, may not be subject to NASD rule 2711 and NYSE Rule 472 restrictions on communication with a subject company, public appearances and trading securities held by a research analyst account.
For Singapore
Motilal Oswal Capital Markets Singapore Pte Limited is acting as an exempt financial advisor under section 23(1)(f) of the Financial Advisers Act(FAA) read with regulation 17(1)(d) of the Financial Advisors Regulations and is a
subsidiary of Motilal Oswal Securities Limited in India. This research is distributed in Singapore by Motilal Oswal Capital Markets Singapore Pte Limited and it is only directed in Singapore to accredited investors, as defined in the
Financial Advisers Regulations and the Securities and Futures Act (Chapter 289), as amended from time to time.
In respect of any matter arising from or in connection with the research you could contact the following representatives of Motilal Oswal Capital Markets Singapore Pte Limited:
Varun Kumar
Varun.kumar@motilaloswal.com
Contact : (+65) 68189232
Office Address:21 (Suite 31),16 Collyer Quay,Singapore 04931
Motilal Oswal Securities Ltd
2 November 2016
Motilal Oswal Tower, Level 9, Sayani Road, Prabhadevi, Mumbai 400 025
Phone: +91 22 3982 5500 E-mail: reports@motilaloswal.com
10