3 November 2016
2QFY17 Result Update | Sector: NBFC
Cholamandalam Invst. & Fin.
BSE SENSEX
27430
BLOOMBERG
Equity Shares (cr)
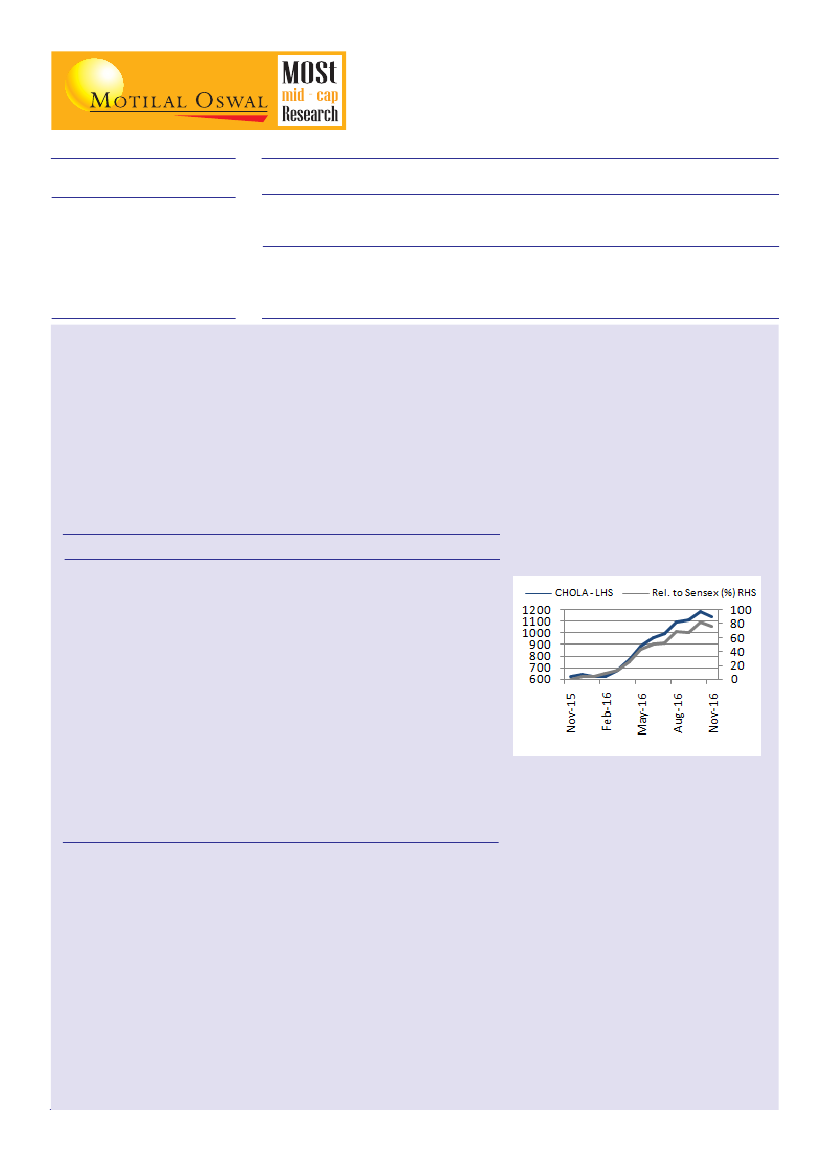
52-Week Range (Rs)
1,6,12 Abs.Perf.(%)
M.Cap. (Rs cr)
S&P CNX
8485
CIFC:IN
15.6
1243/590
-2/36/84
16,264
CMP: INR1136
YEAR NET INC PAT
END
FY16
FY17E
FY18E
EPS
TP: INR1320 (+16%) Accumulate
EPS
Gr.(%)
31
34
32
PE
(X)
31.2
23.2
17.6
ABV
(INR)
221
266
331
P/BV
(X)
4.8
4.1
3.3
P/ABV ROAA
(X)
5.1
4.3
3.4
(%)
2.3
2.3
2.6
ROAE
(%)
16.7
17.5
18.9
(INRCr) (INRCr) (INRCr)
2142
2511
2989
567
762
1003
36
49
64
Result Highlights: In-line; AUM growth continues, lower provisioning drives PAT growth of 42%
Chola's Net Income grew by 17% to INR 593cr backed by AUM growth of 19% to INR 31,832cr. PAT has grown by
42% YoY to INR 171cr aided by lower provisioning (decline of 33% YoY) and is in line with our estimate of INR 172cr.
A recovery in the CV industry (50% of Chola's AUM) translated into resumption of growth for Chola over the last four
quarters. Disbursement growth was strong during the quarter at 21%. Consequently AUM growth was at a 10 quarter
high of 19%. The LCV/SCV loan book (32% of AUM) witnessed a recovery in growth to 8% while the HCV segment
(18% of AUM) witnessed 47% growth. Home finance (30% of AUM) grew at 18%. We expect the turnaround in AUM
growth for LCV/SCV book to sustain going forward as the industry comes out of a three year downturn combined with
transport operators witnessing highest capacity utilisation since FY12.
GNPAs were stable QoQ at 3.5% against 3.6% on 4 month basis.
2QFY16
506
1QFY17 2QFY17
560
226
334
80
254
89
165
18
30
8.4
40
3.6
2.5
17.8
593
252
341
77
263
92
171
19
21
8.4
43
3.5
2.4
17.7
YoY
17
21
14
(33)
44
47
42
QoQ
FY16 FY17E
YoY
17
22
14
(28)
34
34
34
INRCr
Net Income
6 2,142 2,511
11
845 1,033
Operating Expenses 208
Operating Profit
Provisions
Profit Before Tax
Tax Provisions
Net Profit
Loan Growth (%)
Disbursements (%)
NIMs (%)
C/I Ratio (%)
298
115
183
63
120
10
21
8.5
41
2 1,296 1,478
(4)
4
4
4
427
309
869 1,169
302
567
24
21
8.7
39
3.5
2.3
16.7
406
762
18
24
8.4
41
3.4
2.3
17.5
Gross NPAs (%) - 4m4.4
ROA (%)
ROE (%)
2.0
14.3
Valuation and view
Chola's branch network (637) has gone up over 4x since FY10 and is up 70% since FY12 whereas, peers have increased
their branches by just 20% over the same period. This is reflected in Chola's higher cost/income ratio at 43% vs peer
group average of 32%. However, with the recovery in the CV cycle (especially LCVs), Chola shall enjoy significant operating
leverage which would enable it to grow its profits at 30% CAGR over FY16-18E.
The management expects home loans business to grow aggressively in coming years and reach the size of its Home
Equity business (LAP) over a five year period, thereby lowering Chola's dependence on the vehicle finance business.
Diversification of loan book towards home loans, sustained recovery in the CV cycle and a decline in credit costs should
transform the business to 3.0% ROA from the current ROA of 2.4% in coming years. We value the company at 3.5x its Sep
2018 ABV and arrive at a target of INR 1,320 (earlier INR 1,160 at 3.5x FY18 ABV). We maintain our "Accumulate" rating on
the stock, as it has witnessed a steep run up over the last six months and now trades at a premium to its vehicle financing
peers.
Jehan Bhadha (jehan.bhadha@MotilalOswal.com); Tel: +91 22 33124915 Dharmesh Kant (Dharmesh.Kant@motilaloswal.com); l:+912230102470
Investors are advised to refer through important disclosures made at the last page of the Research Report.
Motilal Oswal research is available on www.motilaloswal.com/Institutional-Equities, Bloomberg, Thomson Reuters, Factset and S&P Capital.